|
|
市場調査レポート
商品コード
1512081
生産性管理ソフトウェア市場規模、シェア、動向分析レポート:ソリューション別、展開別、企業規模別、産業別、地域別、セグメント別予測、2024年~2030年Productivity Management Software Market Size, Share & Trends Analysis Report By Solution, By Deployment (Cloud, On-premise), By Enterprise Size (Small & Medium Enterprise, Large Enterprise), By Industry, By Region, And Segment Forecasts, 2024 - 2030 |
||||||

|
|||||||
カスタマイズ可能
|
|||||||

| 生産性管理ソフトウェア市場規模、シェア、動向分析レポート:ソリューション別、展開別、企業規模別、産業別、地域別、セグメント別予測、2024年~2030年 |
|
出版日: 2024年06月27日
発行: Grand View Research
ページ情報: 英文 125 Pages
納期: 2~10営業日
|

全表示
- 概要
- 図表
- 目次
生産性管理ソフトウェア市場の成長と動向:
Grand View Research, Inc.の最新レポートによると、世界の生産性管理ソフトウェア市場規模は、2024年から2030年にかけて14.1%のCAGRで成長し、2030年には1,497億4,000万米ドルに達すると推定されています。
生産性管理ソフトウェアは、組織が効率を高め、ワークフローを合理化し、様々なプロセスでパフォーマンスを最適化することを可能にします。このソフトウェアは、プロジェクト、タスク、目標を整理し追跡することで、個人や組織の生産性管理を容易にします。目標の設定、タスクの管理、カレンダーの統合、チームのコラボレーションなど、さまざまな機能を提供し、企業が生産性を維持しながら、成果の評価を促進することを可能にします。
企業は、利益を最大化するために業務コストを削減することにますます重点を置くようになっており、生産性の向上はこの目標を達成する上で極めて重要です。このことを認識し、企業は生産性管理ソフトウェアのようなテクノロジー主導のソリューションに目を向けています。このソフトウェアは、生産性を管理し、より効率的な職場環境を育成し、コストを削減するための集中型プラットフォームを提供します。
さらに、ウェアラブルやIoTデバイスは、従業員の活動、職場環境、福利厚生に関連する貴重なデータを収集することができます。生産性管理ソフトウェアは、このデータを統合して、個人やチームのパフォーマンスに関する洞察をリアルタイムで提供することができます。例えば、スマートウォッチは労働時間を追跡し、燃え尽きを防ぐために休憩を提案することができ、ワークスペースのセンサーは空気の質と温度を監視し、最適な労働条件の調整を促すことができます。生産性向上ソフトウェアは、ウェアラブルやIoTデバイスからのデータを活用することで、ユーザー体験をパーソナライズし、最適化されたワークフローを提案し、組織全体の効率化を促進することができます。
生産性管理ソフトウェア市場レポートハイライト
- ソリューション別では、コンテンツ管理&コラボレーション分野が2023年の売上高シェア35.3%で市場を独占。また、コラボレーション・ツールは、場所を問わず、チーム・メンバー間のリアルタイム・コミュニケーションとコラボレーションを可能にします。これにより、チームワークが強化され、電子メールや電話の往復に費やす時間が短縮されます。
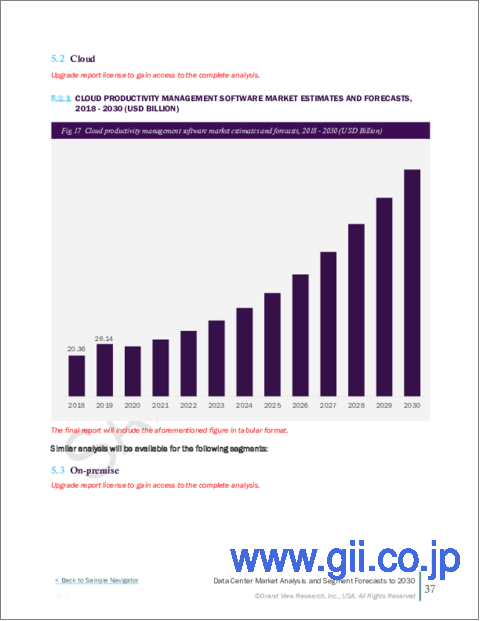
- デプロイメントに基づくと、クラウド分野は2024年から2030年にかけてCAGR 17.0%を記録すると予測されます。クラウドベースの生産性管理ソフトウェアは、どこからでもアクセスできるなどの利点があり、同分野の成長を牽引しています。
- 企業別では、中小企業セグメントが2023年に56.5%の最大の売上シェアを占めました。生産性管理ソフトウェアが提供する機能により、中小企業はチームワークを強化し、電子メールや電話の往復に費やす時間を削減し、全体的な生産性を向上させることができます。
- 業種別では、BFSI分野が2024年から2030年にかけて市場の大幅なCAGR成長が見込まれています。生産性管理ソフトウェアは、BFSI業界において、業務の合理化、効率性の向上、規制遵守の確保によって重要な役割を果たしています。また、顧客情報の管理、ニーズの分析、個別サービスの提供などのツールを提供することで、顧客関係管理も支援します。
- アジア太平洋地域は、2024年から2030年までのCAGRが15.8%で、同市場で最も急成長している地域になると予想されています。同地域では、リモートワークや柔軟な勤務形態が増加しており、市場の成長に拍車をかけています。
目次
第1章 調査手法と範囲
第2章 エグゼクティブサマリー
第3章 生産性管理ソフトウェアの変数、動向、範囲
- 市場イントロダクション/系統展望
- 業界バリューチェーン分析
- 市場力学
- 市場促進要因分析
- 市場抑制要因分析
- 業界の機会
- 生産性管理ソフトウェア分析ツール
- ポーターの分析
- PESTEL分析
第4章 生産性管理ソフトウェア:ソリューションの推定・動向分析
- セグメントダッシュボード
- 生産性管理ソフトウェア:ソリューション変動分析、2023年および2030年
- コンテンツ管理とコラボレーション
- 市場規模の推定と予測、2018年-2030年
- AIと予測分析
- 市場規模の推定と予測、2018年-2030年
- 構造化された作業管理
- 市場規模の推定と予測、2018年-2030年
- その他のソリューション
- 市場規模の推定と予測、2018年-2030年
第5章 生産性管理ソフトウェア:展開の推定・動向分析
- セグメントダッシュボード
- 生産性管理ソフトウェア:展開変動分析、2023年および2030年
- オンプレミス
- 市場規模の推定と予測、2018年-2030年
- クラウド
- 市場規模の推定と予測、2018年-2030年
第6章 生産性管理ソフトウェア:企業規模の推定・動向分析
- セグメントダッシュボード
- 生産性管理ソフトウェア:企業規模の変動分析、2023年および2030年
- 大規模企業規模
- 市場規模の推定と予測、2018年-2030年
- 中小企業規模
- 市場規模の推定と予測、2018年-2030年
第7章 生産性管理ソフトウェア:業界の推定・動向分析
- セグメントダッシュボード
- 生産性管理ソフトウェアの業界別シェア 2023年と2030年
- BFSI
- 市場規模の推定と予測、2018年-2030年
- ITと通信
- 市場推計・予測、2018年-2030年
- ヘルスケア
- 市場推計・予測、2018年-2030年
- 製造業
- 市場推計・予測、2018年-2030年
- 交通機関
- 市場推計・予測、2018年-2030年
- その他
- 市場推計・予測、2018年-2030年
第8章 生産性管理ソフトウェア市場:地域推定・動向分析
- 生産性管理ソフトウェア市場シェア、地域別、2023年および2030年
- 北米
- 市場推計・予測、2018年-2030年
- ソリューション別、2018年-2030年
- 展開別、2018年-2030年
- 企業規模別、2018年-2030年
- 業界別、2018年-2030年
- 米国
- カナダ
- メキシコ
- 欧州
- ソリューション別、2018年-2030年
- 展開別、2018年-2030年
- 企業規模別、2018年-2030年
- 業界別、2018年-2030年
- 英国
- ドイツ
- フランス
- アジア太平洋
- 市場推計・予測、2018年-2030年
- ソリューション別、2018年-2030年
- 展開別、2018年-2030年
- 企業規模別、2018年-2030年
- 業界別、2018年-2030年
- 中国
- インド
- 日本
- オーストラリア
- 韓国
- ラテンアメリカ
- 市場推計・予測、2018年-2030年
- ソリューション別、2018年-2030年
- 展開別、2018年-2030年
- 企業規模別、2018年-2030年
- 業界別、2018年-2030年
- ブラジル
- メキシコ
- 中東・アフリカ
- 市場推計・予測、2018年-2030年
- ソリューション別、2018年-2030年
- 展開別、2018年-2030年
- 企業規模別、2018年-2030年
- 業界別、2018年-2030年
- アラブ首長国連邦
- サウジアラビア
- 南アフリカ
第9章 競合情勢
- 主要市場参入企業による最近の動向と影響分析
- 企業分類
- 企業の市場シェア分析
- 企業ヒートマップ分析
- 戦略マッピング
- 拡大
- 合併と買収
- パートナーシップとコラボレーション
- 新製品の発売
- 研究開発
- 企業プロファイル
- Adobe
- Asana, Inc.
- Broadcom
- Epicor Software Corporation
- Google(Alphabet Inc.)
- Hyperoffice
- International Business Machines Corporation
- Microsoft
- Monday.Com
- Oracle
- Rockwell Automation
- Sage Group Plc
- Salesforce, Inc.
- Sap Se
- Zoho Corporation Pvt. Ltd.
List of Tables
- Table 1 Productivity Management Software Market Market 2018 - 2030 (USD Billion)
- Table 2 Global Productivity Management Software Market Estimates And Forecasts By Region, 2018 - 2030 (USD Billion)
- Table 3 Global Productivity Management Software Market Estimates And Forecasts By Solution, 2018 - 2030 (USD Billion)
- Table 4 Global Productivity Management Software Market Estimates And Forecasts By Deployments, 2018 - 2030 (USD Billion)
- Table 5 Global Productivity Management Software Market Estimates And Forecasts By Enterprise Size, 2018 - 2030 (USD Billion)
- Table 6 Global Productivity Management Software Market Estimates And Forecasts By Industry, 2018 - 2030 (USD Billion)
- Table 7 Solutions Market By Region, 2018 - 2030 (USD Billion)
- Table 8 Content Management & Collaboration Market By Region, 2018 - 2030 (USD Billion)
- Table 9 Ai & Predictive Analytics Market By Region, 2018 - 2030 (USD Billion)
- Table 10 Structured Work Management Market By Region, 2018 - 2030 (USD Billion)
- Table 11 Other Solutions Market By Region, 2018 - 2030 (USD Billion)
- Table 12 Deployment Market By Region, 2018 - 2030 (USD Billion)
- Table 13 On-Premise Market By Region, 2018 - 2030 (USD Billion)
- Table 14 Cloud Market By Region, 2018 - 2030 (USD Billion)
- Table 15 Enterprise Size Market By Region, 2018 - 2030 (USD Billion)
- Table 16 Large Enterprise Size Market By Region, 2018 - 2030 (USD Billion)
- Table 17 Small & Medium Enterprise Size Market By Region, 2018 - 2030 (USD Billion)
- Table 18 Industry Market By Region, 2018 - 2030 (USD Billion)
- Table 19 Bfsi Market By Region, 2018 - 2030 (USD Billion)
- Table 20 It & Telecom Market By Region, 2018 - 2030 (USD Billion)
- Table 21 Healthcare Market By Region, 2018 - 2030 (USD Billion)
- Table 22 Manufacturing Market By Region, 2018 - 2030 (USD Billion)
- Table 23 Transportation Market By Region, 2018 - 2030 (USD Billion)
- Table 24 Others Market By Region, 2018 - 2030 (USD Billion)
- Table 25 North America Productivity Management Software Market, By Solution, 2018 - 2030 (Revenue, USD Billion)
- Table 26 North America Productivity Management Software Market, By Deployments, 2018 - 2030 (Revenue, USD Billion)
- Table 27 North America Productivity Management Software Market, By Enterprise Size, 2018 - 2030 (Revenue, USD Billion)
- Table 28 North America Productivity Management Software Market, By Industry, 2018 - 2030 (Revenue, USD Billion)
- Table 29 U.S. Productivity Management Software Market, By Solution, 2018 - 2030 (Revenue, USD Billion)
- Table 30 U.S. Productivity Management Software Market, By Deployments, 2018 - 2030 (Revenue, USD Billion)
- Table 31 U.S. Productivity Management Software Market, By Enterprise Size, 2018 - 2030 (Revenue, USD Billion)
- Table 32 U.S. Productivity Management Software Market, By Industry, 2018 - 2030 (Revenue, USD Billion)
- Table 33 Canada Productivity Management Software Market, By Solution, 2018 - 2030 (Revenue, USD Billion)
- Table 34 Canada Productivity Management Software Market, By Deployments, 2018 - 2030 (Revenue, USD Billion)
- Table 35 Canada Productivity Management Software Market, By Enterprise Size, 2018 - 2030 (Revenue, USD Billion)
- Table 36 Canada Productivity Management Software Market, By Industry, 2018 - 2030 (Revenue, USD Billion)
- Table 37 Mexico Productivity Management Software Market, By Solution, 2018 - 2030 (Revenue, USD Billion)
- Table 38 Mexico Productivity Management Software Market, By Deployments, 2018 - 2030 (Revenue, USD Billion)
- Table 39 Mexico Productivity Management Software Market, By Enterprise Size, 2018 - 2030 (Revenue, USD Billion)
- Table 40 Mexico Productivity Management Software Market, By Industry, 2018 - 2030 (Revenue, USD Billion)
- Table 41 Europe Productivity Management Software Market, By Solution, 2018 - 2030 (Revenue, USD Billion)
- Table 42 Europe Productivity Management Software Market, By Deployments, 2018 - 2030 (Revenue, USD Billion)
- Table 43 Europe Productivity Management Software Market, By Enterprise Size, 2018 - 2030 (Revenue, USD Billion)
- Table 44 Europe Productivity Management Software Market, By Industry, 2018 - 2030 (Revenue, USD Billion)
- Table 45 Uk Productivity Management Software Market, By Solution, 2018 - 2030 (Revenue, USD Billion)
- Table 46 Uk Productivity Management Software Market, By Deployments, 2018 - 2030 (Revenue, USD Billion)
- Table 47 Uk Productivity Management Software Market, By Enterprise Size, 2018 - 2030 (Revenue, USD Billion)
- Table 48 Uk Productivity Management Software Market, By Industry, 2018 - 2030 (Revenue, USD Billion)
- Table 49 Germany Productivity Management Software Market, By Solution, 2018 - 2030 (Revenue, USD Billion)
- Table 50 Germany Productivity Management Software Market, By Deployments, 2018 - 2030 (Revenue, USD Billion)
- Table 51 Germany Productivity Management Software Market, By Enterprise Size, 2018 - 2030 (Revenue, USD Billion)
- Table 52 Germany Productivity Management Software Market, By Industry, 2018 - 2030 (Revenue, USD Billion)
- Table 53 France Productivity Management Software Market, By Solution, 2018 - 2030 (Revenue, USD Billion)
- Table 54 France Productivity Management Software Market, By Deployments, 2018 - 2030 (Revenue, USD Billion)
- Table 55 France Productivity Management Software Market, By Enterprise Size, 2018 - 2030 (Revenue, USD Billion)
- Table 56 France Productivity Management Software Market, By Industry, 2018 - 2030 (Revenue, USD Billion)
- Table 57 Asia Pacific Productivity Management Software Market, By Solution, 2018 - 2030 (Revenue, USD Billion)
- Table 58 Asia Pacific Productivity Management Software Market, By Deployments, 2018 - 2030 (Revenue, USD Billion)
- Table 59 Asia Pacific Productivity Management Software Market, By Target Audience, 2018 - 2030 (Revenue, USD Billion)
- Table 60 Asia Pacific Productivity Management Software Market, By Industry, 2018 - 2030 (Revenue, USD Billion)
- Table 61 China Productivity Management Software Market, By Solution, 2018 - 2030 (Revenue, USD Billion)
- Table 62 China Productivity Management Software Market, By Deployments, 2018 - 2030 (Revenue, USD Billion)
- Table 63 China Productivity Management Software Market, By Enterprise Size, 2018 - 2030 (Revenue, USD Billion)
- Table 64 China Productivity Management Software Market, By Industry, 2018 - 2030 (Revenue, USD Billion)
- Table 65 India Management Market, By Solution, 2018 - 2030 (Revenue, USD Billion)
- Table 66 India Productivity Management Software Market, By Deployments, 2018 - 2030 (Revenue, USD Billion)
- Table 67 India Productivity Management Software Market, By Enterprise Size, 2018 - 2030 (Revenue, USD Billion)
- Table 68 India Productivity Management Software Market, By Industry, 2018 - 2030 (Revenue, USD Billion)
- Table 69 Japan Productivity Management Software Market, By Solution, 2018 - 2030 (Revenue, USD Billion)
- Table 70 Japan Productivity Management Software Market, By Deployments, 2018 - 2030 (Revenue, USD Billion)
- Table 71 Japan Productivity Management Software Market, By Enterprise Size, 2018 - 2030 (Revenue, USD Billion)
- Table 72 Japan Productivity Management Software Market, By Industry, 2018 - 2030 (Revenue, USD Billion)
- Table 73 Australia Productivity Management Software Market, By Solution, 2018 - 2030 (Revenue, USD Billion)
- Table 74 Australia Productivity Management Software Market, By Deployments, 2018 - 2030 (Revenue, USD Billion)
- Table 75 Australia Productivity Management Software Market, By Enterprise Size, 2018 - 2030 (Revenue, USD Billion)
- Table 76 Australia Productivity Management Software Market, By Industry, 2018 - 2030 (Revenue, USD Billion)
- Table 77 South Korea Productivity Management Software Market, By Solution, 2018 - 2030 (Revenue, USD Billion)
- Table 78 South Korea Productivity Management Software Market, By Deployments, 2018 - 2030 (Revenue, USD Billion)
- Table 79 South Korea Productivity Management Software Market, By Enterprise Size, 2018 - 2030 (Revenue, USD Billion)
- Table 80 South Korea Productivity Management Software Market, By Industry, 2018 - 2030 (Revenue, USD Billion)
- Table 81 Latin America Productivity Management Software Market, By Solution, 2018 - 2030 (Revenue, USD Billion)
- Table 82 Latin America Productivity Management Software Market, By Deployments, 2018 - 2030 (Revenue, USD Billion)
- Table 83 Latin America Productivity Management Software Market, By Enterprise Size, 2018 - 2030 (Revenue, USD Billion)
- Table 84 Latin America Productivity Management Software Market, By Industry, 2018 - 2030 (Revenue, USD Billion)
- Table 85 Brazil Productivity Management Software Market, By Solution, 2018 - 2030 (Revenue, USD Billion)
- Table 86 Brazil Productivity Management Software Market, By Deployments, 2018 - 2030 (Revenue, USD Billion)
- Table 87 Brazil Productivity Management Software Market, By Enterprise Size, 2018 - 2030 (Revenue, USD Billion)
- Table 88 Brazil Productivity Management Software Market, By Industry, 2018 - 2030 (Revenue, USD Billion)
- Table 89 Mea Productivity Management Software Market, By Solution, 2018 - 2030 (Revenue, USD Billion)
- Table 90 Mea Productivity Management Software Market, By Deployments, 2018 - 2030 (Revenue, USD Billion)
- Table 91 Mea Productivity Management Software Market, By Enterprise Size, 2018 - 2030 (Revenue, USD Billion)
- Table 92 Mea Productivity Management Software Market, By Industry, 2018 - 2030 (Revenue, USD Billion)
- Table 93 Uae Productivity Management Software Market, By Solution, 2018 - 2030 (Revenue, USD Billion)
- Table 94 Uae Productivity Management Software Market, By Deployments, 2018 - 2030 (Revenue, USD Billion)
- Table 95 Uae Productivity Management Software Market, By Enterprise Size, 2018 - 2030 (Revenue, USD Billion)
- Table 96 Uae Productivity Management Software Market, By Industry, 2018 - 2030 (Revenue, USD Billion)
- Table 97 Saudi Arabia Productivity Management Software Market, By Solution, 2018 - 2030 (Revenue, USD Billion)
- Table 98 Saudi Arabia Productivity Management Software Market, By Deployments, 2018 - 2030 (Revenue, USD Billion)
- Table 99 Saudi Arabia Productivity Management Software Market, By Enterprise Size, 2018 - 2030 (Revenue, USD Billion)
- Table 100 Saudi Arabia Productivity Management Software Market, By Industry, 2018 - 2030 (Revenue, USD Billion)
- Table 101 South Africa Productivity Management Software Market, By Solution, 2018 - 2030 (Revenue, USD Billion)
- Table 102 South Africa Productivity Management Software Market, By Deployments, 2018 - 2030 (Revenue, USD Billion)
- Table 103 South Africa Productivity Management Software Market, By Enterprise Size, 2018 - 2030 (Revenue, USD Billion)
- Table 104 South Africa Productivity Management Software Market, By Industry, 2018 - 2030 (Revenue, USD Billion)
List of Figures
- Fig. 1 Productivity Management Software Market Segmentation
- Fig. 2 Market Landscape
- Fig. 3 Information Procurement
- Fig. 4 Data Analysis Models
- Fig. 5 Market Formulation And Validation
- Fig. 6 Data Validating & Publishing
- Fig. 7 Market Snapshot
- Fig. 8 Segment Snapshot (1/3)
- Fig. 9 Segment Snapshot (2/3)
- Fig. 10 Segment Snapshot (3/3)
- Fig. 11 Competitive Landscape Snapshot
- Fig. 12 Productivity Management Software: Industry Value Chain Analysis
- Fig. 13 Productivity Management Software: Market Dynamics
- Fig. 14 Productivity Management Software: Porter's Analysis
- Fig. 15 Productivity Management Software: Pestel Analysis
- Fig. 16 Productivity Management Software Share By Solution, 2023 & 2030 (USD Billion)
- Fig. 17 Productivity Management Software, By Solution: Market Share, 2023 & 2030
- Fig. 18 Content Management & Collaboration Market Estimates And Forecasts, 2018 - 2030 (Revenue, USD Billion)
- Fig. 19 Ai & Predictive Analytics Market Estimates And Forecasts, 2018 - 2030 (Revenue, USD Billion)
- Fig. 20 Structured Work Management Market Estimates And Forecasts, 2018 - 2030 (Revenue, USD Billion)
- Fig. 21 Other Solutions Market Estimates And Forecasts, 2018 - 2030 (Revenue, USD Billion)
- Fig. 22 Productivity Management Software Share By Deployments, 2023 & 2030 (USD Billion)
- Fig. 23 Productivity Management Software Market, By Deployments: Market Share, 2023 & 2030
- Fig. 24 On-Premise Market Estimates And Forecasts, 2018 - 2030 (Revenue, USD Billion)
- Fig. 25 Cloud Market Estimates And Forecasts, 2018 - 2030 (Revenue, USD Billion)
- Fig. 26 Productivity Management Software Share By Enterprise Size, 2023 & 2030 (USD Billion)
- Fig. 27 Productivity Management Software, By Enterprise Size: Market Share, 2023 & 2030
- Fig. 28 Large Enterprise Size Market Estimates And Forecasts, 2018 - 2030 (Revenue, USD Billion)
- Fig. 29 Small & Medium Enterprise Size Market Estimates And Forecasts, 2018 - 2030 (Revenue, USD Billion)
- Fig. 30 Productivity Management Software Share By Industry, 2023 & 2030 (USD Billion)
- Fig. 31 Productivity Management Software, By Industry: Market Share, 2023 & 2030
- Fig. 32 Bfsi Market Estimates And Forecasts, 2018 - 2030 (Revenue, USD Billion)
- Fig. 33 It & Telecom Market Estimates And Forecasts, 2018 - 2030 (Revenue, USD Billion)
- Fig. 34 Healthcare Market Estimates And Forecasts, 2018 - 2030 (Revenue, USD Billion)
- Fig. 35 Manufacturing Market Estimates And Forecasts, 2018 - 2030 (Revenue, USD Billion)
- Fig. 36 Transportation Market Estimates And Forecasts, 2018 - 2030 (Revenue, USD Billion)
- Fig. 37 Others Market Estimates And Forecasts, 2018 - 2030 (Revenue, USD Billion)
- Fig. 38 Regional Market Place: Key Takeaways
- Fig. 39 North America Productivity Management Software Market Estimates And Forecasts, 2018 - 2030 (USD Billion)
- Fig. 40 U.S. Productivity Management Software Market Estimates And Forecasts, 2018 - 2030 (USD Billion)
- Fig. 41 Canada Productivity Management Software Market Estimates And Forecasts, 2018 - 2030 (USD Billion)
- Fig. 42 Mexico Productivity Management Software Market Estimates And Forecasts, 2018 - 2030 (USD Billion)
- Fig. 43 Europe Productivity Management Software Market Estimates And Forecasts, 2018 - 2030 (USD Billion)
- Fig. 44 U.K. Productivity Management Software Market Estimates And Forecasts, 2018 - 2030) (USD Billion)
- Fig. 45 Germany Productivity Management Software Market Estimates And Forecasts, (2018 - 2030) (USD Billion)
- Fig. 46 France Productivity Management Software Market Estimates And Forecasts, (2018 - 2030) (USD Billion)
- Fig. 47 Asia Pacific Productivity Management Software Market Estimates And Forecast, 2018 - 2030 (USD Billion)
- Fig. 48 China Productivity Management Software Market Estimates And Forecasts, 2018 - 2030 (USD Billion)
- Fig. 49 India Productivity Management Software Market Estimates And Forecasts, 2018 - 2030 (USD Billion)
- Fig. 50 Japan Productivity Management Software Market Estimates And Forecasts, 2018 - 2030 (USD Billion)
- Fig. 51 Australia Productivity Management Softwaremarket Estimates And Forecasts, 2018 - 2030 (USD Billion)
- Fig. 52 South Korea Productivity Management Software Market Estimates And Forecasts, 2018 - 2030 (USD Billion)
- Fig. 53 Latin America Productivity Management Software Market Estimates And Forecasts, 2018 - 2030 (USD Billion)
- Fig. 54 Brazil Productivity Management Software Market Estimates And Forecasts, 2018 - 2030 (USD Billion)
- Fig. 55 Mea Productivity Management Software Market Estimates And Forecasts, 2018 - 2030 (USD Billion)
- Fig. 56 Saudi Arabia Productivity Management Software Market Estimates And Forecasts, 2018 - 2030 (USD Billion)
- Fig. 57 Uae Productivity Management Software Market Estimates And Forecasts, 2018 - 2030 (USD Billion)
- Fig. 58 South Africa Productivity Management Software Market Estimates And Forecasts, 2018 - 2030 (USD Billion)
- Fig. 59 Key Company Categorization
- Fig. 60 Company Market Positioning
- Fig. 61 Key Company Market Share Analysis, 2023
- Fig. 62 Strategic Framework
Productivity Management Software Market Growth & Trends:
The global productivity management software market size is estimated to reach USD 149.74 billion by 2030, growing at a CAGR of 14.1% from 2024 to 2030, according to the recent reports of Grand View Research, Inc. The productivity management software enables organizations to enhance efficiency, streamline workflows, and optimize performance across various processes. The software facilitates managing individuals' or organizations' productivity by organizing and tracking projects, tasks, and objectives. It offers a range of functionalities such as goal establishment, task administration, calendar integration, and team collaboration, enabling enterprises to maintain productivity while facilitating outcomes assessment.
Companies are increasingly focused on reducing operational costs to maximize profits, and improved productivity is crucial in achieving this goal. Recognizing this, organizations are turning towards technology-driven solutions like productivity management software. This software offers centralized platforms for managing productivity, fostering a more efficient work environment, and reducing costs.
In addition, wearables and IoT devices can gather valuable data related to employee activity, work environment, and well-being. Productivity management software can integrate this data to provide real-time individual and team performance insights. For instance, smartwatches can track work hours and suggest breaks to prevent burnout, while sensors in a workspace can monitor air quality and temperature, prompting adjustments for optimal working conditions. Productivity software can personalize user experiences and suggest optimized workflows by leveraging data from wearables and IoT devices and driving efficiency across the organization.
Productivity Management Software Market Report Highlights:
- Based on the solution, the content management & collaboration segment dominated the market with a revenue share of 35.3% in 2023. Collaboration tools also allow for real-time communication and collaboration among team members, regardless of their location. This helps enhance teamwork and reduces the time spent on back-and-forth emails and phone calls.
- Based on deployment, the cloud segment is expected to register a CAGR of 17.0% from 2024 to 2030 in the market. The benefit such as accessibility from anywhere of cloud-based productivity management software drives the growth of the segment.
- Based on the enterprise, the small and medium enterprises segment held the largest revenue share of 56.5% in 2023. With the capabilities offered by productivity management software, small and medium enterprises can enhance teamwork, reduce the time spent on back-and-forth emails and phone calls, and increase overall productivity.
- Based on industry, the BFSI segment is expected to grow at a significant CAGR from 2024 to 2030 in the market. Productivity management software plays a significant role in the BFSI industry by streamlining operations, enhancing efficiency, and ensuring regulatory compliance. It also assists customer relationship management by providing tools for managing client information, analyzing their needs, and offering personalized services.
- Asia Pacific is anticipated to emerge as the fastest-growing region in the market with a CAGR of 15.8% from 2024 to 2030. The rise in remote and flexible work arrangements in the region is fueling the market's growth.
Table of Contents
Chapter 1. Methodology And Scope
- 1.1. Market Segmentation And Scope
- 1.2. Market Definitions
- 1.3. Research Methodology
- 1.3.1. Information Procurement
- 1.3.2. Information Or Data Analysis
- 1.3.3. Market Formulation & Data Visualization
- 1.3.4. Data Validation & Publishing
- 1.4. Research Scope And Assumptions
- 1.4.1. List Of Data Sources
Chapter 2. Executive Summary
- 2.1. Market Outlook
- 2.2. Segment Outlook
- 2.3. Competitive Insights
Chapter 3. Productivity Management Software Variables, Trends, & Scope
- 3.1. Market Introduction/Lineage Outlook
- 3.2. Industry Value Chain Analysis
- 3.3. Market Dynamics
- 3.3.1. Market Drivers Analysis
- 3.3.2. Market Restraints Analysis
- 3.3.3. Industry Opportunities
- 3.4. Productivity Management Software Analysis Tools
- 3.4.1. Porter's Analysis
- 3.4.1.1. Bargaining Power Of The Suppliers
- 3.4.1.2. Bargaining Power Of The Buyers
- 3.4.1.3. Threats Of Substitution
- 3.4.1.4. Threats From New Entrants
- 3.4.1.5. Competitive Rivalry
- 3.4.2. Pestel Analysis
- 3.4.2.1. Political Landscape
- 3.4.2.2. Economic And Social Landscape
- 3.4.2.3. Technological Landscape
- 3.4.2.4. Environmental Landscape
- 3.4.2.5. Legal Landscape
- 3.4.1. Porter's Analysis
Chapter 4. Productivity Management Software: Solution Estimates & Trend Analysis
- 4.1. Segment Dashboard
- 4.2. Productivity Management Software: Solution Movement Analysis, USD Billion, 2023 & 2030
- 4.3. Content Management & Collaboration
- 4.3.1. Market Size Estimates And Forecasts, 2018 - 2030 (USD Billion)
- 4.4. Ai & Predictive Analytics
- 4.4.1. Market Size Estimates And Forecasts, 2018 - 2030 (USD Billion)
- 4.5. Structured Work Management
- 4.5.1. Market Size Estimates And Forecasts, 2018 - 2030 (USD Billion)
- 4.6. Other Solutions
- 4.6.1. Market Size Estimates And Forecasts, 2018 - 2030 (USD Billion)
Chapter 5. Productivity Management Software: Deployment Estimates & Trend Analysis
- 5.1. Segment Dashboard
- 5.2. Productivity Management Software: Deployment Movement Analysis, USD Billion, 2023 & 2030
- 5.3. On-Premise
- 5.3.1. Market Size Estimates And Forecasts, 2018 - 2030 (USD Billion)
- 5.4. Cloud
- 5.4.1. Market Size Estimates And Forecasts, 2018 - 2030 (USD Billion)
Chapter 6. Productivity Management Software: Enterprise Size Estimates & Trend Analysis
- 6.1. Segment Dashboard
- 6.2. Productivity Management Software: Enterprise Size Movement Analysis, USD Billion, 2023 & 2030
- 6.3. Large Enterprise Size
- 6.3.1. Market Size Estimates And Forecasts, 2018 - 2030 (USD Billion)
- 6.4. Small & Medium Enterprise Size
- 6.4.1. Market Size Estimates And Forecasts, 2018 - 2030 (USD Billion)
Chapter 7. Productivity Management Software: Industry Estimates & Trend Analysis
- 7.1. Segment Dashboard
- 7.2. Productivity Management Software Share By Industry 2023 & 2030 (USD Billion)
- 7.3. Bfsi
- 7.3.1. Market Size Estimates And Forecasts, 2018 - 2030 (USD Billion)
- 7.4. It & Telecom
- 7.4.1. Market Estimates And Forecast, 2018 - 2030 (USD Billion)
- 7.5. Healthcare
- 7.5.1. Market Estimates And Forecast, 2018 - 2030 (USD Billion)
- 7.6. Manufacturing
- 7.6.1. Market Estimates And Forecast, 2018 - 2030 (USD Billion)
- 7.7. Transportation
- 7.7.1. Market Estimates And Forecast, 2018 - 2030 (USD Billion)
- 7.8. Others
- 7.8.1. Market Estimates And Forecast, 2018 - 2030 (USD Billion)
Chapter 8. Productivity Management Software Market: Regional Estimates & Trend Analysis
- 8.1. Productivity Management Software Market Share, By Region, 2023 & 2030, USD Billion
- 8.2. North America
- 8.2.1. Market Estimates And Forecasts, 2018 - 2030 (USD Billion)
- 8.2.2. Market Estimates And Forecast By Solution, 2018 - 2030 (Revenue, USD Billion)
- 8.2.3. Market Estimates And Forecast By Deployment, 2018 - 2030 (Revenue, USD Billion)
- 8.2.4. Market Estimates And Forecast By Enterprise Size, 2018 - 2030 (Revenue, USD Billion)
- 8.2.5. Market Estimates And Forecast By Industry, 2018 - 2030 (Revenue, USD Billion)
- 8.2.6. U.S.
- 8.2.6.1. Market Estimates And Forecasts, 2018 - 2030 (USD Billion)
- 8.2.6.2. Market Estimates And Forecast By Solution, 2018 - 2030 (Revenue, USD Billion)
- 8.2.6.3. Market Estimates And Forecast By Deployment, 2018 - 2030 (Revenue, USD Billion)
- 8.2.6.4. Market Estimates And Forecast By Enterprise Size, 2018 - 2030 (Revenue, USD Billion)
- 8.2.6.5. Market Estimates And Forecast By Industry, 2018 - 2030 (Revenue, USD Billion)
- 8.2.7. Canada
- 8.2.7.1. Market Estimates And Forecasts, 2018 - 2030 (USD Billion)
- 8.2.7.2. Market Estimates And Forecast By Solution, 2018 - 2030 (Revenue, USD Billion)
- 8.2.7.3. Market Estimates And Forecast By Deployment, 2018 - 2030 (Revenue, USD Billion)
- 8.2.7.4. Market Estimates And Forecast By Enterprise Size, 2018 - 2030 (Revenue, USD Billion)
- 8.2.7.5. Market Estimates And Forecast By Industry, 2018 - 2030 (Revenue, USD Billion)
- 8.2.8. Mexico
- 8.2.8.1. Market Estimates And Forecasts, 2018 - 2030 (USD Billion)
- 8.2.8.2. Market Estimates And Forecast By Solution, 2018 - 2030 (Revenue, USD Billion)
- 8.2.8.3. Market Estimates And Forecast By Deployment, 2018 - 2030 (Revenue, USD Billion)
- 8.2.8.4. Market Estimates And Forecast By Enterprise Size, 2018 - 2030 (Revenue, USD Billion)
- 8.2.8.5. Market Estimates And Forecast By Industry, 2018 - 2030 (Revenue, USD Billion)
- 8.3. Europe
- 8.3.1. Market Estimates And Forecast By Solution, 2018 - 2030 (Revenue, USD Billion)
- 8.3.2. Market Estimates And Forecast By Deployment, 2018 - 2030 (Revenue, USD Billion)
- 8.3.3. Market Estimates And Forecast By Enterprise Size, 2018 - 2030 (Revenue, USD Billion)
- 8.3.4. Market Estimates And Forecast By Industry, 2018 - 2030 (Revenue, USD Billion)
- 8.3.5. Uk
- 8.3.5.1. Market Estimates And Forecasts, 2018 - 2030 (USD Billion)
- 8.3.5.2. Market Estimates And Forecast By Solution, 2018 - 2030 (Revenue, USD Billion)
- 8.3.5.3. Market Estimates And Forecast By Deployment, 2018 - 2030 (Revenue, USD Billion)
- 8.3.5.4. Market Estimates And Forecast By Enterprise Size, 2018 - 2030 (Revenue, USD Billion)
- 8.3.5.5. Market Estimates And Forecast By Industry, 2018 - 2030 (Revenue, USD Billion)
- 8.3.6. Germany
- 8.3.6.1. Market Estimates And Forecasts, 2018 - 2030 (USD Billion)
- 8.3.6.2. Market Estimates And Forecast By Solution, 2018 - 2030 (Revenue, USD Billion)
- 8.3.6.3. Market Estimates And Forecast By Deployment, 2018 - 2030 (Revenue, USD Billion)
- 8.3.6.4. Market Estimates And Forecast By Enterprise Size, 2018 - 2030 (Revenue, USD Billion)
- 8.3.6.5. Market Estimates And Forecast By Industry, 2018 - 2030 (Revenue, USD Billion)
- 8.3.7. France
- 8.3.7.1. Market Estimates And Forecasts, 2018 - 2030 (USD Billion)
- 8.3.7.2. Market Estimates And Forecast By Solution, 2018 - 2030 (Revenue, USD Billion)
- 8.3.7.3. Market Estimates And Forecast By Deployment, 2018 - 2030 (Revenue, USD Billion)
- 8.3.7.4. Market Estimates And Forecast By Enterprise Size, 2018 - 2030 (Revenue, USD Billion)
- 8.3.7.5. Market Estimates And Forecast By Industry, 2018 - 2030 (Revenue, USD Billion)
- 8.4. Asia Pacific
- 8.4.1. Market Estimates And Forecasts, 2018 - 2030 (USD Billion)
- 8.4.2. Market Estimates And Forecast By Solution, 2018 - 2030 (Revenue, USD Billion)
- 8.4.3. Market Estimates And Forecast By Deployment, 2018 - 2030 (Revenue, USD Billion)
- 8.4.4. Market Estimates And Forecast By Enterprise Size, 2018 - 2030 (Revenue, USD Billion)
- 8.4.5. Market Estimates And Forecast By Industry, 2018 - 2030 (Revenue, USD Billion)
- 8.4.6. China
- 8.4.6.1. Market Estimates And Forecasts, 2018 - 2030 (USD Billion)
- 8.4.6.2. Market Estimates And Forecast By Solution, 2018 - 2030 (Revenue, USD Billion)
- 8.4.6.3. Market Estimates And Forecast By Deployment, 2018 - 2030 (Revenue, USD Billion)
- 8.4.6.4. Market Estimates And Forecast By Enterprise Size, 2018 - 2030 (Revenue, USD Billion)
- 8.4.6.5. Market Estimates And Forecast By Industry, 2018 - 2030 (Revenue, USD Billion)
- 8.4.7. India
- 8.4.7.1. Market Estimates And Forecasts, 2018 - 2030 (USD Billion)
- 8.4.7.2. Market Estimates And Forecast By Solution, 2018 - 2030 (Revenue, USD Billion)
- 8.4.7.3. Market Estimates And Forecast By Deployment, 2018 - 2030 (Revenue, USD Billion)
- 8.4.7.4. Market Estimates And Forecast By Enterprise Size, 2018 - 2030 (Revenue, USD Billion)
- 8.4.7.5. Market Estimates And Forecast By Industry, 2018 - 2030 (Revenue, USD Billion)
- 8.4.8. Japan
- 8.4.8.1. Market Estimates And Forecasts, 2018 - 2030 (USD Billion)
- 8.4.8.2. Market Estimates And Forecast By Solution, 2018 - 2030 (Revenue, USD Billion)
- 8.4.8.3. Market Estimates And Forecast By Deployment, 2018 - 2030 (Revenue, USD Billion)
- 8.4.8.4. Market Estimates And Forecast By Enterprise Size, 2018 - 2030 (Revenue, USD Billion)
- 8.4.8.5. Market Estimates And Forecast By Industry, 2018 - 2030 (Revenue, USD Billion)
- 8.4.9. Australia
- 8.4.9.1. Market Estimates And Forecasts, 2018 - 2030 (USD Billion)
- 8.4.9.2. Market Estimates And Forecast By Solution, 2018 - 2030 (Revenue, USD Billion)
- 8.4.9.3. Market Estimates And Forecast By Deployment, 2018 - 2030 (Revenue, USD Billion)
- 8.4.9.4. Market Estimates And Forecast By Enterprise Size, 2018 - 2030 (Revenue, USD Billion)
- 8.4.9.5. Market Estimates And Forecast By Industry, 2018 - 2030 (Revenue, USD Billion)
- 8.4.10. South Korea
- 8.4.10.1. Market Estimates And Forecasts, 2018 - 2030 (USD Billion)
- 8.4.10.2. Market Estimates And Forecast By Solution, 2018 - 2030 (Revenue, USD Billion)
- 8.4.10.3. Market Estimates And Forecast By Deployment, 2018 - 2030 (Revenue, USD Billion)
- 8.4.10.4. Market Estimates And Forecast By Enterprise Size, 2018 - 2030 (Revenue, USD Billion)
- 8.4.10.5. Market Estimates And Forecast By Industry, 2018 - 2030 (Revenue, USD Billion)
- 8.5. Latin America
- 8.5.1. Market Estimates And Forecasts, 2018 - 2030 (USD Billion)
- 8.5.2. Market Estimates And Forecast By Solution, 2018 - 2030 (Revenue, USD Billion)
- 8.5.3. Market Estimates And Forecast By Deployment, 2018 - 2030 (Revenue, USD Billion)
- 8.5.4. Market Estimates And Forecast By Enterprise Size, 2018 - 2030 (Revenue, USD Billion)
- 8.5.5. Market Estimates And Forecast By Industry, 2018 - 2030 (Revenue, USD Billion)
- 8.5.6. Brazil
- 8.5.6.1. Market Estimates And Forecasts, 2018 - 2030 (USD Billion)
- 8.5.6.2. Market Estimates And Forecast By Solution, 2018 - 2030 (Revenue, USD Billion)
- 8.5.6.3. Market Estimates And Forecast By Deployment, 2018 - 2030 (Revenue, USD Billion)
- 8.5.6.4. Market Estimates And Forecast By Enterprise Size, 2018 - 2030 (Revenue, USD Billion)
- 8.5.6.5. Market Estimates And Forecast By Industry, 2018 - 2030 (Revenue, USD Billion)
- 8.5.7. Mexico
- 8.5.7.1. Market Estimates And Forecasts, 2018 - 2030 (USD Billion)
- 8.5.7.2. Market Estimates And Forecast By Solution, 2018 - 2030 (Revenue, USD Billion)
- 8.5.7.3. Market Estimates And Forecast By Deployment, 2018 - 2030 (Revenue, USD Billion)
- 8.5.7.4. Market Estimates And Forecast By Enterprise Size, 2018 - 2030 (Revenue, USD Billion)
- 8.5.7.5. Market Estimates And Forecast By Industry, 2018 - 2030 (Revenue, USD Billion)
- 8.6. Middle East & Africa
- 8.6.1. Market Estimates And Forecasts, 2018 - 2030 (USD Billion)
- 8.6.2. Market Estimates And Forecast By Solution, 2018 - 2030 (Revenue, USD Billion)
- 8.6.3. Market Estimates And Forecast By Deployment, 2018 - 2030 (Revenue, USD Billion)
- 8.6.4. Market Estimates And Forecast By Enterprise Size, 2018 - 2030 (Revenue, USD Billion)
- 8.6.5. Market Estimates And Forecast By Industry, 2018 - 2030 (Revenue, USD Billion)
- 8.6.7. Uae
- 8.6.2.1. Market Estimates And Forecasts, 2018 - 2030 (USD Billion)
- 8.6.2.2. Market Estimates And Forecast By Solution, 2018 - 2030 (Revenue, USD Billion)
- 8.6.2.3. Market Estimates And Forecast By Deployment, 2018 - 2030 (Revenue, USD Billion)
- 8.6.2.4. Market Estimates And Forecast By Enterprise Size, 2018 - 2030 (Revenue, USD Billion)
- 8.6.2.5. Market Estimates And Forecast By Industry, 2018 - 2030 (Revenue, USD Billion)
- 8.6.8. Saudi Arabia
- 8.6.3.1. Market Estimates And Forecasts, 2018 - 2030 (USD Billion)
- 8.6.3.2. Market Estimates And Forecast By Solution, 2018 - 2030 (Revenue, USD Billion)
- 8.6.3.3. Market Estimates And Forecast By Deployment, 2018 - 2030 (Revenue, USD Billion)
- 8.6.3.4. Market Estimates And Forecast By Enterprise Size, 2018 - 2030 (Revenue, USD Billion)
- 8.6.3.5. Market Estimates And Forecast By Industry, 2018 - 2030 (Revenue, USD Billion)
- 8.6.9. South Africa
- 8.6.4.1. Market Estimates And Forecasts, 2018 - 2030 (USD Billion)
- 8.6.4.2. Market Estimates And Forecast By Solution, 2018 - 2030 (Revenue, USD Billion)
- 8.6.4.3. Market Estimates And Forecast By Deployment, 2018 - 2030 (Revenue, USD Billion)
- 8.6.4.4. Market Estimates And Forecast By Enterprise Size, 2018 - 2030 (Revenue, USD Billion)
- 8.6.4.5. Market Estimates And Forecast By Industry, 2018 - 2030 (Revenue, USD Billion)
Chapter 9. Competitive Landscape
- 9.1. Recent Developments & Impact Analysis By Key Market Participants
- 9.2. Company Categorization
- 9.3. Company Market Share Analysis
- 9.4. Company Heat Map Analysis
- 9.5. Strategy Mapping
- 9.5.1. Expansion
- 9.5.2. Mergers & Acquisition
- 9.5.3. Partnerships & Collaborations
- 9.5.4. New Product Launches
- 9.5.5. Research And Development
- 9.6. Company Profiles
- 9.6.1. Adobe
- 9.6.1.1. Participant's Overview
- 9.6.1.2. Financial Performance
- 9.6.1.3. Product Benchmarking
- 9.6.1.4. Recent Developments
- 9.6.2. Asana, Inc.
- 9.6.2.1. Participant's Overview
- 9.6.2.2. Financial Performance
- 9.6.2.3. Product Benchmarking
- 9.6.2.4. Recent Developments
- 9.6.3. Broadcom
- 9.6.3.1. Participant's Overview
- 9.6.3.2. Financial Performance
- 9.6.3.3. Product Benchmarking
- 9.6.3.4. Recent Developments
- 9.6.4. Epicor Software Corporation
- 9.6.4.1. Participant's Overview
- 9.6.4.2. Financial Performance
- 9.6.4.3. Product Benchmarking
- 9.6.4.4. Recent Developments
- 9.6.5. Google (Alphabet Inc.)
- 9.6.5.1. Participant's Overview
- 9.6.5.2. Financial Performance
- 9.6.5.3. Product Benchmarking
- 9.6.5.4. Recent Developments
- 9.6.6. Hyperoffice
- 9.6.6.1. Participant's Overview
- 9.6.6.2. Financial Performance
- 9.6.6.3. Product Benchmarking
- 9.6.6.4. Recent Developments
- 9.6.7. International Business Machines Corporation
- 9.6.7.1. Participant's Overview
- 9.6.7.2. Financial Performance
- 9.6.7.3. Product Benchmarking
- 9.6.7.4. Recent Developments
- 9.6.8. Microsoft
- 9.6.8.1. Participant's Overview
- 9.6.8.2. Financial Performance
- 9.6.8.3. Product Benchmarking
- 9.6.8.4. Recent Developments
- 9.6.9. Monday.Com
- 9.6.9.1. Participant's Overview
- 9.6.9.2. Financial Performance
- 9.6.9.3. Product Benchmarking
- 9.6.9.4. Recent Developments
- 9.6.10. Oracle
- 9.6.10.1. Participant's Overview
- 9.6.10.2. Financial Performance
- 9.6.10.3. Product Benchmarking
- 9.6.10.4. Recent Developments
- 9.6.11. Rockwell Automation
- 9.6.11.1. Participant's Overview
- 9.6.11.2. Financial Performance
- 9.6.11.3. Product Benchmarking
- 9.6.11.4. Recent Developments
- 9.6.12. Sage Group Plc
- 9.6.12.1. Participant's Overview
- 9.6.12.2. Financial Performance
- 9.6.12.3. Product Benchmarking
- 9.6.12.4. Recent Developments
- 9.6.13. Salesforce, Inc.
- 9.6.13.1. Participant's Overview
- 9.6.13.2. Financial Performance
- 9.6.13.3. Product Benchmarking
- 9.6.13.4. Recent Developments
- 9.6.14. Sap Se
- 9.6.14.1. Participant's Overview
- 9.6.14.2. Financial Performance
- 9.6.14.3. Product Benchmarking
- 9.6.14.4. Recent Developments
- 9.6.15. Zoho Corporation Pvt. Ltd.
- 9.6.15.1. Participant's Overview
- 9.6.15.2. Financial Performance
- 9.6.15.3. Product Benchmarking
- 9.6.15.4. Recent Developments
- 9.6.1. Adobe

