|
|
市場調査レポート
商品コード
1268603
粉末冶金市場規模、シェア、動向分析レポート、材料別(チタン、スチール)、プロセス別(MIM、PM HIP)、用途別(自動車、石油・ガス)、最終用途別(OEM、AMオペレーター)、地域別、およびセグメント別予測、2023~2030年Powder Metallurgy Market Size, Share & Trends Analysis Report By Material (Titanium, Steel), By Process (MIM, PM HIP), By Application (Automotive, Oil & Gas), By End-use (OEM, AM Operators), By Region, And Segment Forecasts, 2023 - 2030 |
||||||
|
|
|||||||
|
● お客様のご希望に応じて、既存データの加工や未掲載情報(例:国別セグメント)の追加などの対応が可能です。 詳細はお問い合わせください。 |
|||||||


| 粉末冶金市場規模、シェア、動向分析レポート、材料別(チタン、スチール)、プロセス別(MIM、PM HIP)、用途別(自動車、石油・ガス)、最終用途別(OEM、AMオペレーター)、地域別、およびセグメント別予測、2023~2030年 |
|
出版日: 2023年04月04日
発行: Grand View Research
ページ情報: 英文 100 Pages
納期: 2~10営業日
|
- 全表示
- 概要
- 図表
- 目次
粉末冶金市場の成長と動向:
Grand View Research, Inc.の新しいレポートによると、世界の粉末冶金市場規模は2030年までに63億6,000万米ドルに達すると推定され、予測期間中にCAGR 12.9%で成長します。
自動車産業からの軽量自動車部品の需要の増加とともに、付加製造の利用による航空宇宙部品の軽量化への取り組みが増加し、市場成長を牽引しています。
航空機メーカーは航空機部品のコストと重量の節約に注力しており、高性能で費用対効果の高い航空機要素を提供するための3Dプリンティング材料の需要を高めています。長期的には、機能、サイズ、材料の互換性の観点から3Dプリンターの数が増加し、さまざまなパートナーシップやジョイントベンチャーを通じて拡大する強力な競合戦略と相まって、市場の成長をさらに促進すると予想されています。
ヘルスケア業界では、医療機器の使用頻度の増加とともに、個人向けの人工装具に対する需要が高まっており、主に金属積層造形市場領域での売上を促進しています。産業分野では、ラピッドプロトタイピングとオンサイト生産が、予測期間中、市場ベンダーに有望な成長機会を提供すると推定されます。
COVID-19のパンデミックは、製造業と冶金産業の停止につながり、2020年のアップサイドとダウンサイドの両方に影響を与えました。自動車、航空宇宙、消費財などの粉末冶金産業の主要な最終使用部門は、2020年度にマイナス傾向を観測しています。例えば、2021年4月、トヨタ自動車は2021年3月期の世界販売台数が5.1%減少しました。これにより、自動車をはじめとする産業界の生産活動が停滞し、鉄や鋼、アルミニウムなどの粉末金属の需要が著しく低下しています。
粉末冶金市場レポートハイライト:
- 鉄鋼材料セグメントは、予測期間中、売上高ベースで12.0%のCAGRを記録すると推定されます。鋼材の低コストと入手のしやすさが、このセグメントの成長を促進すると予想されます。
- 金属射出成形(MIM)プロセスセグメントは、2020年に世界市場をリードし、部品製造産業におけるプロセスの重要性により、今後数年間は安定した成長を示すと予測されます。
- 航空宇宙&防衛用途セグメントは、2022年に51.0%以上の最大の収益シェアを占めています。航空宇宙・防衛産業は、高い投資予算で新技術を適応させることに非常に注力しており、これがこのセグメントの主要な促進要因となっています。
- 一般的に航空機産業の大規模なOEMは、航空部品の製造のために金属3Dプリンティングに多額の投資を行っており、予測期間中、OEMの最終用途セグメントを最も速いCAGRで牽引すると予想されます。
- 北米は2022年に34.0%以上の最高シェアを占めています。欧州の主要国における技術分野の研究開発と標準化のための資金提供の増加が、市場成長を促進すると予想されます。
目次
第1章 調査手法と範囲
- 市場セグメンテーションと範囲
- 市場の定義
- 情報調達
- 情報分析
- データ分析モデル
- 市場の形成とデータの視覚化
- データの検証と公開
- 調査範囲と前提条件
- データソースのリスト
第2章 エグゼクティブサマリー
- 市場の見通し
- セグメント別の見通し
- 競争力の見通し
第3章 市場変数、動向、および範囲
- 市場の見通し
- バリューチェーン分析
- 原材料の動向
- ものづくりと技術の動向
- 一部の主要企業が金属粉末製造に使用している技術
- 粉末冶金プロセス
- 金属射出成形(MIM)
- 金属積層造形
- 粉末金属熱間静水圧プレス(PM HIP)
- 市場力学
- 市場促進要因の分析
- 市場抑制要因分析
- 市場の課題
- 市場機会分析
- 規制の枠組み
- 粉末冶金産業分析- ポーターの5つの力
- サプライヤーの交渉力
- 買い手の交渉力
- 競争企業間の敵対関係
- 代替品の脅威
- 新規参入業者の脅威
- 粉末冶金産業分析-PESTEL分析
- 政治的
- 経済
- 社交
- 技術的
- 環境
- 法的
第4章 粉末冶金市場:材料の見積もりと予測の傾向分析
- 定義と範囲
- 物質変動分析と市場シェア、2022年と2030年
- チタン
- チタン別、2018-2030
- ニッケル
- ニッケル別、2018-2030
- 鋼
- 鉄鋼別、2018~2030年
- アルミニウム
- アルミニウム別、2018-2030
- コバルト
- コバルト別、2018-2030
- その他
- その他の資料別と、2018~2030年
第5章 粉末冶金市場:プロセスの推定・予測トレンド分析
- 定義と範囲
- プロセスの変動分析と市場シェア、2022年と2030年
- 積層造形
- 積層造形別、2018~2030年
- 積層造形の種類別、2018~2030年
- 熱間静水圧プレス
- 熱間静水圧プレス別、2018-2030
- 金属射出成形
- 金属射出成形別、2018-2030
第6章 粉末冶金市場:用途の推定・予測トレンド分析
- 定義と範囲
- 用途の変動分析と市場シェア、2022年と2030年
- 航空宇宙と防衛
- 航空宇宙および防衛別、2018~2030年
- 自動車
- 自動車別、2018~2030年
- 石油ガス
- 石油とガス別、2018~2030年
- 医療および歯科
- 医療および歯科別、2018~2030年
- 産業用
- 産業別、2018~2030年
第7章 粉末冶金市場:最終用途の推定・予測傾向分析
- 定義と範囲
- 最終用途の変動分析と市場シェア、2022年と2030年
- OEM
- OEM別、2018~2030年
- AMオペレーター
- AMオペレーター別、2018~2030年
第8章 粉末冶金市場の地域推定・予測傾向分析
- 地域変動分析と市場シェア、2022年と2030年
- 北米
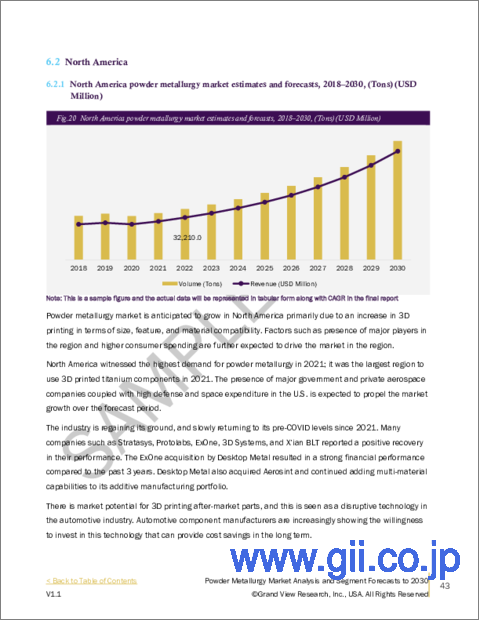
- 北米粉末冶金市場推計・予測、2018-2030(100万米ドル)(トン)
- 素材別、2018年~2030年
- プロセス別、2018~2030年
- 用途別、2018年~2030年
- 米国
- 欧州
- 欧州の粉末冶金市場推計・予測、2018-2030(100万米ドル)(トン)
- 素材別、2018~2030年
- プロセス別、2018~2030年
- 用途別、2018年~2030年
- ドイツ
- フランス
- 英国
- アジア太平洋地域
- アジア太平洋の粉末冶金市場推計・予測、2018年から2030年(100万米ドル)(トン)
- 素材別、2018~2030年
- プロセス別、2018~2030年
- 用途別、2018年~2030年
- 中国
- 日本
- 中南米
- 中南米の粉末冶金市場推計・予測、2018-2030(100万米ドル)(トン)
- 素材別、2018年~2030年
- プロセス別、2018~2030年
- 用途別、2018年~2030年
- ブラジル
- 中東とアフリカ
- 中東およびアフリカの粉末冶金市場推計・予測、2018-2030(100万米ドル)(トン)
- 素材別、2018~2030年
- プロセス別、2018~2030年
- 用途別、2018年~2030年
第9章 競合情勢
- 主要市場参入企業別最近の動向と影響分析
- 企業ランキング
- ヒートマップ分析
- 市場戦略
- ベンダー情勢
- List of raw material supplier, key manufacturers, and distributors
- List of prospective end-users
- 戦略マッピング
- 企業プロファイル・一覧表
- Molyworks Material Corporation
- 会社概要
- 製品のベンチマーク
- POLEMA
- 会社概要
- 製品のベンチマーク
- Sandvik AB
- 会社概要
- 財務実績
- 製品のベンチマーク
- Hoganas AB
- 会社概要
- 製品のベンチマーク
- GKN PLC
- 会社概要
- 製品のベンチマーク
- Rio Tinto Metal Powder
- 会社概要
- 製品のベンチマーク
- RusAL
- 会社概要
- 製品のベンチマーク
- CRS Holdings, LLC
- 会社概要
- 製品のベンチマーク
- Advanced-Technology &Materials Co, Ltd.(AT&M)
- 会社概要
- 製品のベンチマーク
- Liberty Steel Group
- 会社概要
- 財務実績
- 製品のベンチマーク
- Newby Foundries Ltd
- 会社概要
- 財務実績
- 製品のベンチマーク
- Molyworks Material Corporation
List of Tables
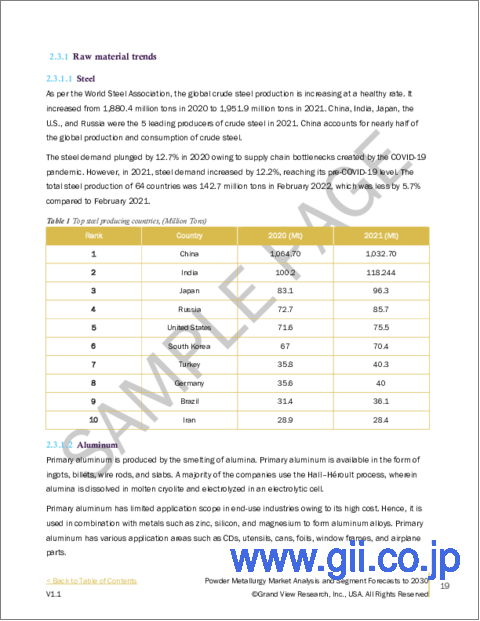
- TABLE 1 Top 10 steel producing countries, (Million tons)
- TABLE 2 Powder metallurgy market estimates and forecasts by titanium, 2018 - 2030 (Tons) (USD Million)
- TABLE 3 Powder metallurgy market estimates and forecasts by steel, 2018 - 2030 (Tons) (USD Million)
- TABLE 4 Powder metallurgy market estimates and forecasts by nickel, 2018 - 2030 (Tons) (USD Million)
- TABLE 5 Powder metallurgy market estimates and forecasts by aluminum, 2018 - 2030 (Tons) (USD Million)
- TABLE 6 Powder metallurgy market estimates and forecasts by cobalt, 2018 - 2030 (Tons) (USD Million)
- TABLE 7 Powder metallurgy market estimates and forecasts by other materials, 2018 - 2030 (Tons) (USD Million)
- TABLE 8 Copper-based powder applications
- TABLE 9 Powder metallurgy market estimates and forecasts, by additive manufacturing, 2018 - 2030
- TABLE 10 Powder metallurgy market estimates and forecasts, by powder bed process, 2018 - 2030
- TABLE 11 Powder metallurgy market estimates and forecasts, by blown powder process, 2018 - 2030
- TABLE 12 Powder metallurgy market estimates and forecasts, by hot isostatic pressing, 2018 - 2030 (Tons) (USD Million)
- TABLE 13 Powder metallurgy market estimates and forecasts, by metal injection molding, 2018 - 2030 (Tons) (USD Million)
- TABLE 14 Powder metallurgy market estimates and forecasts in aerospace & defense, 2018 - 2030 (Tons) (USD Million)
- TABLE 15 Top 10 countries with highest defense spending, 2019
- TABLE 16 Powder metallurgy market estimates and forecasts in automotive, 2018 - 2030 (Tons) (USD Million)
- TABLE 17 Powder metallurgy market estimates and forecasts in medical & dental, 2018 - 2030 (Tons) (USD Million)
- TABLE 18 Powder metallurgy market estimates and forecasts in oil & gas, 2018 - 2030 (Tons) (USD Million)
- TABLE 19 Powder metallurgy market estimates and forecasts in industrial applications, 2018 - 2030 (Tons) (USD Million)
- TABLE 20 Powder metallurgy market estimates and forecasts by original equipment manufacturers (OEMs), 2018 - 2030 (Tons) (USD Million)
- TABLE 21 Powder metallurgy market estimates and forecasts by AM operators, 2018 - 2030 (Tons) (USD Million)
- TABLE 22 North America powder metallurgy market estimates and forecasts, 2018 - 2030 (Tons) (USD Million)
- TABLE 23 North America powder metallurgy market estimates and forecasts, by material, 2018 - 2030 (Tons)
- TABLE 24 North America powder metallurgy market estimates and forecasts, by material, 2018 - 2030 (USD Million)
- TABLE 25 North America powder metallurgy market estimates and forecasts, by process, 2018 - 2030 (Tons)
- TABLE 26 North America powder metallurgy market estimates and forecasts, by process, 2018 - 2030 (USD Million)
- TABLE 27 North America powder metallurgy market estimates and forecasts, by additive manufacturing, 2018 - 2030 (Tons)
- TABLE 28 North America powder metallurgy market estimates and forecasts, by additive manufacturing, 2018 - 2030 (USD Million)
- TABLE 29 North America powder metallurgy market estimates and forecasts, by application, 2018 - 2030 (Tons)
- TABLE 30 North America powder metallurgy market estimates and forecasts, by application, 2018 - 2030 (USD Million)
- TABLE 31 North America powder metallurgy market estimates and forecasts, by end-use, 2018 - 2030 (Tons)
- TABLE 32 North America powder metallurgy market estimates and forecasts, by end-use, 2018 - 2030 (USD Million)
- TABLE 33 U.S. powder metallurgy market estimates and forecasts, 2018 - 2030 (Tons) (USD Million)
- TABLE 34 U.S. powder metallurgy market estimates and forecasts, by material, 2018 - 2030 (Tons)
- TABLE 35 U.S. powder metallurgy market estimates and forecasts, by material, 2018 - 2030 (USD Million)
- TABLE 36 U.S. powder metallurgy market estimates and forecasts, by process, 2018 - 2030 (Tons)
- TABLE 37 U.S. powder metallurgy market estimates and forecasts, by process, 2018 - 2030 (USD Million)
- TABLE 38 U.S. powder metallurgy market estimates and forecasts, by additive manufacturing, 2018 - 2030 (Tons)
- TABLE 39 U.S. powder metallurgy market estimates and forecasts, by additive manufacturing, 2018 - 2030 (USD Million)
- TABLE 40 U.S. powder metallurgy market estimates and forecasts, by application, 2018 - 2030 (Tons)
- TABLE 41 U.S. powder metallurgy market estimates and forecasts, by application, 2018 - 2030 (USD Million)
- TABLE 42 U.S. powder metallurgy market estimates and forecasts, by end-use, 2018 - 2030 (Tons)
- TABLE 43 U.S. powder metallurgy market estimates and forecasts, by end-use, 2018 - 2030 (USD Million)
- TABLE 44 Europe powder metallurgy market estimates and forecasts, 2018 - 2030 (Tons) (USD Million)
- TABLE 45 Europe powder metallurgy market estimates and forecasts, by material, 2018 - 2030 (Tons)
- TABLE 46 Europe powder metallurgy market estimates and forecasts, by material, 2018 - 2030 (USD Million)
- TABLE 47 Europe powder metallurgy market estimates and forecasts, by process, 2018 - 2030 (Tons)
- TABLE 48 Europe powder metallurgy market estimates and forecasts, by process, 2018 - 2030 (USD Million)
- TABLE 49 Europe powder metallurgy market estimates and forecasts, by additive manufacturing, 2018 - 2030 (Tons)
- TABLE 50 Europe powder metallurgy market estimates and forecasts, by additive manufacturing, 2018 - 2030 (USD Million)
- TABLE 51 Europe powder metallurgy market estimates and forecasts, by application, 2018 - 2030 (Tons)
- TABLE 52 Europe powder metallurgy market estimates and forecasts, by application, 2018 - 2030 (USD Million)
- TABLE 53 Europe powder metallurgy market estimates and forecasts, by end-use, 2018 - 2030 (Tons)
- TABLE 54 Europe powder metallurgy market estimates and forecasts, by end-use, 2018 - 2030 (USD Million)
- TABLE 55 Germany powder metallurgy market estimates and forecasts, 2018 - 2030 (Tons) (USD Million)
- TABLE 56 Germany powder metallurgy market estimates and forecasts, by material, 2018 - 2030 (Tons)
- TABLE 57 Germany powder metallurgy market estimates and forecasts, by material, 2018 - 2030 (USD Million)
- TABLE 58 Germany powder metallurgy market estimates and forecasts, by process, 2018 - 2030 (Tons)
- TABLE 59 Germany powder metallurgy market estimates and forecasts, by process, 2018 - 2030 (USD Million)
- TABLE 60 Germany powder metallurgy market estimates and forecasts, by additive manufacturing, 2018 - 2030 (Tons)
- TABLE 61 Germany powder metallurgy market estimates and forecasts, by additive manufacturing, 2018 - 2030 (USD Million)
- TABLE 62 Germany powder metallurgy market estimates and forecasts, by application, 2018 - 2030 (Tons)
- TABLE 63 Germany powder metallurgy market estimates and forecasts, by application, 2018 - 2030 (USD Million)
- TABLE 64 Germany powder metallurgy market estimates and forecasts, by end-use, 2018 - 2030 (Tons)
- TABLE 65 Germany powder metallurgy market estimates and forecasts, by end-use, 2018 - 2030 (USD Million)
- TABLE 66 France powder metallurgy market estimates and forecasts, 2018 - 2030 (Tons) (USD Million)
- TABLE 67 France powder metallurgy market estimates and forecasts, by material, 2018 - 2030 (Tons)
- TABLE 68 France powder metallurgy market estimates and forecasts, by material, 2018 - 2030 (USD Million)
- TABLE 69 France powder metallurgy market estimates and forecasts, by process, 2018 - 2030 (Tons)
- TABLE 70 France powder metallurgy market estimates and forecasts, by process, 2018 - 2030 (USD Million)
- TABLE 71 France powder metallurgy market estimates and forecasts, by additive manufacturing, 2018 - 2030 (Tons)
- TABLE 72 France powder metallurgy market estimates and forecasts, by additive manufacturing, 2018 - 2030 (USD Million)
- TABLE 73 France powder metallurgy market estimates and forecasts, by application, 2018 - 2030 (Tons)
- TABLE 74 France powder metallurgy market estimates and forecasts, by application, 2018 - 2030 (USD Million)
- TABLE 75 France powder metallurgy market estimates and forecasts, by end-use, 2018 - 2030 (Tons)
- TABLE 76 France powder metallurgy market estimates and forecasts, by end-use, 2018 - 2030 (USD Million)
- TABLE 77 UK powder metallurgy market estimates and forecasts, 2018 - 2030 (Tons) (USD Million)
- TABLE 78 UK powder metallurgy market estimates and forecasts, by material, 2018 - 2030 (Tons)
- TABLE 79 UK powder metallurgy market estimates and forecasts, by material, 2018 - 2030 (USD Million)
- TABLE 80 UK powder metallurgy market estimates and forecasts, by process, 2018 - 2030 (Tons)
- TABLE 81 UK powder metallurgy market estimates and forecasts, by process, 2018 - 2030 (USD Million)
- TABLE 82 UK powder metallurgy market estimates and forecasts, by additive manufacturing, 2018 - 2030 (Tons)
- TABLE 83 UK powder metallurgy market estimates and forecasts, by additive manufacturing, 2018 - 2030 (USD Million)
- TABLE 84 UK powder metallurgy market estimates and forecasts, by application, 2018 - 2030 (Tons)
- TABLE 85 UK powder metallurgy market estimates and forecasts, by application, 2018 - 2030 (USD Million)
- TABLE 86 UK powder metallurgy market estimates and forecasts, by end-use, 2018 - 2030 (Tons)
- TABLE 87 UK powder metallurgy market estimates and forecasts, by end-use, 2018 - 2030 (USD Million)
- TABLE 88 Asia Pacific powder metallurgy market estimates and forecasts, by material, 2018 - 2030 (Tons)
- TABLE 89 Asia Pacific powder metallurgy market estimates and forecasts, by material, 2018 - 2030 (USD Million)
- TABLE 90 Asia Pacific powder metallurgy market estimates and forecasts, by process, 2018 - 2030 (Tons)
- TABLE 91 Asia Pacific powder metallurgy market estimates and forecasts, by process, 2018 - 2030 (USD Million)
- TABLE 92 Asia Pacific powder metallurgy market estimates and forecasts, by additive manufacturing, 2018 - 2030 (Tons)
- TABLE 93 Asia Pacific powder metallurgy market estimates and forecasts, by additive manufacturing, 2018 - 2030 (USD Million)
- TABLE 94 Asia Pacific powder metallurgy market estimates and forecasts, by application, 2018 - 2030 (Tons)
- TABLE 95 Asia Pacific powder metallurgy market estimates and forecasts, by application, 2018 - 2030 (USD Million)
- TABLE 96 Asia Pacific powder metallurgy market estimates and forecasts, by end-use, 2018 - 2030 (Tons)
- TABLE 97 Asia Pacific powder metallurgy market estimates and forecasts, by end-use, 2018 - 2030 (USD Million)
- TABLE 98 China powder metallurgy market estimates and forecasts, 2018 - 2030 (Tons) (USD Million)
- TABLE 99 China powder metallurgy market estimates and forecasts, by material, 2018 - 2030 (Tons)
- TABLE 100 China powder metallurgy market estimates and forecasts, by material, 2018 - 2030 (USD Million)
- TABLE 101 China powder metallurgy market estimates and forecasts, by process, 2018 - 2030 (Tons)
- TABLE 102 China powder metallurgy market estimates and forecasts, by process, 2018 - 2030 (USD Million)
- TABLE 103 China powder metallurgy market estimates and forecasts, by additive manufacturing, 2018 - 2030 (Tons)
- TABLE 104 China powder metallurgy market estimates and forecasts, by additive manufacturing, 2018 - 2030 (USD Million)
- TABLE 105 China powder metallurgy market estimates and forecasts, by application, 2018 - 2030 (Tons)
- TABLE 106 China powder metallurgy market estimates and forecasts, by application, 2018 - 2030 (USD Million)
- TABLE 107 China powder metallurgy market estimates and forecasts, by end-use, 2018 - 2030 (Tons)
- TABLE 108 China powder metallurgy market estimates and forecasts, by end-use, 2018 - 2030 (USD Million)
- TABLE 109 Japan powder metallurgy market estimates and forecasts, 2018 - 2030 (Tons) (USD Million)
- TABLE 110 Japan powder metallurgy market estimates and forecasts, by material, 2018 - 2030 (Tons)
- TABLE 111 Japan powder metallurgy market estimates and forecasts, by material, 2018 - 2030 (USD Million)
- TABLE 112 Japan powder metallurgy market estimates and forecasts, by process, 2018 - 2030 (Tons)
- TABLE 113 Japan powder metallurgy market estimates and forecasts, by process, 2018 - 2030 (USD Million)
- TABLE 114 Japan powder metallurgy market estimates and forecasts, by additive manufacturing, 2018 - 2030 (Tons)
- TABLE 115 Japan powder metallurgy market estimates and forecasts, by additive manufacturing, 2018 - 2030 (USD Million)
- TABLE 116 Japan powder metallurgy market estimates and forecasts, by application, 2018 - 2030 (Tons)
- TABLE 117 Japan powder metallurgy market estimates and forecasts, by application, 2018 - 2030 (USD Million)
- TABLE 118 Japan powder metallurgy market estimates and forecasts, by end-use, 2018 - 2030 (Tons)
- TABLE 119 Japan powder metallurgy market estimates and forecasts, by end-use, 2018 - 2030 (USD Million)
- TABLE 120 Central & South America powder metallurgy market estimates and forecasts, by material, 2018 - 2030 (Tons)
- TABLE 121 Central & South America powder metallurgy market estimates and forecasts, by material, 2018 - 2030 (USD Million)
- TABLE 122 Central & South America powder metallurgy market estimates and forecasts, by process, 2018 - 2030 (Tons)
- TABLE 123 Central & South America powder metallurgy market estimates and forecasts, by process, 2018 - 2030 (USD Million)
- TABLE 124 Central & South America powder metallurgy market estimates and forecasts, by additive manufacturing, 2018 - 2030 (Tons)
- TABLE 125 Central & South America powder metallurgy market estimates and forecasts, by additive manufacturing, 2018 - 2030 (USD Million)
- TABLE 126 Central & South America powder metallurgy market estimates and forecasts, by application, 2018 - 2030 (Tons)
- TABLE 127 Central & South America powder metallurgy market estimates and forecasts, by application, 2018 - 2030 (USD Million)
- TABLE 128 Central & South America powder metallurgy market estimates and forecasts, by end-use, 2018 - 2030 (Tons)
- TABLE 129 Central & South America powder metallurgy market estimates and forecasts, by end-use, 2018 - 2030 (USD Million)
- TABLE 130 Brazil powder metallurgy market estimates and forecasts, 2018 - 2030 (Tons) (USD Million)
- TABLE 131 Brazil powder metallurgy market estimates and forecasts, by material, 2018 - 2030 (Tons)
- TABLE 132 Brazil powder metallurgy market estimates and forecasts, by material, 2018 - 2030 (USD Million)
- TABLE 133 Brazil powder metallurgy market estimates and forecasts, by process, 2018 - 2030 (Tons)
- TABLE 134 Brazil powder metallurgy market estimates and forecasts, by process, 2018 - 2030 (USD Million)
- TABLE 135 Brazil powder metallurgy market estimates and forecasts, by additive manufacturing, 2018 - 2030 (Tons)
- TABLE 136 Brazil powder metallurgy market estimates and forecasts, by additive manufacturing, 2018 - 2030 (USD Million)
- TABLE 137 Brazil powder metallurgy market estimates and forecasts, by application, 2018 - 2030 (Tons)
- TABLE 138 Brazil powder metallurgy market estimates and forecasts, by application, 2018 - 2030 (USD Million)
- TABLE 139 Brazil powder metallurgy market estimates and forecasts, by end-use, 2018 - 2030 (Tons)
- TABLE 140 Brazil powder metallurgy market estimates and forecasts, by end-use, 2018 - 2030 (USD Million)
- TABLE 141 Middle East & Africa powder metallurgy market estimates and forecasts, by material, 2018 - 2030 (Tons)
- TABLE 142 Middle East & Africa powder metallurgy market estimates and forecasts, by material, 2018 - 2030 (USD Million)
- TABLE 143 Middle East & Africa powder metallurgy market estimates and forecasts, by process, 2018 - 2030 (Tons)
- TABLE 144 Middle East & Africa powder metallurgy market estimates and forecasts, by process, 2018 - 2030 (USD Million)
- TABLE 145 Middle East & Africa powder metallurgy market estimates and forecasts, by additive manufacturing, 2018 - 2030 (Tons)
- TABLE 146 Middle East & Africa powder metallurgy market estimates and forecasts, by additive manufacturing, 2018 - 2030 (USD Million)
- TABLE 147 Middle East & Africa powder metallurgy market estimates and forecasts, by application, 2018 - 2030 (Tons)
- TABLE 148 Middle East & Africa powder metallurgy market estimates and forecasts, by application, 2018 - 2030 (USD Million)
- TABLE 149 Middle East & Africa powder metallurgy market estimates and forecasts, by end-use, 2018 - 2030 (Tons)
- TABLE 150 Middle East & Africa powder metallurgy market estimates and forecasts, by end-use, 2018 - 2030 (USD Million)
List of Figures
- FIG. 1 Market segmentation
- FIG. 2 Information procurement
- FIG. 3 Data Analysis Models
- FIG. 4 Market Formulation and Validation
- FIG. 5 Market snapshot
- FIG. 6 Segmental outlook - Material & Process
- FIG. 7 Segmental outlook - Application & End-Use
- FIG. 8 Competitive Outlook
- FIG. 9 Powder metallurgy market outlook, 2018 - 2030 (USD Million) (Kilotons)
- FIG. 10 Value chain analysis
- FIG. 11 Market dynamics
- FIG. 12 Porter's Analysis
- FIG. 13 PESTEL Analysis
- FIG. 14 Powder metallurgy market, by material: Key takeaways
- FIG. 15 Powder metallurgy market, material: Market share, 2022 & 2030
- FIG. 16 Powder metallurgy market, by process: Key takeaways
- FIG. 17 Powder metallurgy market, by process: Market share, 2022 & 2030
- FIG. 18 Powder metallurgy market, by application: Key takeaways
- FIG. 19 Powder metallurgy market, by application: Market share, 2022 & 2030
- FIG. 20 Powder metallurgy market, by end-use: Key takeaways
- FIG. 21 Powder metallurgy market, by end-use: Market share, 2022 & 2030
- FIG. 22 Powder metallurgy market: Regional analysis, 2022
- FIG. 23 Powder metallurgy market, by region: Key takeaways
Powder Metallurgy Market Growth & Trends:
The global powder metallurgy market size is estimated to reach USD 6.36 billion by 2030, according to a new report by Grand View Research, Inc., expanding at a CAGR of 12.9% over the forecast period. Increasing initiatives to reduce the weight of aerospace parts by using additive manufacturing along with a rise in demand for lightweight auto parts from the automotive industry drives the market growth.
The aircraft manufacturers are focusing on saving the cost and weight of aircraft parts, which increases the demand for 3D printing materials to deliver high-performance and cost-effective aircraft elements. An increase in the number of 3D printers in terms of feature, size, and material compatibility in the long run coupled with strong competitive strategies to expand through various partnerships and joint ventures is further expected to drive the market growth.
The growing demand from the healthcare industry for personalized prosthetics along with increasing usage of medical devices propels the sales mostly from the metal additive manufacturing market space. In the industrial sector, rapid prototyping and on-site production are estimated to offer promising growth opportunities to market vendors over the projected period.
The COVID-19 pandemic led to the shutdown of manufacturing and metallurgy industries and affected both upsides and downsides in the year 2020. The key end-use sectors of the powder metallurgy industry, including the automotive, aerospace, and consumer goods sectors, have observed a negative trend in FY 2020. For instance, in April 2021, Toyota Motor Corp. experienced a decline in worldwide sales by 5.1% in the fiscal year ending March 2021. This has stalled automotive and other industrial production activities and caused a severe decline in demand for powder metals, such as iron, steel, and aluminum.
Powder Metallurgy Market Report Highlights:
- The steel material segment is estimated to witness a CAGR of 12.0%, in terms of revenue, over the projected period. The low cost and easy availability of steel are expected to drive the segment growth
- The Metal Injection Molding (MIM) process segment led the global market in 2020 and is projected to witness steady growth over the coming years owing to the significance of the process in the components manufacturing industry
- The aerospace & defense application segment accounted for the largest revenue share of more than 51.0% in 2022. The aerospace & defense industry is highly focused on adapting new technologies with a high investment budget, which is the key driving factor for the segment
- Large-scale OEMs, generally from the aircraft industry, are investing significantly in metal 3D printing to manufacture aeronautical parts, which is expected to drive the OEMs end-use segment at the fastest CAGR over the forecast years
- North America accounted for the highest share of more than 34.0% in 2022. Increased funding for the R&D and standardization in the technology segment in leading European countries is expected to propel the market growth
Table of Contents
Chapter 1. Methodology and Scope
- 1.1. Market Segmentation & Scope
- 1.2. Market Definition
- 1.3. Information Procurement
- 1.3.1. Information Analysis
- 1.3.2. Data Analysis Models
- 1.3.3. Market Formulation & Data Visualization
- 1.3.4. Data Validation & Publishing
- 1.4. Research Scope and Assumptions
- 1.4.1. List of Data Sources
Chapter 2. Executive Summary
- 2.1. Market Outlook
- 2.2. Segmental Outlook
- 2.3. Competitive Outlook
Chapter 3. Market Variables, Trends, and Scope
- 3.1. Market Outlook
- 3.2. Value Chain Analysis
- 3.2.1. Raw material trends
- 3.3. Manufacturing and technology trends
- 3.3.1. Technology used by some of the key companies for metal powder production.
- 3.3.2. Powder metallurgy processes
- 3.3.2.1. Metal injection molding (MIM)
- 3.3.2.2. Metal additive manufacturing
- 3.3.2.3. Powder metal hot isostatic pressing (PM HIP)
- 3.4. Market Dynamics
- 3.4.1. Market driver analysis
- 3.4.2. Market restraint analysis
- 3.4.3. Market challenges
- 3.4.4. Market opportunity analysis
- 3.5. Regulatory Framework
- 3.6. Powder Metallurgy Industry Analysis-Porter's Five Forces
- 3.6.1. Bargaining power of supplier
- 3.6.2. Bargaining power of buyers
- 3.6.3. Competitive rivalry
- 3.6.4. Threat of substitutes
- 3.6.5. Threat of new entrants
- 3.7. Powder Metallurgy Industry Analysis-PESTEL Analysis
- 3.7.1. Political
- 3.7.2. Economics
- 3.7.3. Social
- 3.7.4. Technological
- 3.7.5. Environmental
- 3.7.6. Legal
Chapter 4. Powder Metallurgy Market: Material Estimates & Forecasts Trend Analysis
- 4.1. Definition & Scope
- 4.2. Material Movement Analysis & Market Share, 2022 & 2030
- 4.3. Titanium
- 4.3.1. Powder metallurgy market estimates & forecasts, by titanium, 2018 - 2030 (USD Million) (Tons)
- 4.4. Nickel
- 4.4.1. Powder metallurgy market estimates & forecasts, by nickel, 2018 - 2030 (USD Million) (Tons)
- 4.5. Steel
- 4.5.1. Powder metallurgy market estimates & forecasts, by steel, 2018 - 2030 (USD Million) (Tons)
- 4.6. Aluminum
- 4.6.1. Powder metallurgy market estimates & forecasts, by aluminum, 2018 - 2030 (USD Million) (Tons)
- 4.7. Cobalt
- 4.7.1. Powder metallurgy market estimates & forecasts, by cobalt, 2018 - 2030 (USD Million) (Tons)
- 4.8. Others
- 4.8.1. Powder metallurgy market estimates & forecasts, by other materials, 2018 - 2030 (USD Million) (Tons)
Chapter 5. Powder Metallurgy Market: Process Estimates & Forecast Trend Analysis
- 5.1. Definition & Scope
- 5.2. Process Movement Analysis & Market Share, 2022 & 2030
- 5.3. Additive Manufacturing
- 5.3.1. Powder metallurgy market estimates & forecasts, by additive manufacturing, 2018 -2030 (USD Million) (Tons)
- 5.3.2. Powder metallurgy market estimates & forecasts, by types of additive manufacturing, 2018 -2030 (USD Million) (Tons)
- 5.4. Hot Isostatic Pressing
- 5.4.1. Powder metallurgy market estimates & forecasts, by hot isostatic pressing, 2018 - 2030 (USD Million) (Tons)
- 5.5. Metal Injection Molding
- 5.5.1. Powder metallurgy market estimates & forecasts, by metal injection molding, 2018 - 2030 (USD Million) (Tons)
Chapter 6. Powder Metallurgy Market: Application Estimates & Forecast Trend Analysis
- 6.1. Definition & Scope
- 6.2. Application Movement Analysis & Market Share, 2022 & 2030
- 6.3. Aerospace & defense
- 6.3.1. Powder metallurgy market estimates & forecasts, by aerospace & defense, 2018 - 2030 (USD Million) (Tons)
- 6.4. Automotive
- 6.4.1. Powder metallurgy market estimates & forecasts, by automotive, 2018 - 2030 (USD Million) (Tons)
- 6.5. Oil & Gas
- 6.5.1. Powder metallurgy market estimates & forecasts, by oil & gas, 2018 - 2030 (USD Million) (Tons)
- 6.6. Medical & Dental
- 6.6.1. Powder metallurgy market estimates & forecasts, by medical & dental, 2018 - 2030 (USD Million) (Tons)
- 6.7. Industrial
- 6.7.1. Powder metallurgy market estimates & forecasts, by industrial, 2018 - 2030 (USD Million) (Tons)
Chapter 7. Powder Metallurgy Market: End-Use Estimates & Forecast Trend Analysis
- 7.1. Definition & Scope
- 7.2. End-Use Movement Analysis & Market Share, 2022 & 2030
- 7.3. OEMs
- 7.3.1. Powder metallurgy market estimates & forecasts, by OEMs, 2018 - 2030 (USD Million) (Tons)
- 7.4. AM Operators
- 7.4.1. Powder metallurgy market estimates & forecasts, by AM operators, 2018 - 2030 (USD Million) (Tons)
Chapter 8. Powder Metallurgy Market Regional Estimates & Forecast Trend Analysis
- 8.1. Regional movement analysis & market share, 2022 & 2030
- 8.2. North America
- 8.2.1. North America powder metallurgy market estimates and forecasts, 2018 - 2030 (USD Million) (Tons)
- 8.2.2. North America powder metallurgy market estimates and forecasts, by materials, 2018 - 2030 (USD Million) (Tons)
- 8.2.3. North America powder metallurgy market estimates and forecasts, by process, 2018 - 2030 (USD Million) (Tons)
- 8.2.4. North America powder metallurgy market estimates and forecasts, by application, 2018 - 2030 (USD Million) (Tons)
- 8.2.5. U.S.
- 8.2.5.1. U.S. powder metallurgy market estimates and forecasts, 2018 - 2030 (USD Million) (Tons)
- 8.2.5.2. U.S. powder metallurgy market estimates and forecasts, by material, 2018 - 2030 (USD Million) (Tons)
- 8.2.5.3. U.S. powder metallurgy market estimates and forecasts, by process, 2018 - 2030 (USD Million) (Tons)
- 8.2.5.4. U.S. powder metallurgy market estimates and forecasts, by application, 2018 - 2030 (USD Million) (Tons)
- 8.3. Europe
- 8.3.1. Europe powder metallurgy market estimates and forecasts, 2018 - 2030 (USD Million) (Tons)
- 8.3.2. Europe powder metallurgy market estimates and forecasts, by material, 2018 - 2030 (USD Million) (Tons)
- 8.3.3. Europe powder metallurgy market estimates and forecasts, by process, 2018 - 2030 (USD Million) (Tons)
- 8.3.4. Europe powder metallurgy market estimates and forecasts, by application, 2018 - 2030 (USD Million) (Tons)
- 8.3.5. Germany
- 8.3.5.1. Germany powder metallurgy market estimates and forecasts, 2018 - 2030 (USD Million) (Tons)
- 8.3.5.2. Germany powder metallurgy market estimates and forecasts, by material, 2018 - 2030 (USD Million) (Tons)
- 8.3.5.3. Germany powder metallurgy market estimates and forecasts, by process, 2018 - 2030 (USD Million) (Tons)
- 8.3.5.4. Germany powder metallurgy market estimates and forecasts, by application, 2018 - 2030 (USD Million) (Tons)
- 8.3.6. France
- 8.3.6.1. France powder metallurgy market estimates and forecasts, 2018 - 2030 (USD Million) (Tons)
- 8.3.6.2. France powder metallurgy market estimates and forecasts, by material, 2018 - 2030 (USD Million) (Tons)
- 8.3.6.3. France powder metallurgy market estimates and forecasts, by process, 2018 - 2030 (USD Million) (Tons)
- 8.3.6.4. France powder metallurgy market estimates and forecasts, by application, 2018 - 2030 (USD Million) (Tons)
- 8.3.7. UK
- 8.3.7.1. UK powder metallurgy market estimates and forecasts, 2018 - 2030 (USD Million) (Tons)
- 8.3.7.2. UK powder metallurgy market estimates and forecasts, by material, 2018 - 2030 (USD Million) (Tons)
- 8.3.7.3. UK powder metallurgy market estimates and forecasts, by process, 2018 - 2030 (USD Million) (Tons)
- 8.3.7.4. UK powder metallurgy market estimates and forecasts, by application, 2018 - 2030 (USD Million) (Tons)
- 8.4. Asia Pacific
- 8.4.1. Asia Pacific powder metallurgy market estimates and forecasts, 2018 - 2030 (USD Million) (Tons)
- 8.4.2. Asia Pacific powder metallurgy market estimates and forecasts, by material, 2018 - 2030 (USD Million) (Tons)
- 8.4.3. Asia Pacific powder metallurgy market estimates and forecasts, by process, 2018 - 2030 (USD Million) (Tons)
- 8.4.4. Asia Pacific powder metallurgy market estimates and forecasts, by application, 2018 - 2030 (USD Million) (Tons)
- 8.4.5. China
- 8.4.5.1. China powder metallurgy market estimates and forecasts, 2018 - 2030 (USD Million) (Tons)
- 8.4.5.2. China powder metallurgy market estimates and forecasts, by material, 2018 - 2030 (USD Million) (Tons)
- 8.4.5.3. China powder metallurgy market estimates and forecasts, by process, 2018 - 2030 (USD Million) (Tons)
- 8.4.5.4. China powder metallurgy market estimates and forecasts, by application, 2018 - 2030 (USD Million) (Tons)
- 8.4.6. Japan
- 8.4.6.1. Japan powder metallurgy market estimates and forecasts, 2018 - 2030 (USD Million) (Tons)
- 8.4.6.2. Japan powder metallurgy market estimates and forecasts, by materials, 2018 - 2030 (USD Million) (Tons)
- 8.4.6.3. Japan powder metallurgy market estimates and forecasts, by process, 2018 - 2030 (USD Million) (Tons)
- 8.4.6.4. Japan powder metallurgy market estimates and forecasts, by application, 2018 - 2030 (USD Million) (Tons)
- 8.5. Central & South America
- 8.5.1. Central & South America powder metallurgy market estimates and forecasts, 2018 - 2030 (USD Million) (Tons)
- 8.5.2. Central & South America powder metallurgy market estimates and forecasts, by materials, 2018 - 2030 (USD Million) (Tons)
- 8.5.3. Central & South America powder metallurgy market estimates and forecasts, by process, 2018 - 2030 (USD Million) (Tons)
- 8.5.4. Central & South America powder metallurgy market estimates and forecasts, by application, 2018 - 2030 (USD Million) (Tons)
- 8.5.5. Brazil
- 8.5.5.1. Brazil powder metallurgy market estimates and forecasts, 2018 - 2030 (USD Million) (Tons)
- 8.5.5.2. Brazil powder metallurgy market estimates and forecasts, by material, 2018 - 2030 (USD Million) (Tons)
- 8.5.5.3. Brazil powder metallurgy market estimates and forecasts, by process, 2018 - 2030 (USD Million) (Tons)
- 8.5.5.4. Brazil powder metallurgy market estimates and forecasts, by application, 2018 - 2030 (USD Million) (Tons)
- 8.6. Middle East & Africa
- 8.6.1. Middle East & Africa powder metallurgy market estimates and forecasts, 2018 - 2030 (USD Million) (Tons)
- 8.6.2. Middle East & Africa powder metallurgy market estimates and forecasts, by material, 2018 - 2030 (USD Million) (Tons)
- 8.6.3. Middle East & Africa powder metallurgy market estimates and forecasts, by process, 2018 - 2030 (USD Million) (Tons)
- 8.6.4. Middle East & Africa powder metallurgy market estimates and forecasts, by application, 2018 - 2030 (USD Million) (Tons)
Chapter 9. Competitive Landscape
- 9.1. Recent Developments & Impact Analysis, By Key Market Participants
- 9.2. Company Ranking
- 9.3. Heat Map Analysis
- 9.4. Market Strategies
- 9.5. Vendor Landscape
- 9.5.1. List of raw material supplier, key manufacturers, and distributors
- 9.5.2. List of prospective end-users
- 9.6. Strategy Mapping
- 9.7. Company Profiles/Listing
- 9.7.1. Molyworks Material Corporation
- 9.7.1.1. Company overview
- 9.7.1.2. Product benchmarking
- 9.7.2. POLEMA
- 9.7.2.1. Company overview
- 9.7.2.2. Product benchmarking
- 9.7.3. Sandvik AB
- 9.7.3.1. Company overview
- 9.7.3.2. Financial performance
- 9.7.3.3. Product benchmarking
- 9.7.4. Hoganas AB
- 9.7.4.1. Company overview
- 9.7.4.2. Product benchmarking
- 9.7.5. GKN PLC
- 9.7.5.1. Company overview
- 9.7.5.2. Product benchmarking
- 9.7.6. Rio Tinto Metal Powder
- 9.7.6.1. Company overview
- 9.7.6.2. Product benchmarking
- 9.7.7. RusAL
- 9.7.7.1. Company overview
- 9.7.7.2. Product benchmarking
- 9.7.8. CRS Holdings, LLC
- 9.7.8.1. Company overview
- 9.7.8.2. Product benchmarking
- 9.7.9. Advanced- Technology & Materials Co, Ltd. (AT&M)
- 9.7.9.1. Company overview
- 9.7.9.2. Product benchmarking
- 9.7.10. Liberty Steel Group
- 9.7.10.1. Company overview
- 9.7.10.2. Financial performance
- 9.7.10.3. Product benchmarking
- 9.7.11. Newby Foundries Ltd
- 9.7.11.1. Company overview
- 9.7.11.2. Financial performance
- 9.7.11.3. Product benchmarking
- 9.7.1. Molyworks Material Corporation