|
|
市場調査レポート
商品コード
1404805
航空宇宙部品製造の世界市場:規模、シェア・動向分析レポート - 製品別、航空機タイプ別、地域別、セグメント予測、2024~2030年Aerospace Parts Manufacturing Market Size, Share & Trends Analysis Report By Product (Engines, Avionics), By Aircraft Type (Business, Military), By Region (North America, Asia Pacific), And Segment Forecasts, 2024 - 2030 |
||||||
|
|
|||||||
カスタマイズ可能
|
|||||||


| 航空宇宙部品製造の世界市場:規模、シェア・動向分析レポート - 製品別、航空機タイプ別、地域別、セグメント予測、2024~2030年 |
|
出版日: 2023年11月29日
発行: Grand View Research
ページ情報: 英文 109 Pages
納期: 2~10営業日
|

- 全表示
- 概要
- 図表
- 目次
航空宇宙部品製造市場の成長と動向:
世界の航空宇宙部品製造の市場規模は、2030年に1兆2,332億4,000万米ドルと推定され、2024~2030年にかけてCAGR 4.2%で成長すると予測されています。
新興諸国の経済成長を背景とした世界の航空旅客・航空貨物量の拡大と、商業航空における主な発展が、航空宇宙部品製造市場の主な促進要因となっています。
年間航空旅客数は、手頃な航空券価格、フライトの頻度、路線の利用可能性によって増加の一途をたどっています。これは今後数年間、航空宇宙部品製造市場にプラスの影響を与えると思われます。航空は炭素集約型であり、温室効果ガスの排出量において最も急成長しているセクターのひとつです。航空輸送需要の増加と限界燃料効率の低下は、航空宇宙産業に温室効果ガス排出削減のプレッシャーをかけると思われます。
一人当たり所得の増加と相まって、新興国経済の成長と改善が予測期間中に旅客と航空貨物の需要を牽引し、その結果、航空宇宙部品製造の需要が急増すると予想されます。さらに、航空機の老朽化、技術の進歩、効率的な航空機へのニーズの高まり、宇宙ミッションなどの特定のミッション用に設計された航空機が、新しい航空機の需要を促進し、それによって航空宇宙部品製造の需要を押し上げると予想されます。
航空機の運用コストを削減し効率を向上させるための国防支出の増加は、技術革新の機会を生み出すと予想され、ひいては航空宇宙部品製造市場の技術進歩を後押しすると期待されます。さらに、エネルギーコストは航空機の運用において最も大きな出費であり続けているため、より多くの就航中の航空機を燃料効率の高い航空機に置き換える必要に迫られています。これはさらに、航空機および航空エンジンメーカーに大きなチャンスをもたらすと予想されます。
航空宇宙部品メーカーは、サプライヤーから直接、または競合価格での供給契約や入札の取り決めのもと、サードパーティサプライヤーを通じて原材料を購入します。部品メーカーは、顧客向けにカスタマイズされた部品を製造するためにサプライヤーから原材料を調達します。部品メーカーは、安定した供給を維持するため、原料供給業者と長期契約を結んでいます。航空エンジンのような複雑な航空宇宙部品のメーカーは、市場内で独自のサプライチェーンを持っています。
航空機メーカーは、ブランドを差別化し、運航上の要件を満たすために、大手航空会社などの主要顧客にカスタマイズの柔軟性を提供します。そして航空会社は、サプライヤーが提供する事前認定されたコンポーネントを追加したり変更したりします。航空会社は、航空宇宙部品メーカーと、その製品の供給と保守に関する最終契約を結ぶ。さらに、サフラン・グループなどの主要市場サプライヤーは、航空会社にエンジンを提供し、同時にメンテナンス、修理、オーバーホール・サービスを提供しています。
航空宇宙部品製造市場のレポートハイライト
- 製品別では、航空機製造が2022年の航空宇宙部品製造業界を支配し、51.5%の収益シェアを占める。しかし、断熱部品の製造が最も力強い成長を示しており、近い将来この傾向が続くと予想されます。積層造形は、低コストやミスの削減などの利点により、注目を集めています。
- 航空機タイプ別では、旅客機、貨物機、貨物機を含む民間航空機が市場を独占しています。世界の民間旅客機と貨物機は、今後20年間で倍増すると予想される年間旅客数に合わせて成長する見込みです。
- 地域別では、北米が最大のシェアを占めており、2022年には市場全体の50.5%以上を占めました。
- アジア太平洋は、日本、中国、その他の市場の経済成長に牽引された同地域の航空産業の新興市場開拓の成長により、航空宇宙部品製造業界にとって最も急成長している市場と推定されます。さらに、旅客輸送量の増加が予測期間中の市場成長を促進すると予測されています。
- 航空宇宙部品製造企業は、材料購入や設計プロセスの初期段階からバリューチェーンに組み込まれています。航空機製造企業はサプライヤーと緊密に連携し、技術動向を監視するとともに、部品の入手可能性や価格の変化を予測します。
目次
第1章 調査手法と範囲
第2章 エグゼクティブサマリー
第3章 航空宇宙部品製造市場の変数、動向、範囲
- 業界のバリューチェーン分析
- サプライヤーの見通し
- トッププロデューサー
- 技術概要
- 軽量素材
- 積層造形
- 原材料動向
- フィリピンの原材料動向
- 規制の枠組み
- 米国連邦航空局
- アジア太平洋の規制枠組み
- 米国
- カナダ
- メキシコ
- ドイツ
- 英国
- フランス
- イタリア
- オランダ
- インドネシア
- マレーシア
- フィリピン
- 中国
- 日本
- インド
- 大韓民国
- オーストラリア
- サウジアラビア
- アラブ首長国連邦
- カタール
- ブラジル
- 航空宇宙部品製造市場 - 市場力学
- 市場促進要因分析
- 市場抑制要因分析
- 市場課題
- 市場機会
- 事業環境分析:航空宇宙部品製造市場
- 航空宇宙部品製造市場 - ポーターの分析
- 航空宇宙部品製造市場:PESTEL分析
- 部品製造とMROの成長機会
- アジア太平洋
- フィリピン
- 航空宇宙産業分析:国別
- マレーシア
- モロッコ
- メキシコ
第4章 航空宇宙部品製造市場:製品の推定・動向分析
- 重要なポイント
- 製品変動分析と市場シェア、2023年・2030年
- エンジン
- 航空機製造
- キャビン内装
- 設備、システム、サポート
- アビオニクス
- 断熱部品
第5章 航空宇宙部品製造市場:航空機の推定・動向分析
- 重要なポイント
- 航空機変動分析と市場シェア、2023年・2030年
- 民間航空機
- ビジネス航空機
- 軍用機
- その他
第6章 航空宇宙部品製造市場:地域の推定・動向分析
- 航空宇宙部品製造市場:地域別の見通し
- 北米
- 北米の航空宇宙部品製造市場の推定・予測、2018~2030年
- 米国
- カナダ
- メキシコ
- 欧州
- 欧州の航空宇宙部品製造市場の推定・予測、2018~2030年
- ドイツ
- 英国
- フランス
- イタリア
- オランダ
- アジア太平洋
- アジア太平洋の航空宇宙部品製造市場の推定・予測、2018~2030年
- インドネシア
- マレーシア
- フィリピン
- 中国
- 日本
- オーストラリア
- 中南米
- 中南米の航空宇宙部品製造市場の推定・予測、2018~2030年
- ブラジル
- 中東・アフリカ
- 中東・アフリカの航空宇宙部品製造市場の推定・予測、2018~2030年
第7章 航空宇宙部品製造市場 - 競合情勢
- 企業の市場シェア、2023年
- 商用ターボファンエンジン市場シェア - 企業の市場シェア分析
- 航空宇宙部品製造市場:流通情勢
- 競合情勢
- 戦略フレームワーク
- 企業一覧
- JAMCO Corporation
- Intrex Aerospace
- Rolls Royce plc
- CAMAR Aircraft Parts Company
- Safran Group
- Woodward, Inc.
- Engineered Propulsion System
- Eaton Corporation plc
- Aequs
- Aero Engineering &Manufacturing Co.
- GE Aviation
- Lycoming Engines
- Pratt &Whitney
- Superior Air Parts Inc.
- MTU Aero Engines AG
- Honeywell International, Inc.
- Collins Aerospace
- Composite Technology Research Malaysia Sdn. Bhd.
- Mitsubishi Heavy Industries Ltd.
- Kawasaki Heavy Industries Ltd.
- Subaru Corporation
- IHI Corporation
- Lufthansa Technik AG
- Diel Aviation Holding GmbH
- Elektro-Metall Export GmbH
- Liebherr International AG
- Hexcel Corporation
- DuCommun Incorporated
- Rockwell Collins
- Spirit Aerosystems, Inc.
- Panasonic Avionics Corporation
- Zodiac Aerospace
- Thales SA
- Dassault Systems SE
- Parker-Hannifin Corporation
- Chemetall GmbH
- Premium AEROTECH GmbH
- Daher Group
- FACC AG
- Triumph Group
- Curtiss-Wright Corporation
- Stelia Aerospace
- Magellan Aerospace
- Bridgestone Corporation
List of Tables
- Table 1 Aerospace Manufacturing Parts Market Estimates & Forecast, By Product, 2018 - 2030 (USD Billion)
- Table 2 Aerospace Manufacturing Parts Market Estimates & Forecast, By Aircraft, 2018 - 2030 (USD Billion)
- Table 3 Aerospace Parts Manufacturing Market: Distribution Landscape
List of Figures
- Fig. 1 Aerospace Parts Manufacturing Market Segmentation
- Fig. 2 Information Procurement
- Fig. 3 Data Analysis Models
- Fig. 4 Market Formulation And Validation
- Fig. 5 Data Validating & Publishing
- Fig. 6 Regional Outlook
- Fig. 7 Segmental Outlook
- Fig. 8 Competitive Outlook
- Fig. 9 Aerospace parts manufacturing market - Industry value chain analysis
- Fig. 10 Aerospace parts manufacturing market: Supply chain
- Fig. 11 Aerospace parts manufacturing market: Market dynamics
- Fig. 12 Number of flights worldwide, 2017 - 2021 (In Millions)
- Fig. 13 In - service aircraft reaching 25 years of age which needs replacement (Units)
- Fig. 14 Prices of aluminum, 2017 - 2023 (USD/Ton)
- Fig. 15 Aerospace Parts Manufacturing Market, by Product: Key Takeaways
- Fig. 16 Aerospace Parts Manufacturing Market, by Product: Market Share, 2023 & 2030
- Fig. 17 Aerospace parts manufacturing market estimates & forecasts, by engine 2018 - 2030 (USD Billion)
- Fig. 18 Aerospace parts manufacturing market estimates & forecasts, by aircraft 2018 - 2030 (USD Billion)
- Fig. 19 Aerospace parts manufacturing market estimates & forecasts, by cabin interiors 2018 - 2030 (USD Billion)
- Fig. 20 Aerospace parts manufacturing market estimates & forecasts, by equipment, system, & support 2018 - 2030 (USD Billion)
- Fig. 21 Aerospace parts manufacturing market estimates & forecasts, by avionics 2018 - 2030 (USD Billion)
- Fig. 22 Aerospace parts manufacturing market estimates & forecasts, by insulation components 2018 - 2030 (USD Billion)
- Fig. 23 Aerospace Parts Manufacturing Market, by Aircraft: Key Takeaways
- Fig. 24 Aerospace Parts Manufacturing Market, by Application: Market Share, 2023 & 2030
- Fig. 25 Aerospace parts manufacturing market estimates & forecasts, by aircraft, 2018 - 2030 (USD Billion)
- Fig. 26 Aerospace parts manufacturing market estimates & forecasts, by aircraft, 2018 - 2030 (USD Billion)
- Fig. 27 Aerospace parts manufacturing market estimates & forecasts, by aircraft, 2018 - 2030 (USD Billion)
- Fig. 28 Aerospace parts manufacturing market estimates & forecasts, by aircraft, 2018 - 2030 (USD Billion)
- Fig. 29 Aerospace parts manufacturing market revenue, by region, 2023 & 2030 (USD Billion)
- Fig. 30 Regional marketplace: Key takeaways
- Fig. 31 Regional marketplace: Key takeaways
- Fig. 32 North America aerospace parts manufacturing market estimates & forecasts, 2018 - 2030 (USD Billion)
- Fig. 33 U.S. aerospace parts manufacturing market estimates & forecasts, 2018 - 2030 (USD Billion)
- Fig. 34 Canada aerospace parts manufacturing market estimates & forecasts, 2018 - 2030 (USD Billion)
- Fig. 35 Mexico aerospace parts manufacturing market estimates & forecasts, 2018 - 2030 (USD Billion)
- Fig. 36 Europe aerospace parts manufacturing market estimates & forecasts, 2018 - 2030 (USD Billion)
- Fig. 37 Germany aerospace parts manufacturing market estimates & forecasts, 2018 - 2030 (USD Billion)
- Fig. 38 UK aerospace parts manufacturing market estimates & forecasts, 2018 - 2030 (USD Billion)
- Fig. 39 France aerospace parts manufacturing market estimates & forecasts, 2018 - 2030 (USD Billion)
- Fig. 40 Italy aerospace parts manufacturing market estimates & forecasts, 2018 - 2030 (USD Billion)
- Fig. 41 The Netherlands aerospace parts manufacturing market estimates & forecasts, 2018 - 2030 (USD Billion)
- Fig. 42 Asia Pacific aerospace parts manufacturing market estimates & forecasts, 2018 - 2030 (USD Billion)
- Fig. 43 Indonesia aerospace parts manufacturing market estimates & forecasts, 2018 - 2030 (USD Billion)
- Fig. 44 Malaysia aerospace parts manufacturing market estimates & forecasts, 2018 - 2030 (USD Billion)
- Fig. 45 Philippines aerospace parts manufacturing market estimates & forecasts, 2018 - 2030 (USD Billion)
- Fig. 46 China aerospace parts manufacturing market estimates & forecasts, 2018 - 2030 (USD Billion)
- Fig. 47 Japan aerospace parts manufacturing market estimates & forecasts, 2018 - 2030 (USD Billion)
- Fig. 48 Australia aerospace parts manufacturing market estimates & forecasts, 2018 - 2030 (USD Billion)
- Fig. 49 Central & South America aerospace parts manufacturing market estimates & forecasts, 2018 - 2030 (USD Billion)
- Fig. 50 Brazil aerospace parts manufacturing market estimates & forecasts, 2018 - 2030 (USD Billion)
- Fig. 51 Middle East & Africa aerospace parts manufacturing market estimates & forecasts, 2018 - 2030 (USD Billion)
- Fig. 52 Commercial turbofan engines market share: Company market share analysis
Aerospace Parts Manufacturing Market Growth & Trends:
The global aerospace parts manufacturing market size was estimated at USD 1,233.24 billion in 2030 and is expected to grow at a compound annual growth rate (CAGR) of 4.2% from 2024 to 2030. The expansion in air passenger and air freight volume across the globe against the backdrop of economic growth in emerging countries and considerable developments in commercial aviation are the key drivers for aerospace parts manufacturing market.
The number of passengers flying per year has continued to ascend, fueled by affordable ticket prices, frequency of flights, and route availability. This is to positively impact on the aerospace parts manufacturing market over the coming years. Aviation is carbon intensive and one of the fastest growing sectors in terms of greenhouse emissions. Increasing demand for air transportation and decreasing marginal fuel efficiency are likely to put pressure on aerospace industry to reduce the greenhouse emissions.
Growth and improvement in emerging economies coupled with the increase in per capita income are expected to drive the demand for passenger and air freight over the forecast period, consequently resulting in surged demand for aerospace parts manufacturing. Moreover, the aging fleet, technological advancements, increased need for efficient aircraft, and aircraft designed for specific missions such as space missions are expected to drive the demand for new aircraft, thereby boosting the demand for aerospace parts manufacturing.
The increased defense spending to reduce the operational costs and improve the efficiency of aircraft is anticipated to create opportunities for innovation, which, in turn, is expected to boost the technological advancements in aerospace parts manufacturing market. Additionally, energy costs continue to be the most significant expense in aircraft operations, thus impelling the replacement of more in-service aircraft with fuel-efficient aircraft. This is further anticipated to present tremendous opportunities to the aircraft and aero engine manufacturers.
Aerospace parts manufacturers purchase raw materials either directly from suppliers or through third party suppliers under competitively priced supply contracts or bidding arrangements. Parts manufacturers procure raw materials from suppliers to produce customized components for their clients. They enter into long-term contracts with material suppliers to maintain a robust supply. The manufacturers of the complex aerospace parts, such as aero engines, have their own supply chain within the market.
Aircraft manufacturers provide the flexibility of customization to their major customers such as large airlines in order to differentiate the brands and fulfill operational requirements. Airlines then add or modify the pre-qualified components offered by the suppliers. Airlines enter into definitive agreements with aerospace parts manufacturers for the supply and maintenance of their products. In addition, major market suppliers such as Safran Group offer their engines to the airlines and simultaneously offer maintenance, repair, and overhaul services.
Aerospace Parts Manufacturing Market Report Highlights:
- On the basis of product, aircraft manufacturing is dominated the aerospace parts manufacturing industry in 2022 with the revenue share of 51.5%. However, manufacturing of insulation components represent the strongest growth and is expected to continue the trend in the near future. Additive manufacturing is gaining attraction, owing to its benefits, such as low-cost and reduction in errors.
- Based on aircraft type, commercial aircrafts dominated the market including passenger, freight, and cargo aircraft. The global commercial passenger and cargo fleet are expected to grow in line with the annual number of passengers, which is expected to double over the next two decades.
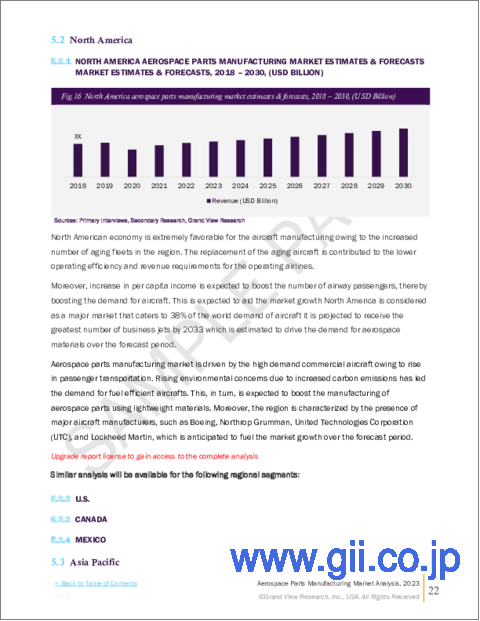
- Based on the region, North America contributes the largest share to the market, accounting for more than 50.5% of the total market in 2022, owing to the presence of key aerospace parts manufacturers coupled with the huge aircraft manufacturing industry in the region.
- The Asia Pacific region is estimated to be the fastest growing market for aerospace parts manufacturing industry due to growing development in the aviation industry in the region driven by the economic growth of Japan, China and other markets. Moreover, growth in passenger traffic is forecasted to drive the market growth over the forecast period.
- The aerospace parts manufacturing companies are integrated into the value chain from earlier stages of material purchase and design process. Aircraft manufacturing companies work closely with suppliers to monitor technological trends as well as to anticipate any changes in component availability and pricing.
Table of Contents
Chapter 1. Methodology and Scope
- 1.1. Market Segmentation & Scope
- 1.2. Research Methodology
- 1.3. Information Procurement
- 1.3.1. Purchased Database
- 1.3.2. GVR'S Internal Database
- 1.3.3. Secondary Sources
- 1.3.4. Third Party Perspective
- 1.3.5. Primary Research
- 1.4. Information Analysis
- 1.4.1. Data Analysis Models
- 1.5. Market Formulation and Data Visualization
- 1.6. List of data sources
Chapter 2. Executive Summary
- 2.1. Geographic Snapshot
- 2.2. Segment Snapshot
- 2.3. Segment Snapshot
- 2.4. Competitive Snapshot
Chapter 3. Aerospace Parts Manufacturing Market Variables, Trends & Scope
- 3.1. Industry Value Chain Analysis
- 3.1.1. SUPPLIER OUTLOOK
- 3.1.1.1. Airbus A380
- 3.1.1.1.1. Aerostructure
- 3.1.1.1.2. Engine
- 3.1.1.1.3. Equipment Safety & Support Component
- 3.1.1.1.4. Avionics
- 3.1.1.1.5. Insulation Components
- 3.1.1.1.6. Cabin Interiors
- 3.1.1.2. Airbus A350
- 3.1.1.2.1. Airframe systems & assemblies
- 3.1.1.2.2. Cabin interiors
- 3.1.1.2.3. Equipment Safety & Support Component
- 3.1.1.2.4. Avionics
- 3.1.1.2.5. Engine
- 3.1.1.2.6. Components
- 3.1.1.3. Boeing 787 Dreamliner
- 3.1.1.3.1. Airframe systems & assemblies
- 3.1.1.3.2. Cabin interiors
- 3.1.1.3.3. Equipment Safety & Support Component
- 3.1.1.3.4. Avionics
- 3.1.1.3.5. Engine
- 3.1.1.3.6. Components
- 3.1.1.4. List of Major Tier 1 and Tier 2 Suppliers, by Components
- 3.1.1.5. List of Major Products Manufactured by Companies
- 3.1.1.5.1. Jamco Corporation
- 3.1.1.5.2. Intrex Aerospace
- 3.1.1.5.3. Rolls Royce plc
- 3.1.1.5.4. CAMAR Aircraft Parts Company
- 3.1.1.5.5. Safran Group
- 3.1.1.5.6. Woodward, Inc.
- 3.1.1.5.7. Engineered Propulsion System
- 3.1.1.5.8. Eaton Corporation plc
- 3.1.1.5.9. Aequs
- 3.1.1.5.10. Aero Engineering & Manufacturing Co.
- 3.1.1.5.11. GE Aviation
- 3.1.1.5.12. Lycoming Engines
- 3.1.1.5.13. Pratt & Whitney
- 3.1.1.5.14. Superior Air Parts, Inc.
- 3.1.1.5.15. MTU Aero Engines AG
- 3.1.1.5.16. Honeywell International, Inc.
- 3.1.1.5.17. UTC Aerospace Systems
- 3.1.2. Top Producers
- 3.1.2.1. The Boeing Company
- 3.1.2.2. Airbus Se
- 3.1.1. SUPPLIER OUTLOOK
- 3.2. Technology Overview
- 3.2.1. Lightweight Materials
- 3.2.2. Additive Manufacturing
- 3.3. Raw Material Trends
- 3.3.1. Philippines Raw Material Trends
- 3.4. Regulatory Framework
- 3.4.1. U.S. Federal Aviation Administration
- 3.4.1.1. Original Design Process
- 3.4.1.2. Original Design Approval Regulations & Policies
- 3.4.1.3. Parts Manufacturer Approval
- 3.4.2. Asia Pacific Regulatory Framework
- 3.4.2.1. China
- 3.4.2.1.1 China Civil Aviation Technical Standard Order
- 3.4.1. U.S. Federal Aviation Administration
- 3.5. Aerospace Parts Trade Statistics, By Key Countries, 2017 - 2021
- 3.5.1. U.S.
- 3.5.2. Canada
- 3.5.3. Mexico
- 3.5.4. Germany
- 3.5.5. Uk
- 3.5.6. France
- 3.5.7. Italy
- 3.5.8. The Netherlands
- 3.5.9. Indonesia
- 3.5.10. Malaysia
- 3.5.11. Philippines
- 3.5.12. China
- 3.5.13. Japan
- 3.5.14. India
- 3.5.15. Republic Of Korea
- 3.5.16. Australia
- 3.5.17. Saudi Arabia
- 3.5.18. United Arab Emirates (Uae)
- 3.5.19. Qatar
- 3.5.20. Brazil
- 3.6. Aerospace Parts Manufacturing Market - Market Dynamics
- 3.6.1. Market Driver Analysis
- 3.6.1.1. Rise In Passenger And Freight Traffic
- 3.6.1.2. Increase In Rate Of Aircraft Fleet Replacement
- 3.6.2. Market Restraint Analysis
- 3.6.2.1. Fluctuations In Raw Material Prices
- 3.6.3. Market Challenges
- 3.6.4. Market Opportunities
- 3.6.1. Market Driver Analysis
- 3.7. Business Environment Analysis: Aerospace Parts Manufacturing Market
- 3.7.1. Aerospace Parts Manufacturing Market - Porter's Analysis
- 3.7.2. Aerospace Parts Manufacturing Market: Pestel Analysis
- 3.8. Parts Manufacturing And Mro Growth Opportunities
- 3.8.1. Asia Pacific
- 3.8.2. Philippines
- 3.9. Aerospace Industry Analysis, By Country
- 3.9.1. Malaysia
- 3.9.2. Morocco
- 3.9.3. Mexico
Chapter 4. Aerospace Parts Manufacturing Market: Product Estimates & Trend Analysis
- 4.1. Key Takeaways
- 4.2. Product Movement Analysis & Market Share, 2023 & 2030
- 4.3. Aerospace Manufacturing Parts Market Estimates & Forecast, By Product (USD Billion), 2018 - 2030
- 4.4. Engines
- 4.5. Aircraft Manufacturing
- 4.6. Cabin Interiors
- 4.7. Equipment, System, & Support
- 4.8. Avionics
- 4.9. Insulation Components
Chapter 5. Aerospace Parts Manufacturing Market: Aircraft Estimates & Trend Analysis
- 5.1. Key Takeaways
- 5.2. Aircraft Movement Analysis & Market Share, 2023 & 2030
- 5.3. Aerospace Manufacturing Parts Market Estimates & Forecast, By Aircraft (USD Billion), 2018 - 2030
- 5.4. Commercial Aircraft
- 5.5. Business Aircraft
- 5.6. Military Aircraft
- 5.7. Others
Chapter 6. Aerospace Parts Manufacturing Market: Regional Estimates & Trend Analysis
- 6.1. Aerospace Parts Manufacturing Market: Regional Outlook
- 6.2. North America
- 6.2.1. North America Aerospace Parts Manufacturing Market Estimates And Forecasts, 2018 - 2030 (USD Billion)
- 6.2.2. U.S.
- 6.2.2.1. U.S. Aerospace Parts Manufacturing Market Estimates And Forecasts, 2018 - 2030 (USD Billion)
- 6.2.3. Canada
- 6.2.3.1. Canada Aerospace Parts Manufacturing Market Estimates And Forecasts, 2018 - 2030 (USD Billion)
- 6.2.4. Mexico
- 6.2.4.1. Mexico Aerospace Parts Manufacturing Market Estimates And Forecasts, 2018 - 2030 (USD Billion)
- 6.3. Europe
- 6.3.1. Europe Aerospace Parts Manufacturing Market Estimates And Forecasts, 2018 - 2030 (USD Billion)
- 6.3.2. Germany
- 6.3.2.1. Germany Aerospace Parts Manufacturing Market Estimates And Forecasts, 2018 - 2030 (USD Billion)
- 6.3.3. UK
- 6.3.3.1. Uk Aerospace Parts Manufacturing Market Estimates And Forecasts, 2018 - 2030 (USD Billion)
- 6.3.4. France
- 6.3.4.1. France Aerospace Parts Manufacturing Market Estimates And Forecasts, 2018 - 2030 (USD Billion)
- 6.3.5. Italy
- 6.3.5.1. Italy Aerospace Parts Manufacturing Market Estimates And Forecasts, 2018 - 2030 (USD Billion)
- 6.3.6. The Netherlands
- 6.3.6.1. The Netherlands Aerospace Parts Manufacturing Market Estimates And Forecasts, 2018 - 2030 (USD Billion)
- 6.4. Asia Pacific
- 6.4.1. Asia Pacific Aerospace Parts Manufacturing Market Estimates And Forecasts, 2018 - 2030 (USD Billion)
- 6.4.2. Indonesia
- 6.4.2.1. Indonesia Aerospace Parts Manufacturing Market Estimates And Forecasts, 2018 - 2030 (USD Billion)
- 6.4.3. Malaysia
- 6.4.3.1. Malaysia Aerospace Parts Manufacturing Market Estimates And Forecasts, 2018 - 2030 (USD Billion)
- 6.4.4. Philippines
- 6.4.4.1. Philippines Aerospace Parts Manufacturing Market Estimates And Forecasts, 2018 - 2030 (USD Billion)
- 6.4.5. China
- 6.4.5.1. China Aerospace Parts Manufacturing Market Estimates And Forecasts, 2018 - 2030 (USD Billion)
- 6.4.6. Japan
- 6.4.6.1. Japan Aerospace Parts Manufacturing Market Estimates And Forecasts, 2018 - 2030 (USD Billion)
- 6.4.7. Australia
- 6.4.7.1. Australia Aerospace Parts Manufacturing Market Estimates And Forecasts, 2018 - 2030 (USD Billion)
- 6.5. Central & South America
- 6.5.1. Central & South America Aerospace Parts Manufacturing Market Estimates And Forecasts, 2018 - 2030 (USD Billion)
- 6.5.2. Brazil
- 6.5.2.1. Brazil Aerospace Parts Manufacturing Market Estimates And Forecasts, 2018 - 2030 (USD Billion)
- 6.6. Middle East & Africa
- 6.6.1. Middle East & Africa Aerospace Parts Manufacturing Market Estimates And Forecasts, 2018 - 2030 (USD Billion)
Chapter 7. Aerospace Parts Manufacturing Market - Competitive Landscape
- 7.1. Company Market Share, 2023
- 7.1.1. Commercial Turbofan Engines Market Share - Company Market Share Analysis
- 7.2. Aerospace Parts Manufacturing Market: Distribution Landscape
- 7.3. Competitive Landscape
- 7.4. Strategy Framework
- 7.5. Company Listing
- 7.5.1. JAMCO Corporation
- 7.5.2. Intrex Aerospace
- 7.5.3. Rolls Royce plc
- 7.5.4. CAMAR Aircraft Parts Company
- 7.5.5. Safran Group
- 7.5.6. Woodward, Inc.
- 7.5.7. Engineered Propulsion System
- 7.5.8. Eaton Corporation plc
- 7.5.9. Aequs
- 7.5.10. Aero Engineering & Manufacturing Co.
- 7.5.11. GE Aviation
- 7.5.12. Lycoming Engines
- 7.5.13. Pratt & Whitney
- 7.5.14. Superior Air Parts Inc.
- 7.5.15. MTU Aero Engines AG
- 7.5.16. Honeywell International, Inc.
- 7.5.17. Collins Aerospace
- 7.5.18. Composite Technology Research Malaysia Sdn. Bhd.
- 7.5.19. Mitsubishi Heavy Industries Ltd.
- 7.5.20. Kawasaki Heavy Industries Ltd.
- 7.5.21. Subaru Corporation
- 7.5.22. IHI Corporation
- 7.5.23. Lufthansa Technik AG
- 7.5.24. Diel Aviation Holding GmbH
- 7.5.25. Elektro-Metall Export GmbH
- 7.5.26. Liebherr International AG
- 7.5.27. Hexcel Corporation
- 7.5.28. DuCommun Incorporated
- 7.5.29. Rockwell Collins
- 7.5.30. Spirit Aerosystems, Inc.
- 7.5.31. Panasonic Avionics Corporation
- 7.5.32. Zodiac Aerospace
- 7.5.33. Thales S.A.
- 7.5.34. Dassault Systems SE
- 7.5.35. Parker-Hannifin Corporation
- 7.5.36. Chemetall GmbH
- 7.5.37. Premium AEROTECH GmbH
- 7.5.38. Daher Group
- 7.5.39. FACC AG
- 7.5.40. Triumph Group
- 7.5.41. Curtiss-Wright Corporation
- 7.5.42. Stelia Aerospace
- 7.5.43. Magellan Aerospace
- 7.5.44. Bridgestone Corporation
