|
|
市場調査レポート
商品コード
1654196
アニマルヘルスの市場規模、シェア、動向分析レポート:製品別、動物の種類別、流通チャネル別、最終用途別、地域別、セグメント予測、2025年~2030年Animal Health Market Size, Share & Trends Analysis Report By Product (Biologics, Pharmaceuticals), By Animal Type (Companion, Production), By Distribution Channel, By End-use, By Region, And Segment Forecasts, 2025 - 2030 |
||||||
|
|||||||
カスタマイズ可能
|
|||||||

| アニマルヘルスの市場規模、シェア、動向分析レポート:製品別、動物の種類別、流通チャネル別、最終用途別、地域別、セグメント予測、2025年~2030年 |
|
出版日: 2025年01月15日
発行: Grand View Research
ページ情報: 英文 250 Pages
納期: 2~10営業日
|

全表示
- 概要
- 図表
- 目次
アニマルヘルス市場の成長と動向:
Grand View Research, Inc.の最新レポートによると、世界のアニマルヘルス市場規模は2030年までに1,123億3,000万米ドルに達し、2025年から2030年までのCAGRは10.46%を記録すると予測されています。
この市場を牽引しているのは、動物医療への投資の増加、製品の承認、診断率、主要企業による取り組み、動物医療支出の増加です。市場はまた、COVID-19パンデミックの間も主に回復力を維持しています。2023年11月、MSDアニマルヘルスは、クリプトスポリジウム・パルバム(C. parvum)感染から牛を守るワクチン「BOVILIS CRYPTIUM」の承認を欧州委員会から取得しました。これにより、MSDアニマルヘルス社は欧州連合(EU)全加盟国での製品化が可能になりました。
人獣共通感染症はダニやノミを介して、あるいは動物との接触によって広がる脅威が高いです。WHOは、ヒトと動物・生態系の接点における健康上の脅威に対処する目的で、さまざまな分野横断的な活動に取り組んでいます。食品媒介性人獣共通感染症、抗菌剤耐性、新興人獣共通感染症は、アニマルヘルス市場における脅威の一部です。また、MediLabSecureという実験室ネットワークプロジェクトが、地中海地域の19カ国で新興ウイルスや病原体を特定する目的で開始されました。様々な動物疾病の検出とモニタリングのための幅広い技術の導入は、主要な成長要因の一つです。
主要市場参入企業は、競争上の優位性を得るために、製品ポートフォリオの拡大など様々な戦略を採用しています。例えば、2021年1月、Zoetis社は伝染性滑液包病(IBD)を予防する家禽用ワクチンPoulvac Procerta HVT-IBDを発売しました。これによりZoetis社の組み換えベクターワクチンの製品ポートフォリオが拡充されました。2020年後半から2021年にかけて、特にコンパニオンアニマル・セグメント市場は、ペットの飼育率の上昇、ペットの人間化動向、ペットの親たちの意識の向上による診断薬事業全体の売上向上により、プラスの影響を受けました。しかし、2022年と2023年には、世界の景気後退やインフレといったマクロ経済の不確実性が、短期間ではありますが市場収益に顕著な影響を与えました。
アニマルヘルス市場レポートハイライト
- 製品別では、医薬品分野が2024年に約43.42%のシェアで市場を独占しました。動物用医薬品の一貫した進歩により、予測期間中も支配的な地位を維持すると予測されます。
- 2024年には、生産動物セグメントが市場を独占し、最大の収益シェアを占めました。この大幅なセグメントシェアは、エンドユーザーや政府ヘルスケア組織などの市場利害関係者の間で、食品の安全性と持続可能性に対する関心が高まっていることに起因しています。
- 病院/診療所薬局セグメントは、流通チャネルの面で2024年に最大の収益シェアを占めました。病院薬局の増加や手続き量の多さがこのセグメントの成長を支えています。
- 最終用途別では、動物病院・診療所セグメントが2024年の市場で最大の収益シェアを占めました。これは、世界中に多くの病院や診療所があり、これらのケアセンターでの患者の来院数が多いためです。
- 北米のアニマルヘルス市場は、2024年に約35.69%の最高シェアを占めました。この圧倒的なシェアは、家畜と人獣共通感染症の流行が高く、動物の大規模な死亡につながっていることに起因しています。
目次
第1章 調査手法と範囲
第2章 エグゼクティブサマリー
第3章 アニマルヘルス市場の変数、動向、範囲
- 市場力学
- 市場促進要因分析
- 市場抑制要因分析
- 市場機会分析
- 市場課題分析
- アニマルヘルス市場分析ツール
- ポーターの分析
- PESTEL分析
- 2023年の主な種と国別の動物の推定個体数
- COVID-19の影響分析
- 価格分析
- 主要国におけるペット所有者の人口統計
第4章 アニマルヘルス市場: 製品推定・動向分析
- セグメントダッシュボード
- アニマルヘルス市場:製品の変動分析、10億米ドル、2024年および2030年
- 生物学的製剤
- ワクチン
- その他の生物学的製剤
- 医薬品
- 寄生虫駆除剤
- 抗感染薬
- 抗炎症
- 鎮痛剤
- その他
- 診断
- 消耗品、試薬、キット
- 器具と装置
- 機器と消耗品
- クリティカルケア消耗品
- 麻酔機器
- 流体管理装置
- 温度管理機器
- 救助・蘇生機器
- 調査機器
- 患者モニタリング装置
- 医薬品飼料添加物
- その他の製品
- 獣医遠隔医療
- 獣医用ソフトウェア
- 家畜監視
第5章 アニマルヘルス市場: 流通チャネルの推定・動向分析
- セグメントダッシュボード
- アニマルヘルス市場:流通チャネルの変動分析、10億米ドル、2024年および2030年
- 小売り
- eコマース
- 病院・クリニック薬局
第6章 アニマルヘルス市場: 動物の種類別の推定・動向分析
- セグメントダッシュボード
- アニマルヘルス市場:動物の種類別の変動分析、10億米ドル、2024年および2030年
- 生産動物
- 家禽
- 豚
- 牛
- 羊とヤギ
- 魚
- ペット
- 犬
- 猫
- 馬
- その他
第7章 アニマルヘルス市場:最終用途の推定・動向分析
- セグメントダッシュボード
- アニマルヘルス市場:最終用途の変動分析、10億米ドル、2024年および2030年
- 獣医学参考研究所
- ポイントオブケア検査/院内検査
- 動物病院・クリニック
- その他
第8章 アニマルヘルス市場:地域推定・動向分析
- アニマルヘルス市場シェア、地域別、2024年および2030年
- 地域展望
- 北米
- 米国
- カナダ
- メキシコ
- 欧州
- 英国
- ドイツ
- フランス
- イタリア
- スペイン
- スウェーデン
- デンマーク
- ノルウェー
- ロシア
- オランダ
- スイス
- アイルランド
- ポーランド
- アジア太平洋
- 中国
- 日本
- インド
- 韓国
- オーストラリア
- タイ
- インドネシア
- フィリピン
- マレーシア
- シンガポール
- ラテンアメリカ
- ブラジル
- アルゼンチン
- 中東およびアフリカ
- サウジアラビア
- アラブ首長国連邦
- 南アフリカ
- クウェート
- トルコ
- イラン
- イスラエル
- エジプト
第9章 競合情勢
- 市場参入企業の分類
- 企業市況分析/ヒープマップ分析
- 企業プロファイル
- Zoetis
- Ceva Sante Animale
- Merck &Co., Inc.
- Vetoquinol SA
- Boehringer Ingelheim Gmbh
- Elanco
- Virbac
- Mars Inc.
- Dechra Pharmaceuticals Plc
- Idexx Laboratories, Inc.
- 戦略マッピング
- 合併と買収
- パートナーシップとコラボレーション
- その他
- List of Other Key Manufacturers
- List of Distributors by Region
List of Tables
- Table 1 List of secondary sources
- Table 2 Global Animal Health market, by region 2018 - 2030 (USD Million)
- Table 3 Global Animal Health market, by Animal Type 2018 - 2030 (USD Million)
- Table 4 Global Animal Health market, by Distribution Channel 2018 - 2030 (USD Million)
- Table 5 Global Animal Health market, by Product 2018 - 2030 (USD Million)
- Table 6 Global Animal Health market, by End Use 2018 - 2030 (USD Million)
- Table 7 Global Biologics market, by Type 2018 - 2030 (USD Million)
- Table 8 Global Vaccines market, by Type 2018 - 2030 (USD Million)
- Table 9 Global Pharmaceuticals market, by Type 2018 - 2030 (USD Million)
- Table 10 Global Diagnostics market, by Type 2018 - 2030 (USD Million)
- Table 11 Global Equipment & Disposables market, by Type 2018 - 2030 (USD Million)
- Table 12 Global Other Products market, by Type 2018 - 2030 (USD Million)
- Table 13 Global Production Animals market, by Type 2018 - 2030 (USD Million)
- Table 14 Global Companion Animals market, by Type 2018 - 2030 (USD Million)
- Table 15 North America Animal Health market, by country 2018 - 2030 (USD Million)
- Table 16 North America Animal Health market, by Animal Type 2018 - 2030 (USD Million)
- Table 17 North America Animal Health market, by Distribution Channel 2018 - 2030 (USD Million)
- Table 18 North America Animal Health market, by Product 2018 - 2030 (USD Million)
- Table 19 North America Animal Health market, by End Use 2018 - 2030 (USD Million)
- Table 20 North America Biologics market, by Type 2018 - 2030 (USD Million)
- Table 21 North America Vaccines market, by Type 2018 - 2030 (USD Million)
- Table 22 North America Pharmaceuticals market, by Type 2018 - 2030 (USD Million)
- Table 23 North America Diagnostics market, by Type 2018 - 2030 (USD Million)
- Table 24 North America Equipment & Disposables market, by Type 2018 - 2030 (USD Million)
- Table 25 North America Other Products market, by Type 2018 - 2030 (USD Million)
- Table 26 North America Production Animals market, by Type 2018 - 2030 (USD Million)
- Table 27 North America Companion Animals market, by Type 2018 - 2030 (USD Million)
- Table 28 U.S. Animal Health market, by Animal Type 2018 - 2030 (USD Million)
- Table 29 U.S. Animal Health market, by Distribution Channel 2018 - 2030 (USD Million)
- Table 30 U.S. Animal Health market, by Product 2018 - 2030 (USD Million)
- Table 31 U.S. Animal Health market, by End Use 2018 - 2030 (USD Million)
- Table 32 U.S. Biologics market, by Type 2018 - 2030 (USD Million)
- Table 33 U.S. Vaccines market, by Type 2018 - 2030 (USD Million)
- Table 34 U.S. Pharmaceuticals market, by Type 2018 - 2030 (USD Million)
- Table 35 U.S. Diagnostics market, by Type 2018 - 2030 (USD Million)
- Table 36 U.S. Equipment & Disposables market, by Type 2018 - 2030 (USD Million)
- Table 37 U.S. Other Products market, by Type 2018 - 2030 (USD Million)
- Table 38 U.S. Production Animals market, by Type 2018 - 2030 (USD Million)
- Table 39 U.S. Companion Animals market, by Type 2018 - 2030 (USD Million)
- Table 40 Canada Animal Health market, by Animal Type 2018 - 2030 (USD Million)
- Table 41 Canada Animal Health market, by Distribution Channel 2018 - 2030 (USD Million)
- Table 42 Canada Animal Health market, by Product 2018 - 2030 (USD Million)
- Table 43 Canada Animal Health market, by End Use 2018 - 2030 (USD Million)
- Table 44 Canada Biologics market, by Type 2018 - 2030 (USD Million)
- Table 45 Canada Vaccines market, by Type 2018 - 2030 (USD Million)
- Table 46 Canada Pharmaceuticals market, by Type 2018 - 2030 (USD Million)
- Table 47 Canada Diagnostics market, by Type 2018 - 2030 (USD Million)
- Table 48 Canada Equipment & Disposables market, by Type 2018 - 2030 (USD Million)
- Table 49 Canada Other Products market, by Type 2018 - 2030 (USD Million)
- Table 50 Canada Production Animals market, by Type 2018 - 2030 (USD Million)
- Table 51 Canada Companion Animals market, by Type 2018 - 2030 (USD Million)
- Table 52 Mexico Animal Health market, by Animal Type 2018 - 2030 (USD Million)
- Table 53 Mexico Animal Health market, by Distribution Channel 2018 - 2030 (USD Million)
- Table 54 Mexico Animal Health market, by Product 2018 - 2030 (USD Million)
- Table 55 Mexico Animal Health market, by End Use 2018 - 2030 (USD Million)
- Table 56 Mexico Biologics market, by Type 2018 - 2030 (USD Million)
- Table 57 Mexico Vaccines market, by Type 2018 - 2030 (USD Million)
- Table 58 Mexico Pharmaceuticals market, by Type 2018 - 2030 (USD Million)
- Table 59 Mexico Diagnostics market, by Type 2018 - 2030 (USD Million)
- Table 60 Mexico Equipment & Disposables market, by Type 2018 - 2030 (USD Million)
- Table 61 Mexico Other Products market, by Type 2018 - 2030 (USD Million)
- Table 62 Mexico Production Animals market, by Type 2018 - 2030 (USD Million)
- Table 63 Mexico Companion Animals market, by Type 2018 - 2030 (USD Million)
- Table 64 Europe Animal Health market, by country 2018 - 2030 (USD Million)
- Table 65 Europe Animal Health market, by Animal Type 2018 - 2030 (USD Million)
- Table 66 Europe Animal Health market, by Distribution Channel 2018 - 2030 (USD Million)
- Table 67 Europe Animal Health market, by Product 2018 - 2030 (USD Million)
- Table 68 Europe Animal Health market, by End Use 2018 - 2030 (USD Million)
- Table 69 Europe Biologics market, by Type 2018 - 2030 (USD Million)
- Table 70 Europe Vaccines market, by Type 2018 - 2030 (USD Million)
- Table 71 Europe Pharmaceuticals market, by Type 2018 - 2030 (USD Million)
- Table 72 Europe Diagnostics market, by Type 2018 - 2030 (USD Million)
- Table 73 Europe Equipment & Disposables market, by Type 2018 - 2030 (USD Million)
- Table 74 Europe Other Products market, by Type 2018 - 2030 (USD Million)
- Table 75 Europe Production Animals market, by Type 2018 - 2030 (USD Million)
- Table 76 Europe Companion Animals market, by Type 2018 - 2030 (USD Million)
- Table 77 Germany Animal Health market, by Animal Type 2018 - 2030 (USD Million)
- Table 78 Germany Animal Health market, by Distribution Channel 2018 - 2030 (USD Million)
- Table 79 Germany Animal Health market, by Product 2018 - 2030 (USD Million)
- Table 80 Germany Animal Health market, by End Use 2018 - 2030 (USD Million)
- Table 81 Germany Biologics market, by Type 2018 - 2030 (USD Million)
- Table 82 Germany Vaccines market, by Type 2018 - 2030 (USD Million)
- Table 83 Germany Pharmaceuticals market, by Type 2018 - 2030 (USD Million)
- Table 84 Germany Diagnostics market, by Type 2018 - 2030 (USD Million)
- Table 85 Germany Equipment & Disposables market, by Type 2018 - 2030 (USD Million)
- Table 86 Germany Other Products market, by Type 2018 - 2030 (USD Million)
- Table 87 Germany Production Animals market, by Type 2018 - 2030 (USD Million)
- Table 88 Germany Companion Animals market, by Type 2018 - 2030 (USD Million)
- Table 89 UK Animal Health market, by Animal Type 2018 - 2030 (USD Million)
- Table 90 UK Animal Health market, by Distribution Channel 2018 - 2030 (USD Million)
- Table 91 UK Animal Health market, by Product 2018 - 2030 (USD Million)
- Table 92 UK Animal Health market, by End Use 2018 - 2030 (USD Million)
- Table 93 UK Biologics market, by Type 2018 - 2030 (USD Million)
- Table 94 UK Vaccines market, by Type 2018 - 2030 (USD Million)
- Table 95 UK Pharmaceuticals market, by Type 2018 - 2030 (USD Million)
- Table 96 UK Diagnostics market, by Type 2018 - 2030 (USD Million)
- Table 97 UK Equipment & Disposables market, by Type 2018 - 2030 (USD Million)
- Table 98 UK Other Products market, by Type 2018 - 2030 (USD Million)
- Table 99 UK Production Animals market, by Type 2018 - 2030 (USD Million)
- Table 100 UK Companion Animals market, by Type 2018 - 2030 (USD Million)
- Table 101 France Animal Health market, by Animal Type 2018 - 2030 (USD Million)
- Table 102 France Animal Health market, by Distribution Channel 2018 - 2030 (USD Million)
- Table 103 France Animal Health market, by Product 2018 - 2030 (USD Million)
- Table 104 France Animal Health market, by End Use 2018 - 2030 (USD Million)
- Table 105 France Biologics market, by Type 2018 - 2030 (USD Million)
- Table 106 France Vaccines market, by Type 2018 - 2030 (USD Million)
- Table 107 France Pharmaceuticals market, by Type 2018 - 2030 (USD Million)
- Table 108 France Diagnostics market, by Type 2018 - 2030 (USD Million)
- Table 109 France Equipment & Disposables market, by Type 2018 - 2030 (USD Million)
- Table 110 France Other Products market, by Type 2018 - 2030 (USD Million)
- Table 111 France Production Animals market, by Type 2018 - 2030 (USD Million)
- Table 112 France Companion Animals market, by Type 2018 - 2030 (USD Million)
- Table 113 Italy Animal Health market, by Animal Type 2018 - 2030 (USD Million)
- Table 114 Italy Animal Health market, by Distribution Channel 2018 - 2030 (USD Million)
- Table 115 Italy Animal Health market, by Product 2018 - 2030 (USD Million)
- Table 116 Italy Animal Health market, by End Use 2018 - 2030 (USD Million)
- Table 117 Italy Biologics market, by Type 2018 - 2030 (USD Million)
- Table 118 Italy Vaccines market, by Type 2018 - 2030 (USD Million)
- Table 119 Italy Pharmaceuticals market, by Type 2018 - 2030 (USD Million)
- Table 120 Italy Diagnostics market, by Type 2018 - 2030 (USD Million)
- Table 121 Italy Equipment & Disposables market, by Type 2018 - 2030 (USD Million)
- Table 122 Italy Other Products market, by Type 2018 - 2030 (USD Million)
- Table 123 Italy Production Animals market, by Type 2018 - 2030 (USD Million)
- Table 124 Italy Companion Animals market, by Type 2018 - 2030 (USD Million)
- Table 125 Spain Animal Health market, by Animal Type 2018 - 2030 (USD Million)
- Table 126 Spain Animal Health market, by Distribution Channel 2018 - 2030 (USD Million)
- Table 127 Spain Animal Health market, by Product 2018 - 2030 (USD Million)
- Table 128 Spain Animal Health market, by End Use 2018 - 2030 (USD Million)
- Table 129 Spain Biologics market, by Type 2018 - 2030 (USD Million)
- Table 130 Spain Vaccines market, by Type 2018 - 2030 (USD Million)
- Table 131 Spain Pharmaceuticals market, by Type 2018 - 2030 (USD Million)
- Table 132 Spain Diagnostics market, by Type 2018 - 2030 (USD Million)
- Table 133 Spain Equipment & Disposables market, by Type 2018 - 2030 (USD Million)
- Table 134 Spain Other Products market, by Type 2018 - 2030 (USD Million)
- Table 135 Spain Production Animals market, by Type 2018 - 2030 (USD Million)
- Table 136 Spain Companion Animals market, by Type 2018 - 2030 (USD Million)
- Table 137 Denmark Animal Health market, by Animal Type 2018 - 2030 (USD Million)
- Table 138 Denmark Animal Health market, by Distribution Channel 2018 - 2030 (USD Million)
- Table 139 Denmark Animal Health market, by Product 2018 - 2030 (USD Million)
- Table 140 Denmark Animal Health market, by End Use 2018 - 2030 (USD Million)
- Table 141 Denmark Biologics market, by Type 2018 - 2030 (USD Million)
- Table 142 Denmark Vaccines market, by Type 2018 - 2030 (USD Million)
- Table 143 Denmark Pharmaceuticals market, by Type 2018 - 2030 (USD Million)
- Table 144 Denmark Diagnostics market, by Type 2018 - 2030 (USD Million)
- Table 145 Denmark Equipment & Disposables market, by Type 2018 - 2030 (USD Million)
- Table 146 Denmark Other Products market, by Type 2018 - 2030 (USD Million)
- Table 147 Denmark Production Animals market, by Type 2018 - 2030 (USD Million)
- Table 148 Denmark Companion Animals market, by Type 2018 - 2030 (USD Million)
- Table 149 Sweden Animal Health market, by Animal Type 2018 - 2030 (USD Million)
- Table 150 Sweden Animal Health market, by Distribution Channel 2018 - 2030 (USD Million)
- Table 151 Sweden Animal Health market, by Product 2018 - 2030 (USD Million)
- Table 152 Sweden Animal Health market, by End Use 2018 - 2030 (USD Million)
- Table 153 Sweden Biologics market, by Type 2018 - 2030 (USD Million)
- Table 154 Sweden Vaccines market, by Type 2018 - 2030 (USD Million)
- Table 155 Sweden Pharmaceuticals market, by Type 2018 - 2030 (USD Million)
- Table 156 Sweden Diagnostics market, by Type 2018 - 2030 (USD Million)
- Table 157 Sweden Equipment & Disposables market, by Type 2018 - 2030 (USD Million)
- Table 158 Sweden Other Products market, by Type 2018 - 2030 (USD Million)
- Table 159 Sweden Production Animals market, by Type 2018 - 2030 (USD Million)
- Table 160 Sweden Companion Animals market, by Type 2018 - 2030 (USD Million)
- Table 161 Norway Animal Health market, by Animal Type 2018 - 2030 (USD Million)
- Table 162 Norway Animal Health market, by Distribution Channel 2018 - 2030 (USD Million)
- Table 163 Norway Animal Health market, by Product 2018 - 2030 (USD Million)
- Table 164 Norway Animal Health market, by End Use 2018 - 2030 (USD Million)
- Table 165 Norway Biologics market, by Type 2018 - 2030 (USD Million)
- Table 166 Norway Vaccines market, by Type 2018 - 2030 (USD Million)
- Table 167 Norway Pharmaceuticals market, by Type 2018 - 2030 (USD Million)
- Table 168 Norway Diagnostics market, by Type 2018 - 2030 (USD Million)
- Table 169 Norway Equipment & Disposables market, by Type 2018 - 2030 (USD Million)
- Table 170 Norway Other Products market, by Type 2018 - 2030 (USD Million)
- Table 171 Norway Production Animals market, by Type 2018 - 2030 (USD Million)
- Table 172 Norway Companion Animals market, by Type 2018 - 2030 (USD Million)
- Table 173 Russia Animal Health market, by Animal Type 2018 - 2030 (USD Million)
- Table 174 Russia Animal Health market, by Distribution Channel 2018 - 2030 (USD Million)
- Table 175 Russia Animal Health market, by Product 2018 - 2030 (USD Million)
- Table 176 Russia Animal Health market, by End Use 2018 - 2030 (USD Million)
- Table 177 Russia Biologics market, by Type 2018 - 2030 (USD Million)
- Table 178 Russia Vaccines market, by Type 2018 - 2030 (USD Million)
- Table 179 Russia Pharmaceuticals market, by Type 2018 - 2030 (USD Million)
- Table 180 Russia Diagnostics market, by Type 2018 - 2030 (USD Million)
- Table 181 Russia Equipment & Disposables market, by Type 2018 - 2030 (USD Million)
- Table 182 Russia Other Products market, by Type 2018 - 2030 (USD Million)
- Table 183 Russia Production Animals market, by Type 2018 - 2030 (USD Million)
- Table 184 Russia Companion Animals market, by Type 2018 - 2030 (USD Million)
- Table 185 Netherlands Animal Health market, by Animal Type 2018 - 2030 (USD Million)
- Table 186 Netherlands Animal Health market, by Distribution Channel 2018 - 2030 (USD Million)
- Table 187 Netherlands Animal Health market, by Product 2018 - 2030 (USD Million)
- Table 188 Netherlands Animal Health market, by End Use 2018 - 2030 (USD Million)
- Table 189 Netherlands Biologics market, by Type 2018 - 2030 (USD Million)
- Table 190 Netherlands Vaccines market, by Type 2018 - 2030 (USD Million)
- Table 191 Netherlands Pharmaceuticals market, by Type 2018 - 2030 (USD Million)
- Table 192 Netherlands Diagnostics market, by Type 2018 - 2030 (USD Million)
- Table 193 Netherlands Equipment & Disposables market, by Type 2018 - 2030 (USD Million)
- Table 194 Netherlands Other Products market, by Type 2018 - 2030 (USD Million)
- Table 195 Netherlands Production Animals market, by Type 2018 - 2030 (USD Million)
- Table 196 Netherlands Companion Animals market, by Type 2018 - 2030 (USD Million)
- Table 197 Switzerland Animal Health market, by Animal Type 2018 - 2030 (USD Million)
- Table 198 Switzerland Animal Health market, by Distribution Channel 2018 - 2030 (USD Million)
- Table 199 Switzerland Animal Health market, by Product 2018 - 2030 (USD Million)
- Table 200 Switzerland Animal Health market, by End Use 2018 - 2030 (USD Million)
- Table 201 Switzerland Biologics market, by Type 2018 - 2030 (USD Million)
- Table 202 Switzerland Vaccines market, by Type 2018 - 2030 (USD Million)
- Table 203 Switzerland Pharmaceuticals market, by Type 2018 - 2030 (USD Million)
- Table 204 Switzerland Diagnostics market, by Type 2018 - 2030 (USD Million)
- Table 205 Switzerland Equipment & Disposables market, by Type 2018 - 2030 (USD Million)
- Table 206 Switzerland Other Products market, by Type 2018 - 2030 (USD Million)
- Table 207 Switzerland Production Animals market, by Type 2018 - 2030 (USD Million)
- Table 208 Switzerland Companion Animals market, by Type 2018 - 2030 (USD Million)
- Table 209 Ireland Animal Health market, by Animal Type 2018 - 2030 (USD Million)
- Table 210 Ireland Animal Health market, by Distribution Channel 2018 - 2030 (USD Million)
- Table 211 Ireland Animal Health market, by Product 2018 - 2030 (USD Million)
- Table 212 Ireland Animal Health market, by End Use 2018 - 2030 (USD Million)
- Table 213 Ireland Biologics market, by Type 2018 - 2030 (USD Million)
- Table 214 Ireland Vaccines market, by Type 2018 - 2030 (USD Million)
- Table 215 Ireland Pharmaceuticals market, by Type 2018 - 2030 (USD Million)
- Table 216 Ireland Diagnostics market, by Type 2018 - 2030 (USD Million)
- Table 217 Ireland Equipment & Disposables market, by Type 2018 - 2030 (USD Million)
- Table 218 Ireland Other Products market, by Type 2018 - 2030 (USD Million)
- Table 219 Ireland Production Animals market, by Type 2018 - 2030 (USD Million)
- Table 220 Ireland Companion Animals market, by Type 2018 - 2030 (USD Million)
- Table 221 Poland Animal Health market, by Animal Type 2018 - 2030 (USD Million)
- Table 222 Poland Animal Health market, by Distribution Channel 2018 - 2030 (USD Million)
- Table 223 Poland Animal Health market, by Product 2018 - 2030 (USD Million)
- Table 224 Poland Animal Health market, by End Use 2018 - 2030 (USD Million)
- Table 225 Poland Biologics market, by Type 2018 - 2030 (USD Million)
- Table 226 Poland Vaccines market, by Type 2018 - 2030 (USD Million)
- Table 227 Poland Pharmaceuticals market, by Type 2018 - 2030 (USD Million)
- Table 228 Poland Diagnostics market, by Type 2018 - 2030 (USD Million)
- Table 229 Poland Equipment & Disposables market, by Type 2018 - 2030 (USD Million)
- Table 230 Poland Other Products market, by Type 2018 - 2030 (USD Million)
- Table 231 Poland Production Animals market, by Type 2018 - 2030 (USD Million)
- Table 232 Poland Companion Animals market, by Type 2018 - 2030 (USD Million)
- Table 233 Asia Pacific Animal Health market, by country 2018 - 2030 (USD Million)
- Table 234 Asia Pacific Animal Health market, by Animal Type 2018 - 2030 (USD Million)
- Table 235 Asia Pacific Animal Health market, by Distribution Channel 2018 - 2030 (USD Million)
- Table 236 Asia Pacific Animal Health market, by Product 2018 - 2030 (USD Million)
- Table 237 Asia Pacific Animal Health market, by End Use 2018 - 2030 (USD Million)
- Table 238 Asia Pacific Biologics market, by Type 2018 - 2030 (USD Million)
- Table 239 Asia Pacific Vaccines market, by Type 2018 - 2030 (USD Million)
- Table 240 Asia Pacific Pharmaceuticals market, by Type 2018 - 2030 (USD Million)
- Table 241 Asia Pacific Diagnostics market, by Type 2018 - 2030 (USD Million)
- Table 242 Asia Pacific Equipment & Disposables market, by Type 2018 - 2030 (USD Million)
- Table 243 Asia Pacific Other Products market, by Type 2018 - 2030 (USD Million)
- Table 244 Asia Pacific Production Animals market, by Type 2018 - 2030 (USD Million)
- Table 245 Asia Pacific Companion Animals market, by Type 2018 - 2030 (USD Million)
- Table 246 China Animal Health market, by Animal Type 2018 - 2030 (USD Million)
- Table 247 China Animal Health market, by Distribution Channel 2018 - 2030 (USD Million)
- Table 248 China Animal Health market, by Product 2018 - 2030 (USD Million)
- Table 249 China Animal Health market, by End Use 2018 - 2030 (USD Million)
- Table 250 China Biologics market, by Type 2018 - 2030 (USD Million)
- Table 251 China Vaccines market, by Type 2018 - 2030 (USD Million)
- Table 252 China Pharmaceuticals market, by Type 2018 - 2030 (USD Million)
- Table 253 China Diagnostics market, by Type 2018 - 2030 (USD Million)
- Table 254 China Equipment & Disposables market, by Type 2018 - 2030 (USD Million)
- Table 255 China Other Products market, by Type 2018 - 2030 (USD Million)
- Table 256 China Production Animals market, by Type 2018 - 2030 (USD Million)
- Table 257 China Companion Animals market, by Type 2018 - 2030 (USD Million)
- Table 258 Japan Animal Health market, by Animal Type 2018 - 2030 (USD Million)
- Table 259 Japan Animal Health market, by Distribution Channel 2018 - 2030 (USD Million)
- Table 260 Japan Animal Health market, by Product 2018 - 2030 (USD Million)
- Table 261 Japan Animal Health market, by End Use 2018 - 2030 (USD Million)
- Table 262 Japan Biologics market, by Type 2018 - 2030 (USD Million)
- Table 263 Japan Vaccines market, by Type 2018 - 2030 (USD Million)
- Table 264 Japan Pharmaceuticals market, by Type 2018 - 2030 (USD Million)
- Table 265 Japan Diagnostics market, by Type 2018 - 2030 (USD Million)
- Table 266 Japan Equipment & Disposables market, by Type 2018 - 2030 (USD Million)
- Table 267 Japan Other Products market, by Type 2018 - 2030 (USD Million)
- Table 268 Japan Production Animals market, by Type 2018 - 2030 (USD Million)
- Table 269 Japan Companion Animals market, by Type 2018 - 2030 (USD Million)
- Table 270 India Animal Health market, by Animal Type 2018 - 2030 (USD Million)
- Table 271 India Animal Health market, by Distribution Channel 2018 - 2030 (USD Million)
- Table 272 India Animal Health market, by Product 2018 - 2030 (USD Million)
- Table 273 India Animal Health market, by End Use 2018 - 2030 (USD Million)
- Table 274 India Biologics market, by Type 2018 - 2030 (USD Million)
- Table 275 India Vaccines market, by Type 2018 - 2030 (USD Million)
- Table 276 India Pharmaceuticals market, by Type 2018 - 2030 (USD Million)
- Table 277 India Diagnostics market, by Type 2018 - 2030 (USD Million)
- Table 278 India Equipment & Disposables market, by Type 2018 - 2030 (USD Million)
- Table 279 India Other Products market, by Type 2018 - 2030 (USD Million)
- Table 280 India Production Animals market, by Type 2018 - 2030 (USD Million)
- Table 281 India Companion Animals market, by Type 2018 - 2030 (USD Million)
- Table 282 South Korea Animal Health market, by Animal Type 2018 - 2030 (USD Million)
- Table 283 South Korea Animal Health market, by Distribution Channel 2018 - 2030 (USD Million)
- Table 284 South Korea Animal Health market, by Product 2018 - 2030 (USD Million)
- Table 285 South Korea Animal Health market, by End Use 2018 - 2030 (USD Million)
- Table 286 South Korea Biologics market, by Type 2018 - 2030 (USD Million)
- Table 287 South Korea Vaccines market, by Type 2018 - 2030 (USD Million)
- Table 288 South Korea Pharmaceuticals market, by Type 2018 - 2030 (USD Million)
- Table 289 South Korea Diagnostics market, by Type 2018 - 2030 (USD Million)
- Table 290 South Korea Equipment & Disposables market, by Type 2018 - 2030 (USD Million)
- Table 291 South Korea Other Products market, by Type 2018 - 2030 (USD Million)
- Table 292 South Korea Production Animals market, by Type 2018 - 2030 (USD Million)
- Table 293 South Korea Companion Animals market, by Type 2018 - 2030 (USD Million)
- Table 294 Australia Animal Health market, by Animal Type 2018 - 2030 (USD Million)
- Table 295 Australia Animal Health market, by Distribution Channel 2018 - 2030 (USD Million)
- Table 296 Australia Animal Health market, by Product 2018 - 2030 (USD Million)
- Table 297 Australia Animal Health market, by End Use 2018 - 2030 (USD Million)
- Table 298 Australia Biologics market, by Type 2018 - 2030 (USD Million)
- Table 299 Australia Vaccines market, by Type 2018 - 2030 (USD Million)
- Table 300 Australia Pharmaceuticals market, by Type 2018 - 2030 (USD Million)
- Table 301 Australia Diagnostics market, by Type 2018 - 2030 (USD Million)
- Table 302 Australia Equipment & Disposables market, by Type 2018 - 2030 (USD Million)
- Table 303 Australia Other Products market, by Type 2018 - 2030 (USD Million)
- Table 304 Australia Production Animals market, by Type 2018 - 2030 (USD Million)
- Table 305 Australia Companion Animals market, by Type 2018 - 2030 (USD Million)
- Table 306 Thailand Animal Health market, by Animal Type 2018 - 2030 (USD Million)
- Table 307 Thailand Animal Health market, by Distribution Channel 2018 - 2030 (USD Million)
- Table 308 Thailand Animal Health market, by Product 2018 - 2030 (USD Million)
- Table 309 Thailand Animal Health market, by End Use 2018 - 2030 (USD Million)
- Table 310 Thailand Biologics market, by Type 2018 - 2030 (USD Million)
- Table 311 Thailand Vaccines market, by Type 2018 - 2030 (USD Million)
- Table 312 Thailand Pharmaceuticals market, by Type 2018 - 2030 (USD Million)
- Table 313 Thailand Diagnostics market, by Type 2018 - 2030 (USD Million)
- Table 314 Thailand Equipment & Disposables market, by Type 2018 - 2030 (USD Million)
- Table 315 Thailand Other Products market, by Type 2018 - 2030 (USD Million)
- Table 316 Thailand Production Animals market, by Type 2018 - 2030 (USD Million)
- Table 317 Thailand Companion Animals market, by Type 2018 - 2030 (USD Million)
- Table 318 Indonesia Animal Health market, by Animal Type 2018 - 2030 (USD Million)
- Table 319 Indonesia Animal Health market, by Distribution Channel 2018 - 2030 (USD Million)
- Table 320 Indonesia Animal Health market, by Product 2018 - 2030 (USD Million)
- Table 321 Indonesia Animal Health market, by End Use 2018 - 2030 (USD Million)
- Table 322 Indonesia Biologics market, by Type 2018 - 2030 (USD Million)
- Table 323 Indonesia Vaccines market, by Type 2018 - 2030 (USD Million)
- Table 324 Indonesia Pharmaceuticals market, by Type 2018 - 2030 (USD Million)
- Table 325 Indonesia Diagnostics market, by Type 2018 - 2030 (USD Million)
- Table 326 Indonesia Equipment & Disposables market, by Type 2018 - 2030 (USD Million)
- Table 327 Indonesia Other Products market, by Type 2018 - 2030 (USD Million)
- Table 328 Indonesia Production Animals market, by Type 2018 - 2030 (USD Million)
- Table 329 Indonesia Companion Animals market, by Type 2018 - 2030 (USD Million)
- Table 330 Philippines Animal Health market, by Animal Type 2018 - 2030 (USD Million)
- Table 331 Philippines Animal Health market, by Distribution Channel 2018 - 2030 (USD Million)
- Table 332 Philippines Animal Health market, by Product 2018 - 2030 (USD Million)
- Table 333 Philippines Animal Health market, by End Use 2018 - 2030 (USD Million)
- Table 334 Philippines Biologics market, by Type 2018 - 2030 (USD Million)
- Table 335 Philippines Vaccines market, by Type 2018 - 2030 (USD Million)
- Table 336 Philippines Pharmaceuticals market, by Type 2018 - 2030 (USD Million)
- Table 337 Philippines Diagnostics market, by Type 2018 - 2030 (USD Million)
- Table 338 Philippines Equipment & Disposables market, by Type 2018 - 2030 (USD Million)
- Table 339 Philippines Other Products market, by Type 2018 - 2030 (USD Million)
- Table 340 Philippines Production Animals market, by Type 2018 - 2030 (USD Million)
- Table 341 Philippines Companion Animals market, by Type 2018 - 2030 (USD Million)
- Table 342 Malaysia Animal Health market, by Animal Type 2018 - 2030 (USD Million)
- Table 343 Malaysia Animal Health market, by Distribution Channel 2018 - 2030 (USD Million)
- Table 344 Malaysia Animal Health market, by Product 2018 - 2030 (USD Million)
- Table 345 Malaysia Animal Health market, by End Use 2018 - 2030 (USD Million)
- Table 346 Malaysia Biologics market, by Type 2018 - 2030 (USD Million)
- Table 347 Malaysia Vaccines market, by Type 2018 - 2030 (USD Million)
- Table 348 Malaysia Pharmaceuticals market, by Type 2018 - 2030 (USD Million)
- Table 349 Malaysia Diagnostics market, by Type 2018 - 2030 (USD Million)
- Table 350 Malaysia Equipment & Disposables market, by Type 2018 - 2030 (USD Million)
- Table 351 Malaysia Other Products market, by Type 2018 - 2030 (USD Million)
- Table 352 Malaysia Production Animals market, by Type 2018 - 2030 (USD Million)
- Table 353 Malaysia Companion Animals market, by Type 2018 - 2030 (USD Million)
- Table 354 Singapore Animal Health market, by Animal Type 2018 - 2030 (USD Million)
- Table 355 Singapore Animal Health market, by Distribution Channel 2018 - 2030 (USD Million)
- Table 356 Singapore Animal Health market, by Product 2018 - 2030 (USD Million)
- Table 357 Singapore Animal Health market, by End Use 2018 - 2030 (USD Million)
- Table 358 Singapore Biologics market, by Type 2018 - 2030 (USD Million)
- Table 359 Singapore Vaccines market, by Type 2018 - 2030 (USD Million)
- Table 360 Singapore Pharmaceuticals market, by Type 2018 - 2030 (USD Million)
- Table 361 Singapore Diagnostics market, by Type 2018 - 2030 (USD Million)
- Table 362 Singapore Equipment & Disposables market, by Type 2018 - 2030 (USD Million)
- Table 363 Singapore Other Products market, by Type 2018 - 2030 (USD Million)
- Table 364 Singapore Production Animals market, by Type 2018 - 2030 (USD Million)
- Table 365 Singapore Companion Animals market, by Type 2018 - 2030 (USD Million)
- Table 366 Latin America Animal Health market, by country 2018 - 2030 (USD Million)
- Table 367 Latin America Animal Health market, by Animal Type 2018 - 2030 (USD Million)
- Table 368 Latin America Animal Health market, by Distribution Channel 2018 - 2030 (USD Million)
- Table 369 Latin America Animal Health market, by Product 2018 - 2030 (USD Million)
- Table 370 Latin America Animal Health market, by End Use 2018 - 2030 (USD Million)
- Table 371 Latin America Biologics market, by Type 2018 - 2030 (USD Million)
- Table 372 Latin America Vaccines market, by Type 2018 - 2030 (USD Million)
- Table 373 Latin America Pharmaceuticals market, by Type 2018 - 2030 (USD Million)
- Table 374 Latin America Diagnostics market, by Type 2018 - 2030 (USD Million)
- Table 375 Latin America Equipment & Disposables market, by Type 2018 - 2030 (USD Million)
- Table 376 Latin America Other Products market, by Type 2018 - 2030 (USD Million)
- Table 377 Latin America Production Animals market, by Type 2018 - 2030 (USD Million)
- Table 378 Latin America Companion Animals market, by Type 2018 - 2030 (USD Million)
- Table 379 Brazil Animal Health market, by Animal Type 2018 - 2030 (USD Million)
- Table 380 Brazil Animal Health market, by Distribution Channel 2018 - 2030 (USD Million)
- Table 381 Brazil Animal Health market, by Product 2018 - 2030 (USD Million)
- Table 382 Brazil Animal Health market, by End Use 2018 - 2030 (USD Million)
- Table 383 Brazil Biologics market, by Type 2018 - 2030 (USD Million)
- Table 384 Brazil Vaccines market, by Type 2018 - 2030 (USD Million)
- Table 385 Brazil Pharmaceuticals market, by Type 2018 - 2030 (USD Million)
- Table 386 Brazil Diagnostics market, by Type 2018 - 2030 (USD Million)
- Table 387 Brazil Equipment & Disposables market, by Type 2018 - 2030 (USD Million)
- Table 388 Brazil Other Products market, by Type 2018 - 2030 (USD Million)
- Table 389 Brazil Production Animals market, by Type 2018 - 2030 (USD Million)
- Table 390 Brazil Companion Animals market, by Type 2018 - 2030 (USD Million)
- Table 391 Argentina Animal Health market, by Animal Type 2018 - 2030 (USD Million)
- Table 392 Argentina Animal Health market, by Distribution Channel 2018 - 2030 (USD Million)
- Table 393 Argentina Animal Health market, by Product 2018 - 2030 (USD Million)
- Table 394 Argentina Animal Health market, by End Use 2018 - 2030 (USD Million)
- Table 395 Argentina Biologics market, by Type 2018 - 2030 (USD Million)
- Table 396 Argentina Vaccines market, by Type 2018 - 2030 (USD Million)
- Table 397 Argentina Pharmaceuticals market, by Type 2018 - 2030 (USD Million)
- Table 398 Argentina Diagnostics market, by Type 2018 - 2030 (USD Million)
- Table 399 Argentina Equipment & Disposables market, by Type 2018 - 2030 (USD Million)
- Table 400 Argentina Other Products market, by Type 2018 - 2030 (USD Million)
- Table 401 Argentina Production Animals market, by Type 2018 - 2030 (USD Million)
- Table 402 Argentina Companion Animals market, by Type 2018 - 2030 (USD Million)
- Table 403 MEA Animal Health market, by country 2018 - 2030 (USD Million)
- Table 404 MEA Animal Health market, by Animal Type 2018 - 2030 (USD Million)
- Table 405 MEA Animal Health market, by Distribution Channel 2018 - 2030 (USD Million)
- Table 406 MEA Animal Health market, by Product 2018 - 2030 (USD Million)
- Table 407 MEA Animal Health market, by End Use 2018 - 2030 (USD Million)
- Table 408 MEA Biologics market, by Type 2018 - 2030 (USD Million)
- Table 409 MEA Vaccines market, by Type 2018 - 2030 (USD Million)
- Table 410 MEA Pharmaceuticals market, by Type 2018 - 2030 (USD Million)
- Table 411 MEA Diagnostics market, by Type 2018 - 2030 (USD Million)
- Table 412 MEA Equipment & Disposables market, by Type 2018 - 2030 (USD Million)
- Table 413 MEA Other Products market, by Type 2018 - 2030 (USD Million)
- Table 414 MEA Production Animals market, by Type 2018 - 2030 (USD Million)
- Table 415 MEA Companion Animals market, by Type 2018 - 2030 (USD Million)
- Table 416 South Africa Animal Health market, by Animal Type 2018 - 2030 (USD Million)
- Table 417 South Africa Animal Health market, by Distribution Channel 2018 - 2030 (USD Million)
- Table 418 South Africa Animal Health market, by Product 2018 - 2030 (USD Million)
- Table 419 South Africa Animal Health market, by End Use 2018 - 2030 (USD Million)
- Table 420 South Africa Biologics market, by Type 2018 - 2030 (USD Million)
- Table 421 South Africa Vaccines market, by Type 2018 - 2030 (USD Million)
- Table 422 South Africa Pharmaceuticals market, by Type 2018 - 2030 (USD Million)
- Table 423 South Africa Diagnostics market, by Type 2018 - 2030 (USD Million)
List of Figures
- Fig. 1 Market segmentation
- Fig. 2 Market research process
- Fig. 3 Information procurement
- Fig. 4 Market research approaches
- Fig. 5 Value chain-based sizing & forecasting
- Fig. 6 QFD modelling for market share assessment
- Fig. 7 Market formulation & validation
- Fig. 8 Commodity Flow Analysis
- Fig. 9 Animal Health market outlook
- Fig. 10 Animal Health market snapshot
- Fig. 11 Animal Health market driver impact
- Fig. 12 Animal Health market restraint impact
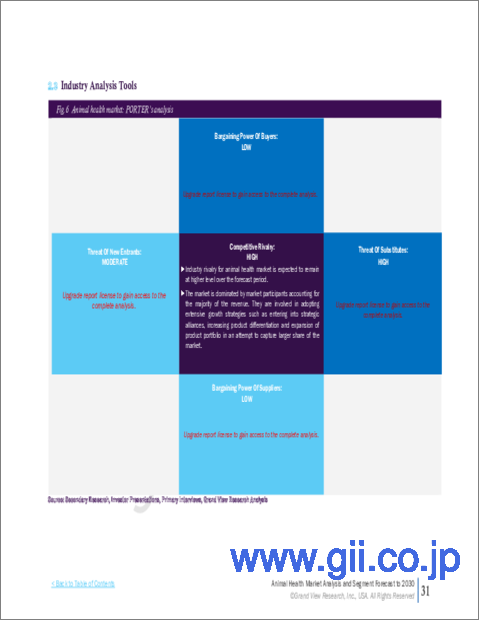
- Fig. 13 Porter's 5 Forces Analysis
- Fig. 14 PESTEL Analysis
- Fig. 15 Animal Health market animal type key takeaways (USD Million)
- Fig. 16 Animal Health market: animal type movement & market share analysis, 2024 & 2030
- Fig. 17 Global Production Animals market, 2018 - 2030 (USD Million)
- Fig. 18 Global Poultry market, 2018 - 2030 (USD Million)
- Fig. 19 Global Swine market, 2018 - 2030 (USD Million)
- Fig. 20 Global Cattle market, 2018 - 2030 (USD Million)
- Fig. 21 Global Sheep & Goats market, 2018 - 2030 (USD Million)
- Fig. 22 Global Fish market, 2018 - 2030 (USD Million)
- Fig. 23 Global Companion Animals market, 2018 - 2030 (USD Million)
- Fig. 24 Global Dogs market, 2018 - 2030 (USD Million)
- Fig. 25 Global Cats market, 2018 - 2030 (USD Million)
- Fig. 26 Global Horses market, 2018 - 2030 (USD Million)
- Fig. 27 Global Others market, 2018 - 2030 (USD Million)
- Fig. 28 Animal Health Distribution Channel key takeaways (USD Million)
- Fig. 29 Animal Health market: Distribution Channel movement & market share analysis, 2024 & 2030
- Fig. 30 Global Retail market, 2018 - 2030 (USD Million)
- Fig. 31 Global E-Commerce market, 2018 - 2030 (USD Million)
- Fig. 32 Global Hospital/ Clinic Pharmacy market, 2018 - 2030 (USD Million)
- Fig. 33 Animal Health market Product key takeaways (USD Million)
- Fig. 34 Animal Health market: Product movement & market share analysis, 2024 & 2030
- Fig. 35 Global Biologics market, 2018 - 2030 (USD Million)
- Fig. 36 Global Vaccines market, 2018 - 2030 (USD Million)
- Fig. 37 Global Modified/ Attenuated Live market, 2018 - 2030 (USD Million)
- Fig. 38 Global Inactivated (Killed) market, 2018 - 2030 (USD Million)
- Fig. 39 Global Other Vaccines market, 2018 - 2030 (USD Million)
- Fig. 40 Global Other Biologics market, 2018 - 2030 (USD Million)
- Fig. 41 Global Pharmaceuticals market, 2018 - 2030 (USD Million)
- Fig. 42 Global Parasiticides market, 2018 - 2030 (USD Million)
- Fig. 43 Global Anti-infectives market, 2018 - 2030 (USD Million)
- Fig. 44 Global Anti-inflammatory market, 2018 - 2030 (USD Million)
- Fig. 45 Global Analgesics market, 2018 - 2030 (USD Million)
- Fig. 46 Global Other Pharmaceuticals market, 2018 - 2030 (USD Million)
- Fig. 47 Global Diagnostics market, 2018 - 2030 (USD Million)
- Fig. 48 Global Consumables, reagents and kits market, 2018 - 2030 (USD Million)
- Fig. 49 Global Instruments and devices market, 2018 - 2030 (USD Million)
- Fig. 50 Global Equipment & Disposables market, 2018 - 2030 (USD Million)
- Fig. 51 Global Critical Care Consumables market, 2018 - 2030 (USD Million)
- Fig. 52 Global Anesthesia Equipment market, 2018 - 2030 (USD Million)
- Fig. 53 Global Fluid Management Equipment market, 2018 - 2030 (USD Million)
- Fig. 54 Global Temperature Management Equipment market, 2018 - 2030 (USD Million)
- Fig. 55 Global Rescue & Resuscitation Equipment market, 2018 - 2030 (USD Million)
- Fig. 56 Global Research Equipment market, 2018 - 2030 (USD Million)
- Fig. 57 Global Patient Monitoring Equipment market, 2018 - 2030 (USD Million)
- Fig. 58 Global Medicinal Feed Additives market, 2018 - 2030 (USD Million)
- Fig. 59 Global Other Products market, 2018 - 2030 (USD Million)
- Fig. 60 Global Veterinary Telehealth market, 2018 - 2030 (USD Million)
- Fig. 61 Global Veterinary Software market, 2018 - 2030 (USD Million)
- Fig. 62 Global Livestock Monitoring market, 2018 - 2030 (USD Million)
- Fig. 63 Animal Health market End Use key takeaways (USD Million)
- Fig. 64 Animal Health market: End Use movement & market share analysis, 2024 & 2030
- Fig. 65 Global Veterinary Reference Laboratories market, 2018 - 2030 (USD Million)
- Fig. 66 Global Point-of-care Testing/In-house Testing market, 2018 - 2030 (USD Million)
- Fig. 67 Global Veterinary Hospitals & Clinics market, 2018 - 2030 (USD Million)
- Fig. 68 Global Other End Use market, 2018 - 2030 (USD Million)
- Fig. 69 Regional market place: Key takeaways
- Fig. 70 Regional outlook, 2024 & 2030
- Fig. 71 North America Animal Health market, 2018 - 2030 (USD Million)
- Fig. 72 U.S. Animal Health market, 2018 - 2030 (USD Million)
- Fig. 73 Canada Animal Health market, 2018 - 2030 (USD Million)
- Fig. 74 Mexico Animal Health market, 2018 - 2030 (USD Million)
- Fig. 75 Europe Animal Health market, 2018 - 2030 (USD Million)
- Fig. 76 UK Animal Health market, 2018 - 2030 (USD Million)
- Fig. 77 Germany Animal Health market, 2018 - 2030 (USD Million)
- Fig. 78 France Animal Health market, 2018 - 2030 (USD Million)
- Fig. 79 Italy Animal Health market, 2018 - 2030 (USD Million)
- Fig. 80 Spain Animal Health market, 2018 - 2030 (USD Million)
- Fig. 81 Denmark Animal Health market, 2018 - 2030 (USD Million)
- Fig. 82 Sweden Animal Health market, 2018 - 2030 (USD Million)
- Fig. 83 Norway Animal Health market, 2018 - 2030 (USD Million)
- Fig. 84 Russia Animal Health market, 2018 - 2030 (USD Million)
- Fig. 85 Switzerland Animal Health market, 2018 - 2030 (USD Million)
- Fig. 86 Netherlands Animal Health market, 2018 - 2030 (USD Million)
- Fig. 87 Poland Animal Health market, 2018 - 2030 (USD Million)
- Fig. 88 Ireland Animal Health market, 2018 - 2030 (USD Million)
- Fig. 89 Asia Pacific Animal Health market, 2018 - 2030 (USD Million)
- Fig. 90 Japan Animal Health market, 2018 - 2030 (USD Million)
- Fig. 91 China Animal Health market, 2018 - 2030 (USD Million)
- Fig. 92 India Animal Health market, 2018 - 2030 (USD Million)
- Fig. 93 South Korea Animal Health market, 2018 - 2030 (USD Million)
- Fig. 94 Australia Animal Health market, 2018 - 2030 (USD Million)
- Fig. 95 Thailand Animal Health market, 2018 - 2030 (USD Million)
- Fig. 96 Singapore Animal Health market, 2018 - 2030 (USD Million)
- Fig. 97 Indonesia Animal Health market, 2018 - 2030 (USD Million)
- Fig. 98 Malaysia Animal Health market, 2018 - 2030 (USD Million)
- Fig. 99 Philippines Animal Health market, 2018 - 2030 (USD Million)
- Fig. 100 Latin America Animal Health market, 2018 - 2030 (USD Million)
- Fig. 101 Brazil Animal Health market, 2018 - 2030 (USD Million)
- Fig. 102 Argentina Animal Health market, 2018 - 2030 (USD Million)
- Fig. 103 MEA Animal Health market, 2018 - 2030 (USD Million)
- Fig. 104 South Africa Animal Health market, 2018 - 2030 (USD Million)
- Fig. 105 UAE Animal Health market, 2018 - 2030 (USD Million)
- Fig. 106 Saudi Arabia Animal Health market, 2018 - 2030 (USD Million)
- Fig. 107 Kuwait Animal Health market, 2018 - 2030 (USD Million)
- Fig. 108 Iran Animal Health market, 2018 - 2030 (USD Million)
- Fig. 109 Israel Animal Health market, 2018 - 2030 (USD Million)
- Fig. 110 Turkey Animal Health market, 2018 - 2030 (USD Million)
- Fig. 111 Egypt Animal Health market, 2018 - 2030 (USD Million)
- Fig. 112 Market participant categorization
- Fig. 113 Heat map analysis
Animal Health Market Growth & Trends:
The global animal health market size is expected to reach USD 112.33 billion by 2030, registering a CAGR of 10.46% from 2025 to 2030, according to a new report by Grand View Research, Inc. The market is driven by increased investments in animal health, product approvals, diagnostic rates, initiatives by key companies, and increased animal health expenditure. The market has also remained largely resilient during the COVID-19 pandemic. In November 2023, MSD Animal Health received European Commission approval for BOVILIS CRYPTIUM- a vaccine to protect cattle against Cryptosporidium parvum (C. parvum) infection. This enabled the company to commercialize the product across all European Union countries.
The threat of zoonotic infections spreading through ticks, and fleas or through contact with animals is high. The WHO is involved in various cross-sectoral activities for the purpose of addressing health threats at the human-animal-ecosystem interface. Food-borne zoonoses, antimicrobial resistance, and emerging zoonoses are some of the threats in the animal health market. Also, MediLabSecure, a laboratory network project, was initiated with an aim of identifying emerging viruses and pathogens in 19 countries in the Mediterranean region. The implementation of a wide range of technologies for the detection and monitoring of various animal diseases is one of the major growth contributing factors.
Key market participants employ various strategies, such as expanding their product portfolio, to gain a competitive advantage. For instance, in January 2021, Zoetis launched the Poulvac Procerta HVT-IBD vaccine for poultry to protect against Infectious Bursal Disease (IBD). This added to Zoetis' product portfolio of recombinant vector vaccines. The market especially for the companion animal segment was positively impacted during late 2020 and 2021, due to increased pet adoption rates, pet humanization trends, and improved overall diagnostics business sales with increased awareness among pet parents. During 2022 and 2023 however, macroeconomic uncertainties, such as global recession and inflation, notably impacted market revenues for a short period.
Animal Health Market Report Highlights:
- Based on products, the pharmaceutical segment dominated the market with a share of about 43.42% in 2024. It is estimated to retain its dominant position throughout the forecast period due to consistent advancements in veterinary drugs.
- In 2024, the production animal segment dominated the market and accounted for the largest revenue share. The substantial segment share results from increased concern for food safety and sustainability among end users as well as market stakeholders such as government healthcare organizations.
- The hospital/clinic pharmacy segment accounted for the largest revenue share in 2024 in terms of distribution channels. The increasing number of hospital pharmacies and high procedural volume have supported segment growth.
- By end-use, the veterinary hospitals and clinics segment accounted for the largest revenue share of the market in 2024. This is due to a large number of hospitals and clinics across the globe and highest footfall of patients at these care centers.
- North America animal health market held the highest share of about 35.69% in 2024. The dominant share can be attributed to the high prevalence of livestock and zoonotic diseases leading to large-scale animal deaths.
Table of Contents
Chapter 1. Methodology and Scope
- 1.1. Market Segmentation and Scope
- 1.2. Research Methodology
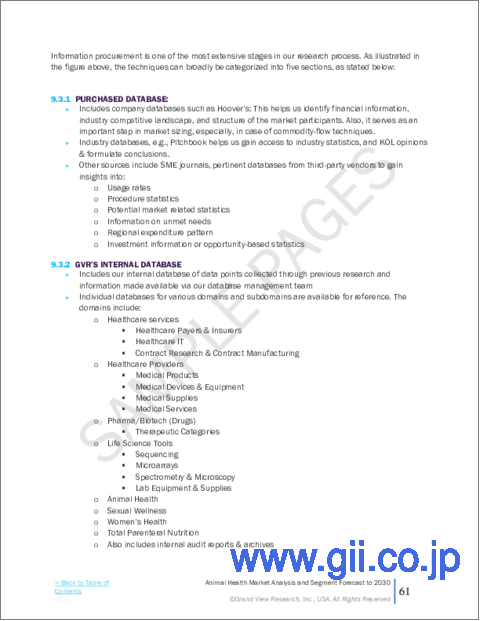
- 1.3. Information Procurement
- 1.3.1. Purchased Database
- 1.3.2. GVR's Internal Database
- 1.3.3. Secondary Sources
- 1.3.4. Primary Research
- 1.4. Information/Data Analysis
- 1.5. Market Formulation & Visualization
- 1.6. Data Validation & Publishing
- 1.7. Model Details
- 1.7.1. Commodity flow analysis
- 1.7.2. Global Market: CAGR Calculation
- 1.8. List of Secondary Sources
Chapter 2. Executive Summary
- 2.1. Market Outlook
- 2.2. Segment Outlook
- 2.3. Competitive Insights
Chapter 3. Animal Health Market Variables, Trends, & Scope
- 3.1. Market Dynamics
- 3.1.1. Market Drivers Analysis
- 3.1.1.1. Increasing expenditure on pets
- 3.1.1.2. Increasing advancements in veterinary medicine
- 3.1.1.3. Increasing medicalization rate
- 3.1.1.4. Increasing demand for animal protein
- 3.1.1.5. Increasing prevalence of diseases in animals
- 3.1.1.6. Rising Government Initiatives
- 3.1.1.7. Increasing Inculcation Of Artificial Intelligence (AI)
- 3.1.1.8. Evolving Regulatory Scenario
- 3.1.2. Market Restraints Analysis
- 3.1.2.1. Complex regulations
- 3.1.2.2. Limited Awareness and Education
- 3.1.2.3. High cost of animal care
- 3.1.2.4. Limited access to veterinary care
- 3.1.3. Market Opportunity Analysis
- 3.1.4. Market Challenge Analysis
- 3.1.1. Market Drivers Analysis
- 3.2. Animal Health Market Analysis Tools
- 3.2.1. Porter's Analysis
- 3.2.1.1. Bargaining power of suppliers
- 3.2.1.2. Bargaining power of buyers
- 3.2.1.3. Threat of substitutes
- 3.2.1.4. Threat of new entrants
- 3.2.1.5. Competitive rivalry
- 3.2.2. PESTEL Analysis
- 3.2.2.1. Political landscape
- 3.2.2.2. Economic and Social landscape
- 3.2.2.3. Technological landscape
- 3.2.2.4. Environmental landscape
- 3.2.2.5. Legal landscape
- 3.2.1. Porter's Analysis
- 3.3. Estimated Animal Population, by Key Species & Key Countries, 2023
- 3.4. COVID-19 Impact Analysis
- 3.5. Pricing Analysis
- 3.6. Pet Owner Demographics in key Countries
Chapter 4. Animal Health Market: Product Estimates & Trend Analysis
- 4.1. Segment Dashboard
- 4.2. Animal Health Market: Product Movement Analysis, USD Billion, 2024 & 2030
- 4.3. Biologics
- 4.3.1. Biologics Market Revenue Estimates and Forecasts, 2018 - 2030 (USD Million)
- 4.3.2. Vaccines
- 4.3.2.1. Vaccines Market Revenue Estimates and Forecasts, 2018 - 2030 (USD Million)
- 4.3.2.2. Modified/ Attenuated Live
- 4.3.2.2.1. Modified/ Attenuated Live Market Revenue Estimates and Forecasts, 2018 - 2030 (USD Million)
- 4.3.2.3. Inactivated (Killed)
- 4.3.2.3.1. Inactivated (Killed) Market Revenue Estimates and Forecasts, 2018 - 2030 (USD Million)
- 4.3.2.4. Other Vaccines
- 4.3.2.4.1. Other Vaccines Market Revenue Estimates and Forecasts, 2018 - 2030 (USD Million)
- 4.3.3. Other Biologics
- 4.3.3.1. Other Biologics Market Revenue Estimates and Forecasts, 2018 - 2030 (USD Million)
- 4.4. Pharmaceuticals
- 4.4.1. Pharmaceuticals Market Revenue Estimates and Forecasts, 2018 - 2030 (USD Million)
- 4.4.2. Parasiticides
- 4.4.2.1. Parasiticides Market Revenue Estimates and Forecasts, 2018 - 2030 (USD Million)
- 4.4.3. Anti-infectives
- 4.4.3.1. Anti-infectives Market Revenue Estimates and Forecasts, 2018 - 2030 (USD Million)
- 4.4.4. Anti-inflammatory
- 4.4.4.1. Anti-inflammatory Market Revenue Estimates and Forecasts, 2018 - 2030 (USD Million)
- 4.4.5. Analgesics
- 4.4.5.1. Analgesics Market Revenue Estimates and Forecasts, 2018 - 2030 (USD Million)
- 4.4.6. Others
- 4.4.6.1. Others Market Revenue Estimates and Forecasts, 2018 - 2030 (USD Million)
- 4.5. Diagnostics
- 4.5.1. Diagnostics Market Revenue Estimates and Forecasts, 2018 - 2030 (USD Million)
- 4.5.2. Consumables, reagents and kits
- 4.5.2.1. Consumables, reagents and kits Market Revenue Estimates and Forecasts, 2018 - 2030 (USD Million)
- 4.5.3. Instruments and devices
- 4.5.3.1. Instruments and devices Market Revenue Estimates and Forecasts, 2018 - 2030 (USD Million)
- 4.6. Equipment & Disposables
- 4.6.1. Equipment & Disposables Market Revenue Estimates and Forecasts, 2018 - 2030 (USD Million)
- 4.6.2. Critical Care Consumables
- 4.6.2.1. Critical Care Consumables Market Revenue Estimates and Forecasts, 2018 - 2030 (USD Million)
- 4.6.3. Anesthesia Equipment
- 4.6.3.1. Anesthesia Equipment Market Revenue Estimates and Forecasts, 2018 - 2030 (USD Million)
- 4.6.4. Fluid Management Equipment
- 4.6.4.1. Fluid Management Equipment Market Revenue Estimates and Forecasts, 2018 - 2030 (USD Million)
- 4.6.5. Temperature Management Equipment
- 4.6.5.1. Temperature Management Equipment Market Revenue Estimates and Forecasts, 2018 - 2030 (USD Million)
- 4.6.6. Rescue & Resuscitation Equipment
- 4.6.6.1. Rescue & Resuscitation Equipment Market Revenue Estimates and Forecasts, 2018 - 2030 (USD Million)
- 4.6.7. Research Equipment
- 4.6.7.1. Research Equipment Market Revenue Estimates and Forecasts, 2018 - 2030 (USD Million)
- 4.6.8. Patient Monitoring Equipment
- 4.6.8.1. Patient Monitoring Equipment Market Revenue Estimates and Forecasts, 2018 - 2030 (USD Million)
- 4.7. Medicinal Feed Additives
- 4.7.1. Medicinal Feed Additives Market Revenue Estimates and Forecasts, 2018 - 2030 (USD Million)
- 4.8. Other Products
- 4.8.1. Other Products Market Revenue Estimates and Forecasts, 2018 - 2030 (USD Million)
- 4.8.2. Veterinary Telehealth
- 4.8.2.1. Veterinary Telehealth Market Revenue Estimates and Forecasts, 2018 - 2030 (USD Million)
- 4.8.3. Veterinary Software
- 4.8.3.1. Veterinary Software Market Revenue Estimates and Forecasts, 2018 - 2030 (USD Million)
- 4.8.4. Livestock Monitoring
- 4.8.4.1. Livestock Monitoring Market Revenue Estimates and Forecasts, 2018 - 2030 (USD Million)
Chapter 5. Animal Health Market: Distribution Channel Estimates & Trend Analysis
- 5.1. Segment Dashboard
- 5.2. Animal Health Market: Distribution Channel Movement Analysis, USD Billion, 2024 & 2030
- 5.3. Retail
- 5.3.1. Retail Market Revenue Estimates and Forecasts, 2018 - 2030 (USD Million)
- 5.4. E-Commerce
- 5.4.1. E-Commerce Market Revenue Estimates and Forecasts, 2018 - 2030 (USD Million)
- 5.5. Hospital/ Clinic Pharmacy
- 5.5.1. Hospital/ Clinic Pharmacy Market Revenue Estimates and Forecasts, 2018 - 2030 (USD Million)
Chapter 6. Animal Health Market: Animal Type Estimates & Trend Analysis
- 6.1. Segment Dashboard
- 6.2. Animal Health Market: Animal Type Movement Analysis, USD Billion, 2024 & 2030
- 6.3. Production Animals
- 6.3.1. Production Animals Market Revenue Estimates and Forecasts, 2018 - 2030 (USD Million)
- 6.3.2. Poultry
- 6.3.2.1. Poultry Market Revenue Estimates and Forecasts, 2018 - 2030 (USD Million)
- 6.3.3. Swine
- 6.3.3.1. Swine Market Revenue Estimates and Forecasts, 2018 - 2030 (USD Million)
- 6.3.4. Cattle
- 6.3.4.1. Cattle Market Revenue Estimates and Forecasts, 2018 - 2030 (USD Million)
- 6.3.5. Sheep & Goats
- 6.3.5.1. Sheep & Goats Market Revenue Estimates and Forecasts, 2018 - 2030 (USD Million)
- 6.3.6. Fish
- 6.3.6.1. Fish Market Revenue Estimates and Forecasts, 2018 - 2030 (USD Million)
- 6.4. Companion Animals
- 6.4.1. Companion Animals Market Revenue Estimates and Forecasts, 2018 - 2030 (USD Million)
- 6.4.2. Dogs
- 6.4.2.1. Dogs Market Revenue Estimates and Forecasts, 2018 - 2030 (USD Million)
- 6.4.3. Cats
- 6.4.3.1. Cats Market Revenue Estimates and Forecasts, 2018 - 2030 (USD Million)
- 6.4.4. Horses
- 6.4.4.1. Horses Market Revenue Estimates and Forecasts, 2018 - 2030 (USD Million)
- 6.4.5. Others
- 6.4.5.1. Others Market Revenue Estimates and Forecasts, 2018 - 2030 (USD Million)
Chapter 7. Animal Health Market: End Use Estimates & Trend Analysis
- 7.1. Segment Dashboard
- 7.2. Animal Health Market: End Use Movement Analysis, USD Billion, 2024 & 2030
- 7.3. Veterinary Reference Laboratories
- 7.3.1. Veterinary Reference Laboratories Market Revenue Estimates and Forecasts, 2018 - 2030 (USD Million)
- 7.4. Point-of-care Testing/In-house Testing
- 7.4.1. Point-of-care Testing/In-house Testing Market Revenue Estimates and Forecasts, 2018 - 2030 (USD Million)
- 7.5. Veterinary Hospitals & Clinics
- 7.5.1. Veterinary Hospitals & Clinics Market Revenue Estimates and Forecasts, 2018 - 2030 (USD Million)
- 7.6. Others
- 7.6.1. Others Market Revenue Estimates and Forecasts, 2018 - 2030 (USD Million)
Chapter 8. Animal Health Market: Regional Estimates & Trend Analysis
- 8.1. Animal Health Market Share, By Region, 2024 & 2030, USD Million
- 8.2. Regional Outlook
- 8.3. North America
- 8.3.1. North America Animal Health Market Estimates and Forecasts, 2018 - 2030 (USD Million)
- 8.3.2. U.S.
- 8.3.2.1. Key Country Dynamics
- 8.3.2.2. U.S. Animal Health Market Estimates and Forecasts, 2018 - 2030 (USD Million)
- 8.3.3. Canada
- 8.3.3.1. Key Country Dynamics
- 8.3.3.2. Canada Animal Health Market Estimates and Forecasts, 2018 - 2030 (USD Million)
- 8.3.4. Mexico
- 8.3.4.1. Key Country Dynamics
- 8.3.4.2. Mexico Animal Health Market Estimates and Forecasts, 2018 - 2030 (USD Million)
- 8.4. Europe
- 8.4.1. Europe Animal Health Market Estimates and Forecasts, 2018 - 2030 (USD Million)
- 8.4.2. UK
- 8.4.2.1. Key Country Dynamics
- 8.4.2.2. UK Animal Health Market Estimates and Forecasts, 2018 - 2030 (USD Million)
- 8.4.3. Germany
- 8.4.3.1. Key Country Dynamics
- 8.4.3.2. Germany Animal Health Market Estimates and Forecasts, 2018 - 2030 (USD Million)
- 8.4.4. France
- 8.4.4.1. Key Country Dynamics
- 8.4.4.2. France Animal Health Market Estimates and Forecasts, 2018 - 2030 (USD Million)
- 8.4.5. Italy
- 8.4.5.1. Key Country Dynamics
- 8.4.5.2. Italy Animal Health Market Estimates and Forecasts, 2018 - 2030 (USD Million)
- 8.4.6. Spain
- 8.4.6.1. Key Country Dynamics
- 8.4.6.2. Spain Animal Health Market Estimates and Forecasts, 2018 - 2030 (USD Million)
- 8.4.7. Sweden
- 8.4.7.1. Key Country Dynamics
- 8.4.7.2. Sweden Animal Health Market Estimates and Forecasts, 2018 - 2030 (USD Million)
- 8.4.8. Denmark
- 8.4.8.1. Key Country Dynamics
- 8.4.8.2. Denmark Animal Health Market Estimates and Forecasts, 2018 - 2030 (USD Million)
- 8.4.9. Norway
- 8.4.9.1. Key Country Dynamics
- 8.4.9.2. Norway Animal Health Market Estimates and Forecasts, 2018 - 2030 (USD Million)
- 8.4.10. Russia
- 8.4.10.1. Key Country Dynamics
- 8.4.10.2. Russia Animal Health Market Estimates and Forecasts, 2018 - 2030 (USD Million)
- 8.4.11. Netherlands
- 8.4.11.1. Key Country Dynamics
- 8.4.11.2. Netherlands Animal Health Market Estimates and Forecasts, 2018 - 2030 (USD Million)
- 8.4.12. Switzerland
- 8.4.12.1. Key Country Dynamics
- 8.4.12.2. Switzerland Animal Health Market Estimates and Forecasts, 2018 - 2030 (USD Million)
- 8.4.13. Ireland
- 8.4.13.1. Key Country Dynamics
- 8.4.13.2. Ireland Animal Health Market Estimates and Forecasts, 2018 - 2030 (USD Million)
- 8.4.14. Poland
- 8.4.14.1. Key Country Dynamics
- 8.4.14.2. Poland Animal Health Market Estimates and Forecasts, 2018 - 2030 (USD Million)
- 8.5. Asia Pacific
- 8.5.1. Asia Pacific Animal Health Market Estimates and Forecasts, 2018 - 2030 (USD Million)
- 8.5.2. China
- 8.5.2.1. Key Country Dynamics
- 8.5.2.2. China Animal Health Market Estimates and Forecasts, 2018 - 2030 (USD Million)
- 8.5.3. Japan
- 8.5.3.1. Key Country Dynamics
- 8.5.3.2. Japan Animal Health Market Estimates and Forecasts, 2018 - 2030 (USD Million)
- 8.5.4. India
- 8.5.4.1. Key Country Dynamics
- 8.5.4.2. India Animal Health Market Estimates and Forecasts, 2018 - 2030 (USD Million)
- 8.5.5. South Korea
- 8.5.5.1. Key Country Dynamics
- 8.5.5.2. South Korea Animal Health Market Estimates and Forecasts, 2018 - 2030 (USD Million)
- 8.5.6. Australia
- 8.5.6.1. Key Country Dynamics
- 8.5.6.2. Australia Animal Health Market Estimates and Forecasts, 2018 - 2030 (USD Million)
- 8.5.7. Thailand
- 8.5.7.1. Key Country Dynamics
- 8.5.7.2. Thailand Animal Health Market Estimates and Forecasts, 2018 - 2030 (USD Million)
- 8.5.8. Indonesia
- 8.5.8.1. Key Country Dynamics
- 8.5.8.2. Indonesia Animal Health Market Estimates and Forecasts, 2018 - 2030 (USD Million)
- 8.5.9. Philippines
- 8.5.9.1. Key Country Dynamics
- 8.5.9.2. Philippines Animal Health Market Estimates and Forecasts, 2018 - 2030 (USD Million)
- 8.5.10. Malaysia
- 8.5.10.1. Key Country Dynamics
- 8.5.10.2. Malaysia Animal Health Market Estimates and Forecasts, 2018 - 2030 (USD Million)
- 8.5.11. Singapore
- 8.5.11.1. Key Country Dynamics
- 8.5.11.2. Singapore Animal Health Market Estimates and Forecasts, 2018 - 2030 (USD Million)
- 8.6. Latin America
- 8.6.1. Latin America Animal Health Market Estimates and Forecasts, 2018 - 2030 (USD Million)
- 8.6.2. Brazil
- 8.6.2.1. Key Country Dynamics
- 8.6.2.2. Brazil Animal Health Market Estimates and Forecasts, 2018 - 2030 (USD Million)
- 8.6.3. Argentina
- 8.6.3.1. Key Country Dynamics
- 8.6.3.2. Argentina Animal Health Market Estimates and Forecasts, 2018 - 2030 (USD Million)
- 8.7. Middle East and Africa
- 8.7.1. Middle East and Africa Animal Health Market Estimates and Forecasts, 2018 - 2030 (USD Million)
- 8.7.2. Saudi Arabia
- 8.7.2.1. Key Country Dynamics
- 8.7.2.2. Saudi Arabia Animal Health Market Estimates and Forecasts, 2018 - 2030 (USD Million)
- 8.7.3. UAE
- 8.7.3.1. Key Country Dynamics
- 8.7.3.2. UAE Animal Health Market Estimates and Forecasts, 2018 - 2030 (USD Million)
- 8.7.4. South Africa
- 8.7.4.1. Key Country Dynamics
- 8.7.4.2. South Africa Animal Health Market Estimates and Forecasts, 2018 - 2030 (USD Million)
- 8.7.5. Kuwait
- 8.7.5.1. Key Country Dynamics
- 8.7.5.2. Kuwait Animal Health Market Estimates and Forecasts, 2018 - 2030 (USD Million)
- 8.7.6. Turkey
- 8.7.6.1. Key Country Dynamics
- 8.7.6.2. Turkey Animal Health Market Estimates and Forecasts, 2018 - 2030 (USD Million)
- 8.7.7. Iran
- 8.7.7.1. Key Country Dynamics
- 8.7.7.2. Iran Animal Health Market Estimates and Forecasts, 2018 - 2030 (USD Million)
- 8.7.8. Israel
- 8.7.8.1. Key Country Dynamics
- 8.7.8.2. Israel Animal Health Market Estimates and Forecasts, 2018 - 2030 (USD Million)
- 8.7.9. Egypt
- 8.7.9.1. Key Country Dynamics
- 8.7.9.2. Egypt Animal Health Market Estimates and Forecasts, 2018 - 2030 (USD Million)
Chapter 9. Competitive Landscape
- 9.1. Market Participant Categorization
- 9.2. Company Market Position Analysis/ Heap Map Analysis
- 9.3. Company Profiles
- 9.3.1. Zoetis
- 9.3.1.1. Participant's Overview
- 9.3.1.2. Financial Performance
- 9.3.1.3. Product Benchmarking
- 9.3.1.4. Strategic Initiatives
- 9.3.2. Ceva Sante Animale
- 9.3.2.1. Participant's Overview
- 9.3.2.2. Financial Performance
- 9.3.2.3. Product Benchmarking
- 9.3.2.4. Strategic Initiatives
- 9.3.3. Merck & Co., Inc.
- 9.3.3.1. Participant's Overview
- 9.3.3.2. Financial Performance
- 9.3.3.3. Product Benchmarking
- 9.3.3.4. Strategic Initiatives
- 9.3.4. Vetoquinol S.A.
- 9.3.4.1. Participant's Overview
- 9.3.4.2. Financial Performance
- 9.3.4.3. Product Benchmarking
- 9.3.4.4. Strategic Initiatives
- 9.3.5. Boehringer Ingelheim Gmbh
- 9.3.5.1. Participant's Overview
- 9.3.5.2. Financial Performance
- 9.3.5.3. Product Benchmarking
- 9.3.5.4. Strategic Initiatives
- 9.3.6. Elanco
- 9.3.6.1. Participant's Overview
- 9.3.6.2. Financial Performance
- 9.3.6.3. Product Benchmarking
- 9.3.6.4. Strategic Initiatives
- 9.3.7. Virbac
- 9.3.7.1. Participant's Overview
- 9.3.7.2. Financial Performance
- 9.3.7.3. Product Benchmarking
- 9.3.7.4. Strategic Initiatives
- 9.3.8. Mars Inc.
- 9.3.8.1. Participant's Overview
- 9.3.8.2. Financial Performance
- 9.3.8.3. Product Benchmarking
- 9.3.8.4. Strategic Initiatives
- 9.3.9. Dechra Pharmaceuticals Plc
- 9.3.9.1. Participant's Overview
- 9.3.9.2. Financial Performance
- 9.3.9.3. Product Benchmarking
- 9.3.9.4. Strategic Initiatives
- 9.3.10. Idexx Laboratories, Inc.
- 9.3.10.1. Participant's Overview
- 9.3.10.2. Financial Performance
- 9.3.10.3. Product Benchmarking
- 9.3.10.4. Strategic Initiatives
- 9.3.1. Zoetis
- 9.4. Strategy Mapping
- 9.4.1. Mergers & Acquisitions
- 9.4.2. Partnerships & Collaborations
- 9.4.3. Others
- 9.5. List of Other Key Manufacturers
- 9.6. List of Distributors by Region
