|
|
市場調査レポート
商品コード
1772566
米国のスマートメーターの市場規模、シェア、動向分析レポート:コンポーネント別、タイプ別、技術別、最終用途別、セグメント別予測、2025年~2033年U.S. Smart Meter Market Size, Share & Trends Analysis Report By Component (Hardware, Software), By Type (Smart Electric Meter, Smart Water Meter), By Technology, By End Use, And Segment Forecasts, 2025 - 2033 |
||||||
|
|||||||
カスタマイズ可能
|
|||||||

| 米国のスマートメーターの市場規模、シェア、動向分析レポート:コンポーネント別、タイプ別、技術別、最終用途別、セグメント別予測、2025年~2033年 |
|
出版日: 2025年06月23日
発行: Grand View Research
ページ情報: 英文 150 Pages
納期: 2~10営業日
|

全表示
- 概要
- 図表
- 目次
米国のスマートメーターの市場規模・動向:
米国のスマートメーターの市場規模は2024年に43億7,000万米ドルと推計され、2033年には85億米ドルに達し、2025年~2033年のCAGRは7.6%で成長すると予測されています。
市場成長の主な原動力は、再生可能エネルギー源の採用増加、エネルギー効率化と脱炭素化の世界的な推進です。電力会社は、太陽光、風力、その他の再生可能エネルギーをより適切にグリッドに統合し、非技術的な損失を削減し、グリッド全体の回復力を向上させるため、スマートメーターを導入しています。この移行は、政府の義務付けや世界の持続可能性目標だけでなく、スマートメーター技術の革新も支えており、スマートメーター産業の拡大にさらに拍車をかけています。
高度計測インフラ(AMI)システムは、スマートメーター業界において増加傾向にあり、電力会社と消費者間の双方向通信を提供しています。AMIはリアルタイムのデータ収集、ダイナミックな負荷管理、高度な分析を可能にし、電力会社には送電網運用の最適化を、消費者にはエネルギー使用をより効果的に管理する力を与えます。AMIの拡大は、データ処理、予知保全、需要応答機能を強化するIoTやAIの統合と密接に関連しています。
さらに、サイバーセキュリティとデータプライバシーがスマートメーター業界の重要な推進力として浮上しており、機密性の高い消費者データとグリッドインフラを保護するための強固なセキュリティ対策の導入を促しています。スマートメーターがIoTプラットフォームを通じて相互接続されるようになるにつれて、電力会社やメーカーはサイバーリスクを軽減するために安全な通信プロトコルと高度なソフトウェアソリューションに投資し、信頼と規制遵守を確保し、それによって市場の成長を促進しています。
さらに、消費者中心のソフトウェア・プラットフォームと分析ツールは、リアルタイムのモニタリング、詳細な消費に関する洞察、個別化されたエネルギー管理を可能にすることで、スマートメーター業界を変革します。これらのソフトウェアの進歩は、より良い顧客エンゲージメントを促進し、需要応答プログラムをサポートし、ユーティリティ企業がグリッド性能を最適化するのに役立ちます。クラウドコンピューティングやAIとの統合は、消費者と公益事業者の双方に実用的なインテリジェンスを提供することで、スマートメーターシステムの価値をさらに高めます。
さらに、主要企業は、IoT、人工知能、エッジコンピューティングなどの先進技術を統合し、データ精度、グリッドエッジ機能、リアルタイム分析を強化する革新的な戦略を採用しています。これらの企業は、予知保全を改善し、電気自動車の統合をサポートし、包括的なエネルギー監視と最適化を可能にするために、高度計測インフラ(AMI)の提供を拡大しています。主要企業のこうした戦略は、今後数年間の市場成長を促進すると予想されます。
目次
第1章 調査手法と範囲
第2章 エグゼクティブサマリー
第3章 米国のスマートメーター市場の変数、動向、範囲
- 市場系統の見通し
- 市場力学
- 市場促進要因分析
- 市場抑制要因分析
- 発展の課題
- 米国のスマートメーター市場の分析ツール
- 展開分析:ポーターのファイブフォース
- PESTEL分析
第4章 米国のスマートメーター市場:コンポーネントの推定・動向分析
- セグメントダッシュボード
- 米国のスマートメーター市場:コンポーネントの変動分析、2024年および2033年
- ハードウェア
- ソフトウェア
第5章 米国のスマートメーター市場:タイプの推定・動向分析
- セグメントダッシュボード
- 米国のスマートメーター市場:タイプの変動分析、2024年および2033年
- スマート電気メーター
- スマートガスメーター
- スマート水道メーター
第6章 米国のスマートメーター市場:技術の推定・動向分析
- セグメントダッシュボード
- 米国のスマートメーター市場:技術の変動分析、2024年および2033年
- 自動メーター読み取り(AMR)
- 高度計測インフラ(AMI)
第7章 米国のスマートメーター市場:最終用途の推定・動向分析
- セグメントダッシュボード
- 米国のスマートメーター市場:最終用途の変動分析、2024年および2033年
- 産業
- 商業
- 住宅
第8章 競合情勢
- 企業分類
- 企業の市場ポジショニング
- 企業ヒートマップ分析
- 企業プロファイル/上場企業
- ABB Group
- Badger Meter Inc.
- Diehl Metering US
- Elster Group GmbH(Honeywell International Inc.)
- General Electric Company
- Honeywell International Inc.
- Itron Inc.
- Kamstrup A/S
- Landis+Gyr Group AG
- Mueller Systems LLC
- Neptune Technology Group Inc.
- Sensus USA Inc.(Xylem Inc.)
- Siemens AG
List of Tables
- Table 1 U.S. Smart Meter Market Size Estimates & Forecasts 2021 - 2033 (USD Billion)
- Table 2 U.S. Smart Meter Market, By Component 2021 - 2033 (USD Billion)
- Table 3 U.S. Smart Meter Market, By Type 2021 - 2033 (USD Billion)
- Table 4 U.S. Smart Meter Market, By Technology 2021 - 2033 (USD Billion)
- Table 5 U.S. Smart Meter Market, By End Use 2021 - 2033 (USD Billion)
- Table 6 Hardware Market Estimates & Forecast, 2021 - 2033 (USD Billion)
- Table 7 Software Market Estimates & Forecast, 2021 - 2033 (USD Billion)
- Table 8 Smart Electric Meter Market Estimates & Forecast, 2021 - 2033 (USD Billion)
- Table 9 Smart Water Meter Market Estimates & Forecast, 2021 - 2033 (USD Billion)
- Table 10 Smart Gas Meter Market Estimates & Forecast, 2021 - 2033 (USD Billion)
- Table 11 Automatic Meter Reading (AMR) Market Estimates & Forecast, 2021 - 2033 (USD Billion)
- Table 12 Advanced Meter Infrastructure (AMI) Market Estimates & Forecast, 2021 - 2033 (USD Billion)
- Table 13 Residential Market Estimates & Forecast, 2021 - 2033 (USD Billion)
- Table 14 Commercial Market Estimates & Forecast, 2021 - 2033 (USD Billion)
- Table 15 Industrial Market Estimates & Forecast, 2021 - 2033 (USD Billion)
List of Figures
- Fig. 1 U.S. smart meter market segmentation
- Fig. 2 Information procurement
- Fig. 3 Data analysis models
- Fig. 4 Market formulation and validation
- Fig. 5 Data validating & publishing
- Fig. 6 U.S. smart meter market snapshot
- Fig. 7 U.S. smart meter market segment snapshot
- Fig. 8 U.S. Smart Meter Market Competitive Landscape Snapshot
- Fig. 9 Market research process
- Fig. 10 Market driver relevance analysis (current & future impact)
- Fig. 11 Market restraint relevance analysis (current & future impact)
- Fig. 12 U.S. smart meter market, by component, key takeaways
- Fig. 13 U.S. smart meter market, by component, market share, 2024 & 2033
- Fig. 14 Hardware market estimates & forecast, 2021 - 2033 (USD Billion)
- Fig. 15 Software market estimates & forecast, 2021 - 2033 (USD Billion)
- Fig. 16 U.S. smart meter market, by type, key takeaways
- Fig. 17 U.S. smart meter market, by type, market share, 2024 & 2033
- Fig. 18 Smart electric meter market estimates & forecast, 2021 - 2033 (USD Billion)
- Fig. 19 Smart water meter market estimates & forecast, 2021 - 2033 (USD Billion)
- Fig. 20 Smart gas meter market estimates & forecast, 2021 - 2033 (USD Billion)
- Fig. 21 U.S. smart meter market, by technology, key takeaways
- Fig. 22 U.S. smart meter market, by technology, market share, 2024 & 2033
- Fig. 23 Automatic Meter Reading (AMR) market estimates & forecast, 2021 - 2033 (USD Billion)
- Fig. 24 Advanced Meter Infrastructure (AMI) market estimates & forecast, 2021 - 2033 (USD Billion)
- Fig. 25 U.S. smart meter market, by end use, key takeaways
- Fig. 26 U.S. smart meter market, by end use, market share, 2024 & 2033
- Fig. 27 Residential market estimates & forecast, 2021 - 2033 (USD Billion)
- Fig. 28 Commercial market estimates & forecast, 2021 - 2033 (USD Billion)
- Fig. 29 Industrial market estimates & forecast, 2021 - 2033 (USD Billion)
- Fig. 30 Key company categorization
- Fig. 31 Strategy framework
U.S. Smart Meter Market Size & Trends:
The U.S. smart meter market size was estimated at USD 4.37 billion in 2024 and is projected to reach USD 8.50 billion by 2033, growing at a CAGR of 7.6% from 2025 to 2033. The market growth is primarily driven by the increasing adoption of renewable energy sources and the global push for energy efficiency and decarbonization. Utilities are deploying smart meters to better integrate solar, wind, and other renewables into the grid, reducing non-technical losses and improving overall grid resilience. This transition supports government mandates and sustainability goals worldwide as well as innovation in smart metering technologies, which is further fueling the expansion of the smart meter industry.
Advanced metering infrastructure (AMI) systems are a gaining trend in the smart meter industry, offering two-way communication between utilities and consumers. AMI enables real-time data collection, dynamic load management, and enhanced analytics, empowering utilities to optimize grid operations and consumers to manage their energy use more effectively. The expansion of AMI is closely linked with IoT and AI integration, which enhances data processing, predictive maintenance, and demand response capabilities.
Additionally, cybersecurity and data privacy have emerged as critical drivers in the smart meter industry, prompting the implementation of robust security measures to protect sensitive consumer data and grid infrastructure. As smart meters become more interconnected through IoT platforms, utilities and manufacturers are investing in secure communication protocols and advanced software solutions to mitigate cyber risks, ensuring trust and regulatory compliance, and thereby driving market growth.
Furthermore, consumer-centric software platforms and analytics tools transform the smart meter industry by enabling real-time monitoring, detailed consumption insights, and personalized energy management. These software advancements facilitate better customer engagement, support demand response programs, and help utilities optimize grid performance. Integration with cloud computing and AI further enhances the value of smart metering systems by providing actionable intelligence for both consumers and utilities.
Moreover, key companies are adopting innovative strategies to integrate advanced technologies such as IoT, artificial intelligence, and edge computing to enhance data accuracy, grid-edge capabilities, and real-time analytics. They are expanding their advanced metering infrastructure (AMI) offerings to improve predictive maintenance, support electric vehicle integration, and enable comprehensive energy monitoring and optimization. Such strategies by key companies are expected to drive the market growth in the coming years.
U.S. Smart Meter Market Report Segmentation
This report forecasts revenue growth at the country level and provides an analysis of the latest technological trends in each of the sub-segments from 2021 to 2033. For this study, Grand View Research has segmented the U.S. smart meter report based on component, technology, type, and end use:
- U.S. Smart Meter Component (Revenue, USD Billion, 2021 - 2033)
- Hardware
- Software
- U.S. Smart Meter Type (Revenue, USD Billion, 2021 - 2033)
- Smart Electric Meter
- Smart Water Meter
- Smart Gas Meter
- U.S. Smart Meter Technology Outlook (Revenue, USD Billion, 2021 - 2033)
- Automatic Meter Reading (AMR)
- Advanced Meter Infrastructure (AMI)
- U.S. Smart Meter End Use Outlook (Revenue, USD Billion, 2021 - 2033)
- Residential
- Commercial
- Industrial
Table of Contents
Chapter 1. Methodology and Scope
- 1.1. Market Segmentation and Scope
- 1.2. Market Definitions
- 1.2.1. Information analysis
- 1.2.2. Market formulation & data visualization
- 1.2.3. Data validation & publishing
- 1.3. Research Scope and Assumptions
- 1.3.1. List of Data Sources
Chapter 2. Executive Summary
- 2.1. Market Outlook
- 2.2. Segment Outlook
- 2.3. Competitive Insights
Chapter 3. U.S. Smart Meter Market Variables, Trends, & Scope
- 3.1. Market Lineage Outlook
- 3.2. Market Dynamics
- 3.2.1. Market Driver Analysis
- 3.2.2. Market Restraint Analysis
- 3.2.3. Deployment Challenge
- 3.3. U.S. Smart Meter Market Analysis Tools
- 3.3.1. Deployment Analysis - Porter's
- 3.3.1.1. Bargaining power of the suppliers
- 3.3.1.2. Bargaining power of the buyers
- 3.3.1.3. Threats of substitution
- 3.3.1.4. Threats from new entrants
- 3.3.1.5. Competitive rivalry
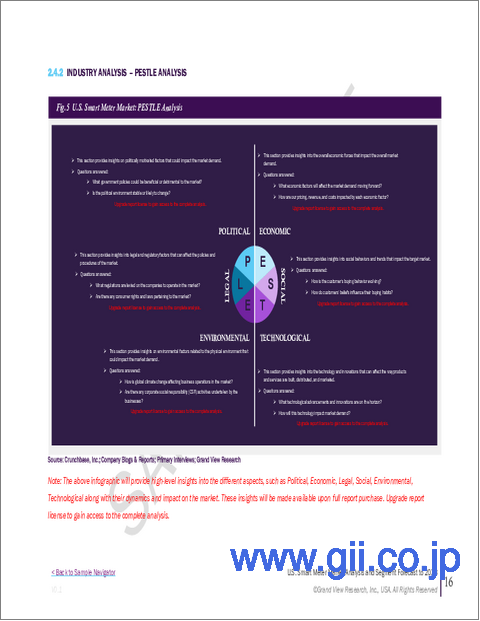
- 3.3.2. PESTEL Analysis
- 3.3.2.1. Political landscape
- 3.3.2.2. Economic landscape
- 3.3.2.3. Social landscape
- 3.3.2.4. Technological landscape
- 3.3.2.5. Environmental landscape
- 3.3.2.6. Legal landscape
- 3.3.1. Deployment Analysis - Porter's
Chapter 4. U.S. Smart Meter Market: Component Estimates & Trend Analysis
- 4.1. Segment Dashboard
- 4.2. U.S. Smart Meter Market: Component Movement Analysis, 2024 & 2033 (USD Billion)
- 4.3. Hardware
- 4.3.1. Hardware Market Revenue Estimates and Forecasts, 2021 - 2033 (USD Billion)
- 4.4. Software
- 4.4.1. Software Market Revenue Estimates and Forecasts, 2021 - 2033 (USD Billion)
Chapter 5. U.S. Smart Meter Market: Type Estimates & Trend Analysis
- 5.1. Segment Dashboard
- 5.2. U.S. Smart Meter Market: Type Movement Analysis, 2024 & 2033 (USD Billion)
- 5.3. Smart Electric Meter
- 5.3.1. Smart Electric Meter Market Revenue Estimates and Forecasts, 2021 - 2033 (USD Billion)
- 5.4. Smart Gas Meter
- 5.4.1. Smart Gas Meter Market Revenue Estimates and Forecasts, 2021 - 2033 (USD Billion)
- 5.5. Smart Water Meter
- 5.5.1. Smart Water Meter Market Revenue Estimates and Forecasts, 2021 - 2033 (USD Billion)
Chapter 6. U.S. Smart Meter Market: Technology Estimates & Trend Analysis
- 6.1. Segment Dashboard
- 6.2. U.S. Smart Meter Market: Technology Movement Analysis, 2024 & 2033 (USD Billion)
- 6.3. Automatic Meter Reading (AMR)
- 6.3.1. Automatic Meter Reading (AMR) Market Revenue Estimates and Forecasts, 2021 - 2033 (USD Billion)
- 6.4. Advanced Meter Infrastructure (AMI)
- 6.4.1. Advanced Meter Infrastructure (AMI) Market Revenue Estimates and Forecasts, 2021 - 2033 (USD Billion)
Chapter 7. U.S. Smart Meter Market: End Use Estimates & Trend Analysis
- 7.1. Segment Dashboard
- 7.2. U.S. Smart Meter Market: End Use Movement Analysis, 2024 & 2033 (USD Billion)
- 7.3. Industrial
- 7.3.1. Industrial Market Revenue Estimates and Forecasts, 2021 - 2033 (USD Billion)
- 7.4. Commercial
- 7.4.1. Commercial Market Revenue Estimates and Forecasts, 2021 - 2033 (USD Billion)
- 7.5. Residential
- 7.5.1. Residential Market Revenue Estimates and Forecasts, 2021 - 2033 (USD Billion)
Chapter 8. Competitive Landscape
- 8.1. Company Categorization
- 8.2. Company Market Positioning
- 8.3. Company Heat Map Analysis
- 8.4. Company Profiles/Listing
- 8.4.1. ABB Group
- 8.4.1.1. Participant's Overview
- 8.4.1.2. Financial Performance
- 8.4.1.3. Product Benchmarking
- 8.4.1.4. Strategic Initiatives
- 8.4.2. Badger Meter Inc.
- 8.4.2.1. Participant's Overview
- 8.4.2.2. Financial Performance
- 8.4.2.3. Product Benchmarking
- 8.4.2.4. Strategic Initiatives
- 8.4.3. Diehl Metering U.S.
- 8.4.3.1. Participant's Overview
- 8.4.3.2. Financial Performance
- 8.4.3.3. Product Benchmarking
- 8.4.3.4. Strategic Initiatives
- 8.4.4. Elster Group GmbH (Honeywell International Inc.)
- 8.4.4.1. Participant's Overview
- 8.4.4.2. Financial Performance
- 8.4.4.3. Product Benchmarking
- 8.4.4.4. Strategic Initiatives
- 8.4.5. General Electric Company
- 8.4.5.1. Participant's Overview
- 8.4.5.2. Financial Performance
- 8.4.5.3. Product Benchmarking
- 8.4.5.4. Strategic Initiatives
- 8.4.6. Honeywell International Inc.
- 8.4.6.1. Participant's Overview
- 8.4.6.2. Financial Performance
- 8.4.6.3. Product Benchmarking
- 8.4.6.4. Strategic Initiatives
- 8.4.7. Itron Inc.
- 8.4.7.1. Participant's Overview
- 8.4.7.2. Financial Performance
- 8.4.7.3. Product Benchmarking
- 8.4.7.4. Strategic Initiatives
- 8.4.8. Kamstrup A/S
- 8.4.8.1. Participant's Overview
- 8.4.8.2. Financial Performance
- 8.4.8.3. Product Benchmarking
- 8.4.8.4. Strategic Initiatives
- 8.4.9. Landis+Gyr Group AG
- 8.4.9.1. Participant's Overview
- 8.4.9.2. Financial Performance
- 8.4.9.3. Product Benchmarking
- 8.4.9.4. Strategic Initiatives
- 8.4.10. Mueller Systems LLC
- 8.4.10.1. Participant's Overview
- 8.4.10.2. Financial Performance
- 8.4.10.3. Product Benchmarking
- 8.4.10.4. Strategic Initiatives
- 8.4.11. Neptune Technology Group Inc.
- 8.4.11.1. Participant's Overview
- 8.4.11.2. Financial Performance
- 8.4.11.3. Product Benchmarking
- 8.4.11.4. Strategic Initiatives
- 8.4.12. Sensus USA Inc. (Xylem Inc.)
- 8.4.12.1. Participant's Overview
- 8.4.12.2. Financial Performance
- 8.4.12.3. Product Benchmarking
- 8.4.12.4. Strategic Initiatives
- 8.4.13. Siemens AG
- 8.4.13.1. Participant's Overview
- 8.4.13.2. Financial Performance
- 8.4.13.3. Product Benchmarking
- 8.4.13.4. Strategic Initiatives
- 8.4.1. ABB Group
