|
|
市場調査レポート
商品コード
1751431
サイバーフィジカルシステムの市場規模、シェア、動向分析レポート:コンポーネント別、タイプ別、セキュリティ別、最終用途別、セグメント予測、2025年~2030年Cyber-physical Systems Market Size, Share, & Trends Analysis Report By Component (Hardware, Software, Services), By Type (Open-loop, Closed-loop), By Security (Embedded Security, Robotic Security), By End Use, And Segment Forecasts, 2025 - 2030 |
||||||
|
|||||||
カスタマイズ可能
|
|||||||


| サイバーフィジカルシステムの市場規模、シェア、動向分析レポート:コンポーネント別、タイプ別、セキュリティ別、最終用途別、セグメント予測、2025年~2030年 |
|
出版日: 2025年05月22日
発行: Grand View Research
ページ情報: 英文 120 Pages
納期: 2~10営業日
|

全表示
- 概要
- 図表
- 目次
サイバーフィジカルシステム市場動向:
世界のサイバーフィジカルシステム市場規模は、2024年に1,182億米ドルと推定され、2025年から2030年にかけて13.7%のCAGRで成長すると予測されています。
インダストリー4.0の採用拡大がCPS市場を牽引しています。
製造業や産業部門が自動化、データ交換、スマート技術をますます取り入れるようになる中、サイバーフィジカルシステム(CPS)は、物理機器とデジタルシステム間のリアルタイム調整を可能にする上で中心的な役割を果たしています。これらのシステムは、センサー、組み込みソフトウェア、ネットワーク機能を統合し、物理的プロセスを高精度と自律性で監視・制御します。
スマート工場、予知保全、自律的な生産ラインの需要は、業界情勢全体におけるCPSの展開を大きく後押ししています。世界中のスマートインフラとスマートシティ構想の台頭がCPS市場を牽引しています。政府や自治体は、都市のモビリティ、エネルギー管理、配水、公共の安全を強化するために、接続されたシステムに投資しています。サイバーフィジカルシステムは、デジタルインテリジェンスを物理インフラと連携させることで、この相互接続を可能にします。例えば、CPSは交通の流れを最適化したり、エネルギーの浪費をリアルタイムで検知したり、緊急対応システムを自動化したりするのに役立ち、都市環境における業務効率と生活の質を向上させる。
また、ヘルスケアや農業などの分野で精密さと自動化の重要性が高まっていることも、CPS市場の成長を後押ししています。ヘルスケアでは、CPSはロボット手術システム、スマート義肢、遠隔患者モニタリングツールなど、高精度とシームレスなソフトウェアとハードウェアの統合を必要とする高度な医療機器を可能にします。農業分野では、CPSはセンサーによる土壌モニタリング、自動灌漑システム、ドローンによる作物管理などを通じて精密農業をサポートします。これらの機能は、無駄の削減、資源利用の改善、全体的な生産性の向上に役立ち、CPSソリューションへのさらなる投資を促しています。
5Gとエッジコンピューティングインフラの急速な開発も、サイバーフィジカルシステムの採用を加速するもう一つの重要な要因です。これらのテクノロジーは、CPSがリアルタイムアプリケーションで効率的に機能するために必要な低レイテンシーと広帯域幅を提供し、特に自律走行車やロボット製造セルなど、時間的制約のあるデータ交換が重要な環境では重要です。このような次世代ネットワークの拡大により、CPSアプリケーションはより堅牢でスケーラブルになり、ミッションクリティカルなオペレーションに適してきています。
さらに、人工知能(AI)や機械学習(ML)技術の成長がCPSの価値を高めています。これらのインテリジェント・システムは、物理プロセスからのデータをリアルタイムで分析し、パフォーマンスを最適化したり、ダウンタイムを削減したり、変化する状況に適応したりする自律的な決定を下すことができます。AIをCPSに統合することで、CPSはリアクティブなシステムからプロアクティブなシステムへと変化し、ロジスティクスや環境モニタリングから航空宇宙や自律システムまで、あらゆる分野での応用が拡大します。このAIとCPSの融合は、業界全体のイノベーションと需要を促進する強力なエコシステムを生み出します。
目次
第1章 調査手法と範囲
第2章 エグゼクティブサマリー
第3章 サイバーフィジカルシステム(CPS)の変数、動向、範囲
- 市場イントロダクション/系統展望
- 業界バリューチェーン分析
- 市場力学
- 市場促進要因分析
- 市場抑制要因分析
- 業界の機会
- サイバーフィジカルシステム(CPS)分析ツール
- ポーター分析
- PESTEL分析
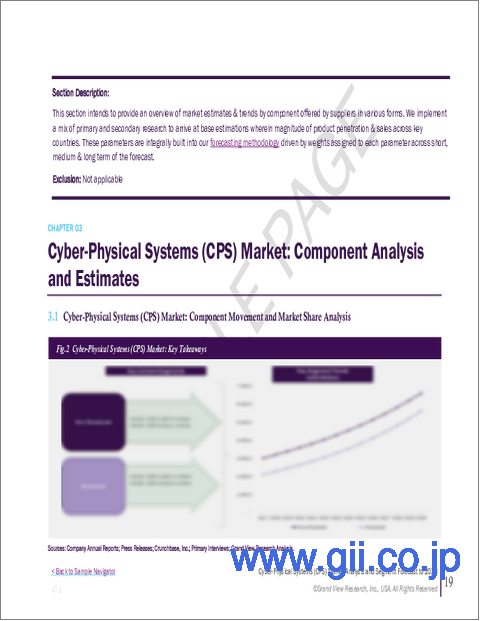
第4章 サイバーフィジカルシステム(CPS):コンポーネント別の推定・動向分析
- サイバーフィジカルシステム(CPS)市場:コンポーネント別分析と市場シェア別、2024年と2030年
- ハードウェア
- ハードウェア市場推計・予測、2018年-2030年
- ソフトウェア
- ソフトウェア市場推計・予測、2018年-2030年
- サービス
- サービス市場推計・予測、2018年-2030年
第5章 サイバーフィジカルシステム(CPS):タイプ別推定・動向分析
- サイバーフィジカルシステム(CPS)市場:タイプ別分析と市場シェア、2024年と2030年
- オープンループ
- オープンループ市場推計・予測、2018年~2030年
- クローズドループ
- クローズドループ市場推計・予測、2018年~2030年
第6章 サイバーフィジカルシステム(CPS):セキュリティ別推定・動向分析
- サイバーフィジカルシステム(CPS)市場:セキュリティ別分析と市場シェア別、2024年と2030年
- 組み込みセキュリティ
- 組み込みセキュリティ市場推計・予測、2018年~2030年
- 産業用制御システム(ICS)のセキュリティ
- 産業用制御システム(ICS)セキュリティ市場推計・予測、2018年~2030年
- ロボットセキュリティ
- ロボットセキュリティ市場推計・予測、2018年-2030年
- モノのインターネット(IoT)セキュリティ
- モノのインターネット(IoT)セキュリティ市場推計・予測、2018年~2030年
- その他
- その他市場推計・予測、2018年-2030年
第7章 サイバーフィジカルシステム(CPS):最終用途別推定・動向分析
- サイバーフィジカルシステム(CPS)市場:最終用途別分析と市場シェア別、2024年と2030年
- ヘルスケア
- ヘルスケア市場推計・予測、2018年-2030年
- 航空宇宙および防衛
- 航空宇宙および防衛市場推計・予測、2018年~2030年
- 自動車
- 自動車市場推計・予測、2018年~2030年
- エネルギーとユーティリティ
- エネルギーとユーティリティ市場推計・予測、2018年~2030年
- 製造業
- 製造業市場推計・予測、2018年~2030年
- 家電
- 家電市場推計・予測、2018年~2030年
- その他
- その他市場推計・予測、2018年-2030年
第8章 サイバーフィジカルシステム(CPS)市場:地域推定・動向分析
- サイバーフィジカルシステム(CPS)市場シェア、地域別、2024年および2030年、10億米ドル
- 北米
- コンポーネント別、2018年~2030年
- タイプ別、2018年~2030年
- セキュリティ別、2018年~2030年
- 最終用途別、2018年~2030年
- 米国
- カナダ
- メキシコ
- 欧州
- コンポーネント別、2018年~2030年
- タイプ別、2018年~2030年
- セキュリティ別、2018年~2030年
- 最終用途別、2018年~2030年
- 英国
- ドイツ
- フランス
- アジア太平洋
- コンポーネント別、2018年~2030年
- タイプ別、2018年~2030年
- セキュリティ別、2018年~2030年
- 最終用途別、2018年~2030年
- 中国
- インド
- 日本
- オーストラリア
- 韓国
- ラテンアメリカ
- コンポーネント別、2018年~2030年
- タイプ別、2018年~2030年
- セキュリティ別、2018年~2030年
- 最終用途別、2018年~2030年
- ブラジル
- 中東・アフリカ
- コンポーネント別、2018年~2030年
- タイプ別、2018年~2030年
- セキュリティ別、2018年~2030年
- 最終用途別、2018年~2030年
- アラブ首長国連邦
- サウジアラビア
- 南アフリカ
第9章 競合情勢
- 主要市場参入企業による最近の動向と影響分析
- 企業分類
- 企業市場シェア分析、2024年
- 企業ヒートマップ分析
- 戦略マッピング
- 拡大
- 合併と買収
- パートナーシップとコラボレーション
- 製品の発売
- 最近の動向
- 企業プロファイル
- ABB
- Honeywell International Inc.
- Siemens AG
- Schneider Electric
- Rockwell Automation
- General Electric Company
- Hitachi, Ltd.
- Toshiba Corporation
- Robert Bosch GmbH
- Cisco Systems, Inc.
- Emerson Electric Co.
- Intel Corporation
- IBM Corporation
- Microsoft Corporation
- Yokogawa Electric Corporation
- Claroty
List of Tables
- Table 1 Global cyber-physical systems market size estimates & forecasts 2018 - 2030 (USD Billion)
- Table 2 Global cyber-physical systems market, by region, 2018 - 2030 (USD Billion)
- Table 3 Global cyber-physical systems market, by component, 2018 - 2030 (USD Billion)
- Table 4 Global cyber-physical systems market, by type, 2018 - 2030 (USD Billion)
- Table 5 Global cyber-physical systems market, by security, 2018 - 2030 (USD Billion)
- Table 6 Global cyber-physical systems market, by end use, 2018 - 2030 (USD Billion)
- Table 7 Hardware market, by region, 2018 - 2030 (USD Billion)
- Table 8 Software market, by region, 2018 - 2030 (USD Billion)
- Table 9 Services market, by region, 2018 - 2030 (USD Billion)
- Table 10 Open-loop market, by region, 2018 - 2030 (USD Billion)
- Table 11 Closed-loop market, by region, 2018 - 2030 (USD Billion)
- Table 12 Embedded security cyber-physical systems market, by region, 2018 - 2030 (USD Billion)
- Table 13 Industrial control systems (ICS) security cyber-physical systems market, by region, 2018 - 2030 (USD Billion)
- Table 14 Robotic security cyber-physical systems market, by region, 2018 - 2030 (USD Billion)
- Table 15 Internet of Things (IoT) security cyber-physical systems market, by region, 2018 - 2030 (USD Billion)
- Table 16 Others cyber-physical systems market, by region, 2018 - 2030 (USD Billion)
- Table 17 Aerospace and defence cyber-physical systems market, by region, 2018 - 2030 (USD Billion)
- Table 18 Automotive cyber-physical systems market, by region, 2018 - 2030 (USD Billion)
- Table 19 Energy and utility cyber-physical systems market, by region, 2018 - 2030 (USD Billion)
- Table 20 Healthcare cyber-physical systems market, by region, 2018 - 2030 (USD Billion)
- Table 21 Manufacturing cyber-physical systems market, by region, 2018 - 2030 (USD Billion)
- Table 22 Consumer electronics cyber-physical systems market, by region, 2018 - 2030 (USD Billion)
- Table 23 Others cyber-physical systems market, by region, 2018 - 2030 (USD Billion)
- Table 24 North America cyber-physical systems market, by component, 2018 - 2030 (USD Billion)
- Table 25 North America cyber-physical systems market, by type, 2018 - 2030 (USD Billion)
- Table 26 North America cyber-physical systems market, by security, 2018 - 2030 (USD Billion)
- Table 27 North America cyber-physical systems market, by end use, 2018 - 2030 (USD Billion)
- Table 28 U.S. cyber-physical systems market, by component, 2018 - 2030 (USD Billion)
- Table 29 U.S. cyber-physical systems market, by type, 2018 - 2030 (USD Billion)
- Table 30 U.S. cyber-physical systems market, by security, 2018 - 2030 (USD Billion)
- Table 31 U.S. cyber-physical systems market, by end use, 2018 - 2030 (USD Billion)
- Table 32 Canada cyber-physical systems market, by component, 2018 - 2030 (USD Billion)
- Table 33 Canada cyber-physical systems market, by type, 2018 - 2030 (USD Billion)
- Table 34 Canada cyber-physical systems market, by security, 2018 - 2030 (USD Billion)
- Table 35 Canada cyber-physical systems market, by end use, 2018 - 2030 (USD Billion)
- Table 36 Mexico cyber-physical systems market, by component, 2018 - 2030 (USD Billion)
- Table 37 Mexico cyber-physical systems market, by type, 2018 - 2030 (USD Billion)
- Table 38 Mexico cyber-physical systems market, by security, 2018 - 2030 (USD Billion)
- Table 39 Mexico cyber-physical systems market, by end use, 2018 - 2030 (USD Billion)
- Table 40 Europe cyber-physical systems market, by component, 2018 - 2030 (USD Billion)
- Table 41 Europe cyber-physical systems market, by type, 2018 - 2030 (USD Billion)
- Table 42 Europe cyber-physical systems market, by security, 2018 - 2030 (USD Billion)
- Table 43 Europe cyber-physical systems market, by end use, 2018 - 2030 (USD Billion)
- Table 44 UK cyber-physical systems market, by component, 2018 - 2030 (USD Billion)
- Table 45 UK cyber-physical systems market, by type, 2018 - 2030 (USD Billion)
- Table 46 UK cyber-physical systems market, by security, 2018 - 2030 (USD Billion)
- Table 47 UK cyber-physical systems market, by end use, 2018 - 2030 (USD Billion)
- Table 48 Germany cyber-physical systems market, by component, 2018 - 2030 (USD Billion)
- Table 49 Germany cyber-physical systems market, by type, 2018 - 2030 (USD Billion)
- Table 50 Germany cyber-physical systems market, by security, 2018 - 2030 (USD Billion)
- Table 51 Germany cyber-physical systems market, by end use, 2018 - 2030 (USD Billion)
- Table 52 France cyber-physical systems market, by component, 2018 - 2030 (USD Billion)
- Table 53 France cyber-physical systems market, by type, 2018 - 2030 (USD Billion)
- Table 54 France cyber-physical systems market, by security, 2018 - 2030 (USD Billion)
- Table 55 France cyber-physical systems market, by end use, 2018 - 2030 (USD Billion)
- Table 56 Asia Pacific cyber-physical systems market, by component, 2018 - 2030 (USD Billion)
- Table 57 Asia Pacific cyber-physical systems market, by type, 2018 - 2030 (USD Billion)
- Table 58 Asia Pacific cyber-physical systems market, by security, 2018 - 2030 (USD Billion)
- Table 59 Asia Pacific cyber-physical systems market, by end use, 2018 - 2030 (USD Billion)
- Table 60 China cyber-physical systems market, by component, 2018 - 2030 (USD Billion)
- Table 61 China cyber-physical systems market, by type, 2018 - 2030 (USD Billion)
- Table 62 China cyber-physical systems market, by security, 2018 - 2030 (USD Billion)
- Table 63 China cyber-physical systems market, by end use, 2018 - 2030 (USD Billion)
- Table 64 India cyber-physical systems market, by component, 2018 - 2030 (USD Billion)
- Table 65 India cyber-physical systems market, by type, 2018 - 2030 (USD Billion)
- Table 66 India cyber-physical systems market, by security, 2018 - 2030 (USD Billion)
- Table 67 India cyber-physical systems market, by end use, 2018 - 2030 (USD Billion)
- Table 68 Japan cyber-physical systems market, by component, 2018 - 2030 (USD Billion)
- Table 69 Japan cyber-physical systems market, by type, 2018 - 2030 (USD Billion)
- Table 70 Japan cyber-physical systems market, by security, 2018 - 2030 (USD Billion)
- Table 71 Japan cyber-physical systems market, by end use, 2018 - 2030 (USD Billion)
- Table 72 Australia cyber-physical systems market, by component, 2018 - 2030 (USD Billion)
- Table 73 Australia cyber-physical systems market, by type, 2018 - 2030 (USD Billion)
- Table 74 Australia cyber-physical systems market, by security, 2018 - 2030 (USD Billion)
- Table 75 Australia cyber-physical systems market, by end use, 2018 - 2030 (USD Billion)
- Table 76 South Korea cyber-physical systems market, by component, 2018 - 2030 (USD Billion)
- Table 77 South Korea cyber-physical systems market, by type, 2018 - 2030 (USD Billion)
- Table 78 South Korea cyber-physical systems market, by security, 2018 - 2030 (USD Billion)
- Table 79 South Korea cyber-physical systems market, by end use, 2018 - 2030 (USD Billion)
- Table 80 Latin America cyber-physical systems market, by component, 2018 - 2030 (USD Billion)
- Table 81 Latin America cyber-physical systems market, by type, 2018 - 2030 (USD Billion)
- Table 82 Latin America cyber-physical systems market, by security, 2018 - 2030 (USD Billion)
- Table 83 Latin America cyber-physical systems market, by end use, 2018 - 2030 (USD Billion)
- Table 84 Brazil cyber-physical systems market, by component, 2018 - 2030 (USD Billion)
- Table 85 Brazil cyber-physical systems market, by type, 2018 - 2030 (USD Billion)
- Table 86 Brazil cyber-physical systems market, by security, 2018 - 2030 (USD Billion)
- Table 87 Brazil cyber-physical systems market, by end use, 2018 - 2030 (USD Billion)
- Table 88 MEA cyber-physical systems market, by component, 2018 - 2030 (USD Billion)
- Table 89 MEA cyber-physical systems market, by type, 2018 - 2030 (USD Billion)
- Table 90 MEA cyber-physical systems market, by security, 2018 - 2030 (USD Billion)
- Table 91 MEA cyber-physical systems market, by end use, 2018 - 2030 (USD Billion)
- Table 92 UAE cyber-physical systems market, by component, 2018 - 2030 (USD Billion)
- Table 93 UAE cyber-physical systems market, by type, 2018 - 2030 (USD Billion)
- Table 94 UAE cyber-physical systems market, by security, 2018 - 2030 (USD Billion)
- Table 95 UAE cyber-physical systems market, by end use, 2018 - 2030 (USD Billion)
- Table 96 Saudi Arabia cyber-physical systems market, by component, 2018 - 2030 (USD Billion)
- Table 97 Saudi Arabia cyber-physical systems market, by type, 2018 - 2030 (USD Billion)
- Table 98 Saudi Arabia cyber-physical systems market, by security, 2018 - 2030 (USD Billion)
- Table 99 Saudi Arabia cyber-physical systems market, by end use, 2018 - 2030 (USD Billion)
- Table 100 South Africa cyber-physical systems market, by component, 2018 - 2030 (USD Billion)
- Table 101 South Africa cyber-physical systems market, by type, 2018 - 2030 (USD Billion)
- Table 102 South Africa cyber-physical systems market, by security, 2018 - 2030 (USD Billion)
- Table 103 South Africa cyber-physical systems market, by end use, 2018 - 2030 (USD Billion)
List of Figures
- Fig. 1 Cyber-physical systems market segmentation
- Fig. 2 Information procurement
- Fig. 3 Data analysis models
- Fig. 4 Market formulation and validation
- Fig. 5 Data validating & publishing
- Fig. 6 Market snapshot
- Fig. 7 Segment snapshot, by component
- Fig. 8 Segment snapshot, by type
- Fig. 9 Segment snapshot, by security
- Fig. 10 Segment snapshot by end use
- Fig. 11 Competitive landscape snapshot
- Fig. 12 Cyber-physical systems market value, 2018 - 2030 (USD Billion)
- Fig. 13 Cyber-physical systems market - Industry value chain analysis
- Fig. 14 Cyber-physical systems market - Market trends
- Fig. 15 Cyber-physical systems market: Porter's analysis
- Fig. 16 Cyber-physical systems market: PESTEL analysis
- Fig. 17 Cyber-physical systems market, by component: Key takeaways
- Fig. 18 Cyber-physical systems market, by component: Market share, 2024 & 2030
- Fig. 19 Hardware market estimates & forecasts, 2018 - 2030 (USD Billion)
- Fig. 20 Software market estimates & forecasts, 2018 - 2030 (USD Billion)
- Fig. 21 Services market estimates & forecasts, 2018 - 2030 (USD Billion)
- Fig. 22 Cyber-physical systems market, by type: Key takeaways
- Fig. 23 Cyber-physical systems market, by type: Market share, 2024 & 2030
- Fig. 24 Open-loop market estimates & forecasts, 2018 - 2030 (USD Billion)
- Fig. 25 Closed-loop market estimates & forecasts, 2018 - 2030 (USD Billion)
- Fig. 26 Cyber-physical systems market, by security: Key takeaways
- Fig. 27 Cyber-physical systems market, by security: Market share, 2024 & 2030
- Fig. 28 Embedded security cyber-physical systems market estimates & forecasts, 2018 - 2030 (USD Billion)
- Fig. 29 Industrial control systems (ICS) security cyber-physical systems market estimates & forecasts, 2018 - 2030 (USD Billion)
- Fig. 30 Robotic security cyber-physical systems market estimates & forecasts, 2018 - 2030 (USD Billion)
- Fig. 31 Internet of things (IoT) security cyber-physical systems market estimates & forecasts, 2018 - 2030 (USD Billion)
- Fig. 32 Others cyber-physical systems market estimates & forecasts, 2018 - 2030 (USD Billion)
- Fig. 33 Cyber-physical systems market, by end use: Key takeaways
- Fig. 34 Cyber-physical systems market, by end use: Market share, 2024 & 2030
- Fig. 35 Aerospace and defence cyber-physical systems market estimates & forecasts, 2018 - 2030 (USD Billion)
- Fig. 36 Automotive cyber-physical systems market estimates & forecasts, 2018 - 2030 (USD Billion)
- Fig. 37 Energy and utility cyber-physical systems market estimates & forecasts, 2018 - 2030 (USD Billion)
- Fig. 38 Healthcare cyber-physical systems market estimates & forecasts, 2018 - 2030 (USD Billion)
- Fig. 39 Manufacturing cyber-physical systems market estimates & forecasts, 2018 - 2030 (USD Billion)
- Fig. 40 Consumer electronics cyber-physical systems market estimates & forecasts, 2018 - 2030 (USD Billion)
- Fig. 41 Others cyber-physical systems market estimates & forecasts, 2018 - 2030 (USD Billion)
- Fig. 42 Global cyber-physical systems market revenue, by region, 2024 & 2030 (USD Billion)
- Fig. 43 North America cyber-physical systems market estimates & forecasts, 2018 - 2030 (USD Billion)
- Fig. 44 U.S. cyber-physical systems market estimates & forecasts, 2018 - 2030 (USD Billion)
- Fig. 45 Canada cyber-physical systems market estimates & forecasts, 2018 - 2030 (USD Billion)
- Fig. 46 Mexico cyber-physical systems market estimates & forecasts, 2018 - 2030 (USD Billion)
- Fig. 47 Europe cyber-physical systems market estimates & forecasts, 2018 - 2030 (USD Billion)
- Fig. 48 UK cyber-physical systems market estimates & forecasts, 2018 - 2030 (USD Billion)
- Fig. 49 Germany cyber-physical systems market estimates & forecasts, 2018 - 2030 (USD Billion)
- Fig. 50 France cyber-physical systems market estimates & forecasts, 2018 - 2030 (USD Billion)
- Fig. 51 Asia Pacific cyber-physical systems market estimates & forecasts, 2018 - 2030 (USD Billion)
- Fig. 52 China cyber-physical systems market estimates & forecasts, 2018 - 2030 (USD Billion)
- Fig. 53 India cyber-physical systems market estimates & forecasts, 2018 - 2030 (USD Billion)
- Fig. 54 Japan cyber-physical systems Market estimates & forecasts, 2018 - 2030 (USD Billion)
- Fig. 55 Australia cyber-physical systems market estimates & forecasts, 2018 - 2030 (USD Billion)
- Fig. 56 South Korea cyber-physical systems Market estimates & forecasts, 2018 - 2030 (USD Billion)
- Fig. 57 Latin America cyber-physical systems market estimates & forecasts, 2018 - 2030 (USD Billion)
- Fig. 58 Brazil cyber-physical systems market estimates & forecasts, 2018 - 2030 (USD Billion)
- Fig. 59 Middle East & Africa cyber-physical systems market estimates & forecasts, 2018 - 2030 (USD Billion)
- Fig. 60 UAE cyber-physical systems market estimates & forecasts, 2018 - 2030 (USD Billion)
- Fig. 61 Saudi Arabia cyber-physical systems market estimates & forecasts, 2018 - 2030 (USD Billion)
- Fig. 62 South Africa cyber-physical systems market estimates & forecasts, 2018 - 2030 (USD Billion)
- Fig. 63 Key company categorization
- Fig. 64 Cyber-physical systems market - Key company market share analysis, 2024
- Fig. 65 Strategic framework
Cyber-physical Systems Market Trends:
The global cyber-physical systems market size was estimated at USD 118.20 billion in 2024 and is anticipated to grow at a CAGR of 13.7% from 2025 to 2030 The growing adoption of Industry 4.0 is driving the CPS market.
As manufacturing and industrial sectors increasingly embrace automation, data exchange, and smart technologies, Cyber-physical systems (CPS) plays a central role in enabling real-time coordination between physical equipment and digital systems. These systems integrate sensors, embedded software, and networking capabilities to monitor and control physical processes with a high degree of accuracy and autonomy.
The demand for smart factories, predictive maintenance, and autonomous production lines significantly boosts the deployment of CPS across industrial landscapes. The rise of smart infrastructure and smart city initiatives around the world is driving the CPS market. Governments and municipalities invest in connected systems to enhance urban mobility, energy management, water distribution, and public safety. Cyber-physical systems enable this interconnectivity by linking digital intelligence with the physical infrastructure. For example, CPS can help optimize traffic flow, detect energy wastage in real-time, or automate emergency response systems, improving operational efficiency and quality of life in urban settings.
The increasing importance of precision and automation in sectors like healthcare and agriculture also fuels the CPS market growth. In healthcare, CPS enables advanced medical devices such as robotic surgery systems, smart prosthetics, and remote patient monitoring tools that require high accuracy and seamless software and hardware integration. In agriculture, CPS supports precision farming through sensor-based soil monitoring, automated irrigation systems, and drone-assisted crop management. These capabilities help reduce waste, improve resource utilization, and increase overall productivity, prompting further investment in CPS solutions.
The rapid development of 5G and edge computing infrastructure is another crucial factor accelerating the adoption of cyber-physical systems. These technologies offer the low latency and high bandwidth necessary for CPS to function efficiently in real-time applications, particularly in environments where time-sensitive data exchange is critical, such as autonomous vehicles or robotic manufacturing cells. With the expansion of these next-gen networks, CPS applications are becoming more robust, scalable, and suitable for mission-critical operations.
Furthermore, the growth of artificial intelligence (AI) and machine learning (ML) technologies is amplifying the value of CPS. These intelligent systems can analyze data from physical processes in real-time and make autonomous decisions that optimize performance, reduce downtime, or adapt to changing conditions. Integrating AI into CPS transforms them from reactive to proactive systems, expanding their application in everything from logistics and environmental monitoring to aerospace and autonomous systems. This convergence of AI and CPS creates a powerful ecosystem that drives innovation and demand across industries.
Global Cyber-physical Systems Market Report Segmentation
This report forecasts revenue growth at the global, regional, and country levels and provides an analysis of the latest industry trends in each of the sub-segments from 2018 to 2030. For this study, Grand View Research has segmented the global cyber-physical systems market report based on component, type, security, end use, and region:
- Component Outlook (Revenue, USD Billion, 2018 - 2030)
- Hardware
- Software
- Services
- Type Outlook (Revenue, USD Billion, 2018 - 2030)
- Open-Loop
- Closed-Loop
- Security Outlook (Revenue, USD Billion, 2018 - 2030)
- Embedded Security
- Industrial Control Systems (ICS) Security
- Robotic Security
- Internet of Things (IoT) Security
- Others
- End Use Outlook (Revenue, USD Billion, 2018 - 2030)
- Aerospace and Defence
- Automotive
- Energy and Utility
- Healthcare
- Manufacturing
- Consumer Electronics
- Others
- Regional Outlook (Revenue, USD Billion, 2018 - 2030)
- North America
- U.S.
- Canada
- Mexico
- Europe
- Germany
- UK
- France
- Asia Pacific
- China
- India
- Japan
- South Korea
- Australia
- Latin America
- Brazil
- Middle East & Africa
- UAE
- Saudi Arabia
- South Africa
Table of Contents
Chapter 1. Methodology and Scope
- 1.1. Market Segmentation and Scope
- 1.2. Market Definitions
- 1.3. Research Methodology
- 1.3.1. Information Procurement
- 1.3.2. Information or Data Analysis
- 1.3.3. Market Formulation & Data Visualization
- 1.3.4. Data Validation & Publishing
- 1.4. Research Scope and Assumptions
- 1.4.1. List of Data Sources
Chapter 2. Executive Summary
- 2.1. Market Outlook
- 2.2. Segment Outlook
- 2.3. Competitive Insights
Chapter 3. Cyber-Physical Systems (CPS) Variables, Trends, & Scope
- 3.1. Market Introduction/Lineage Outlook
- 3.2. Industry Value Chain Analysis
- 3.3. Market Dynamics
- 3.3.1. Market Drivers Analysis
- 3.3.2. Market Restraints Analysis
- 3.3.3. Industry Opportunities
- 3.4. Cyber-Physical Systems (CPS) Analysis Tools
- 3.4.1. Porter's Analysis
- 3.4.1.1. Bargaining power of the suppliers
- 3.4.1.2. Bargaining power of the buyers
- 3.4.1.3. Threats of substitution
- 3.4.1.4. Threats from new entrants
- 3.4.1.5. Competitive rivalry
- 3.4.2. PESTEL Analysis
- 3.4.2.1. Political landscape
- 3.4.2.2. Economic and Social Landscape
- 3.4.2.3. Technological landscape
- 3.4.2.4. Environmental landscape
- 3.4.2.5. Legal landscape
- 3.4.1. Porter's Analysis
Chapter 4. Cyber-Physical Systems (CPS): Component Estimates & Trend Analysis
- 4.1. Cyber-Physical Systems (CPS) Market, By Component Analysis & Market Share, 2024 & 2030
- 4.2. Hardware
- 4.2.1. Hardware market estimates and forecasts, 2018 - 2030 (USD Billion)
- 4.3. Software
- 4.3.1. Software market estimates and forecasts, 2018 - 2030 (USD Billion)
- 4.4. Services
- 4.4.1. Services market estimates and forecasts, 2018 - 2030 (USD Billion)
Chapter 5. Cyber-Physical Systems (CPS): Type Estimates & Trend Analysis
- 5.1. Cyber-Physical Systems (CPS) Market, By Type Analysis & Market Share, 2024 & 2030
- 5.2. Open-Loop
- 5.2.1. Open-loop market estimates and forecasts, 2018 - 2030 (USD Billion)
- 5.3. Closed-Loop
- 5.3.1. Closed-loop market estimates and forecasts, 2018 - 2030 (USD Billion)
Chapter 6. Cyber-Physical Systems (CPS): Security Estimates & Trend Analysis
- 6.1. Cyber-Physical Systems (CPS) Market, By Security Analysis & Market Share, 2024 & 2030
- 6.2. Embedded Security
- 6.2.1. Embedded security market estimates and forecasts, 2018 - 2030 (USD Billion)
- 6.3. Industrial Control Systems (ICS) Security
- 6.3.1. Industrial control systems (ICS) security market estimates and forecasts, 2018 - 2030 (USD Billion)
- 6.4. Robotic Security
- 6.4.1. Robotic security market estimates and forecasts, 2018 - 2030 (USD Billion)
- 6.5. Internet of Things (IoT) Security
- 6.5.1. Internet of things (IoT) security market estimates and forecasts, 2018 - 2030 (USD Billion)
- 6.6. Others
- 6.6.1. Others market estimates and forecasts, 2018 - 2030 (USD Billion)
Chapter 7. Cyber-Physical Systems (CPS): End Use Estimates & Trend Analysis
- 7.1. Cyber-Physical Systems (CPS) Market, By End Use Analysis & Market Share, 2024 & 2030
- 7.2. Healthcare
- 7.2.1. Healthcare market estimates and forecasts, 2018 - 2030 (USD Billion)
- 7.3. Aerospace and Defence
- 7.3.1. Aerospace and defence market estimates and forecasts, 2018 - 2030 (USD Billion)
- 7.4. Automotive
- 7.4.1. Automotive market estimates and forecasts, 2018 - 2030 (USD Billion)
- 7.5. Energy and Utility
- 7.5.1. Energy and utility market estimates and forecasts, 2018 - 2030 (USD Billion)
- 7.6. Manufacturing
- 7.6.1. Manufacturing market estimates and forecasts, 2018 - 2030 (USD Billion)
- 7.7. Consumer Electronics
- 7.7.1. Consumer electronics market estimates and forecasts, 2018 - 2030 (USD Billion)
- 7.8. Others
- 7.8.1. Others market estimates and forecasts, 2018 - 2030 (USD Billion)
Chapter 8. Cyber-Physical Systems (CPS) Market: Regional Estimates & Trend Analysis
- 8.1. Cyber-Physical Systems (CPS) Market Share, By Region, 2024 & 2030, USD Billion
- 8.2. North America
- 8.2.1. Market Estimates and Forecasts, 2018 - 2030 (USD Billion)
- 8.2.2. Market estimates and forecast by component, 2018 - 2030 (USD Billion)
- 8.2.3. Market estimates and forecast by type, 2018 - 2030 (USD Billion)
- 8.2.4. Market estimates and forecast by security, 2018 - 2030 (USD Billion)
- 8.2.5. Market estimates and forecast by end use, 2018 - 2030 (USD Billion)
- 8.2.6. U.S.
- 8.2.6.1. Market Estimates and Forecasts, 2018 - 2030 (USD Billion)
- 8.2.6.2. Market estimates and forecast by component, 2018 - 2030 (USD Billion)
- 8.2.6.3. Market estimates and forecast by type, 2018 - 2030 (USD Billion)
- 8.2.6.4. Market estimates and forecast by security, 2018 - 2030 (USD Billion)
- 8.2.6.5. Market estimates and forecast by end use, 2018 - 2030 (USD Billion)
- 8.2.7. Canada
- 8.2.7.1. Market Estimates and Forecasts, 2018 - 2030 (USD Billion)
- 8.2.7.2. Market estimates and forecast by component, 2018 - 2030 (USD Billion)
- 8.2.7.3. Market estimates and forecast by type, 2018 - 2030 (USD Billion)
- 8.2.7.4. Market estimates and forecast by security, 2018 - 2030 (USD Billion)
- 8.2.7.5. Market estimates and forecast by end use, 2018 - 2030 (USD Billion)
- 8.2.8. Mexico
- 8.2.8.1. Market Estimates and Forecasts, 2018 - 2030 (USD Billion)
- 8.2.8.2. Market estimates and forecast by component, 2018 - 2030 (USD Billion)
- 8.2.8.3. Market estimates and forecast by type, 2018 - 2030 (USD Billion)
- 8.2.8.4. Market estimates and forecast by security, 2018 - 2030 (USD Billion)
- 8.2.8.5. Market estimates and forecast by end use, 2018 - 2030 (USD Billion)
- 8.3. Europe
- 8.3.1. Market estimates and forecast by component, 2018 - 2030 (USD Billion)
- 8.3.2. Market estimates and forecast by type, 2018 - 2030 (USD Billion)
- 8.3.3. Market estimates and forecast by security, 2018 - 2030 (USD Billion)
- 8.3.4. Market estimates and forecast by end use, 2018 - 2030 (USD Billion)
- 8.3.5. UK
- 8.3.5.1. Market Estimates and Forecasts, 2018 - 2030 (USD Billion)
- 8.3.5.2. Market estimates and forecast by component, 2018 - 2030 (USD Billion)
- 8.3.5.3. Market estimates and forecast by type, 2018 - 2030 (USD Billion)
- 8.3.5.4. Market estimates and forecast by security, 2018 - 2030 (USD Billion)
- 8.3.5.5. Market estimates and forecast by end use, 2018 - 2030 (USD Billion)
- 8.3.6. Germany
- 8.3.6.1. Market Estimates and Forecasts, 2018 - 2030 (USD Billion)
- 8.3.6.2. Market estimates and forecast by component, 2018 - 2030 (USD Billion)
- 8.3.6.3. Market estimates and forecast by type, 2018 - 2030 (USD Billion)
- 8.3.6.4. Market estimates and forecast by security, 2018 - 2030 (USD Billion)
- 8.3.6.5. Market estimates and forecast by end use, 2018 - 2030 (USD Billion)
- 8.3.7. France
- 8.3.7.1. Market Estimates and Forecasts, 2018 - 2030 (USD Billion)
- 8.3.7.2. Market estimates and forecast by component, 2018 - 2030 (USD Billion)
- 8.3.7.3. Market estimates and forecast by type, 2018 - 2030 (USD Billion)
- 8.3.7.4. Market estimates and forecast by security, 2018 - 2030 (USD Billion)
- 8.3.7.5. Market estimates and forecast by end use, 2018 - 2030 (USD Billion)
- 8.4. Asia Pacific
- 8.4.1. Market Estimates and Forecasts, 2018 - 2030 (USD Billion)
- 8.4.2. Market estimates and forecast by component, 2018 - 2030 (USD Billion)
- 8.4.3. Market estimates and forecast by type, 2018 - 2030 (USD Billion)
- 8.4.4. Market estimates and forecast by security, 2018 - 2030 (USD Billion)
- 8.4.5. Market estimates and forecast by end use, 2018 - 2030 (USD Billion)
- 8.4.6. China
- 8.4.6.1. Market Estimates and Forecasts, 2018 - 2030 (USD Billion)
- 8.4.6.2. Market estimates and forecast by component, 2018 - 2030 (USD Billion)
- 8.4.6.3. Market estimates and forecast by type, 2018 - 2030 (USD Billion)
- 8.4.6.4. Market estimates and forecast by security, 2018 - 2030 (USD Billion)
- 8.4.6.5. Market estimates and forecast by end use, 2018 - 2030 (USD Billion)
- 8.4.7. India
- 8.4.7.1. Market Estimates and Forecasts, 2018 - 2030 (USD Billion)
- 8.4.7.2. Market estimates and forecast by component, 2018 - 2030 (USD Billion)
- 8.4.7.3. Market estimates and forecast by type, 2018 - 2030 (USD Billion)
- 8.4.7.4. Market estimates and forecast by security, 2018 - 2030 (USD Billion)
- 8.4.7.5. Market estimates and forecast by end use, 2018 - 2030 (USD Billion)
- 8.4.8. Japan
- 8.4.8.1. Market Estimates and Forecasts, 2018 - 2030 (USD Billion)
- 8.4.8.2. Market estimates and forecast by component, 2018 - 2030 (USD Billion)
- 8.4.8.3. Market estimates and forecast by type, 2018 - 2030 (USD Billion)
- 8.4.8.4. Market estimates and forecast by security, 2018 - 2030 (USD Billion)
- 8.4.8.5. Market estimates and forecast by end use, 2018 - 2030 (USD Billion)
- 8.4.9. Australia
- 8.4.9.1. Market Estimates and Forecasts, 2018 - 2030 (USD Billion)
- 8.4.9.2. Market estimates and forecast by component, 2018 - 2030 (USD Billion)
- 8.4.9.3. Market estimates and forecast by type, 2018 - 2030 (USD Billion)
- 8.4.9.4. Market estimates and forecast by security, 2018 - 2030 (USD Billion)
- 8.4.9.5. Market estimates and forecast by end use, 2018 - 2030 (USD Billion)
- 8.4.10. South Korea
- 8.4.10.1. Market Estimates and Forecasts, 2018 - 2030 (USD Billion)
- 8.4.10.2. Market estimates and forecast by component, 2018 - 2030 (USD Billion)
- 8.4.10.3. Market estimates and forecast by type, 2018 - 2030 (USD Billion)
- 8.4.10.4. Market estimates and forecast by security, 2018 - 2030 (USD Billion)
- 8.4.10.5. Market estimates and forecast by end use, 2018 - 2030 (USD Billion)
- 8.5. Latin America
- 8.5.1. Market Estimates and Forecasts, 2018 - 2030 (USD Billion)
- 8.5.2. Market estimates and forecast by component, 2018 - 2030 (USD Billion)
- 8.5.3. Market estimates and forecast by type, 2018 - 2030 (USD Billion)
- 8.5.4. Market estimates and forecast by security, 2018 - 2030 (USD Billion)
- 8.5.5. Market estimates and forecast by end use, 2018 - 2030 (USD Billion)
- 8.5.6. Brazil
- 8.5.6.1. Market Estimates and Forecasts, 2018 - 2030 (USD Billion)
- 8.5.6.2. Market estimates and forecast by component, 2018 - 2030 (USD Billion)
- 8.5.6.3. Market estimates and forecast by type, 2018 - 2030 (USD Billion)
- 8.5.6.4. Market estimates and forecast by security, 2018 - 2030 (USD Billion)
- 8.5.6.5. Market estimates and forecast by end use, 2018 - 2030 (USD Billion)
- 8.6. Middle East & Africa
- 8.6.1. Market Estimates and Forecasts, 2018 - 2030 (USD Billion)
- 8.6.2. Market estimates and forecast by component, 2018 - 2030 (USD Billion)
- 8.6.3. Market estimates and forecast by type, 2018 - 2030 (USD Billion)
- 8.6.4. Market estimates and forecast by security, 2018 - 2030 (USD Billion)
- 8.6.5. Market estimates and forecast by end use, 2018 - 2030 (USD Billion)
- 8.6.6. UAE
- 8.6.6.1. Market Estimates and Forecasts, 2018 - 2030 (USD Billion)
- 8.6.6.2. Market estimates and forecast by component, 2018 - 2030 (USD Billion)
- 8.6.6.3. Market estimates and forecast by type, 2018 - 2030 (USD Billion)
- 8.6.6.4. Market estimates and forecast by security, 2018 - 2030 (USD Billion)
- 8.6.6.5. Market estimates and forecast by end use, 2018 - 2030 (USD Billion)
- 8.6.7. Saudi Arabia
- 8.6.7.1. Market Estimates and Forecasts, 2018 - 2030 (USD Billion)
- 8.6.7.2. Market estimates and forecast by component, 2018 - 2030 (USD Billion)
- 8.6.7.3. Market estimates and forecast by type, 2018 - 2030 (USD Billion)
- 8.6.7.4. Market estimates and forecast by security, 2018 - 2030 (USD Billion)
- 8.6.7.5. Market estimates and forecast by end use, 2018 - 2030 (USD Billion)
- 8.6.8. South Africa
- 8.6.8.1. Market Estimates and Forecasts, 2018 - 2030 (USD Billion)
- 8.6.8.2. Market estimates and forecast by component, 2018 - 2030 (USD Billion)
- 8.6.8.3. Market estimates and forecast by type, 2018 - 2030 (USD Billion)
- 8.6.8.4. Market estimates and forecast by security, 2018 - 2030 (USD Billion)
- 8.6.8.5. Market estimates and forecast by end use, 2018 - 2030 (USD Billion)
Chapter 9. Competitive Landscape
- 9.1. Recent Developments & Impact Analysis by Key Market Participants
- 9.2. Company Categorization
- 9.3. Company Market Share Analysis, 2024
- 9.4. Company Heat Map Analysis
- 9.5. Strategy Mapping
- 9.5.1. Expansion
- 9.5.2. Mergers & Acquisition
- 9.5.3. Partnerships & Collaborations
- 9.5.4. Product Launches
- 9.5.5. Recent Developments
- 9.6. Company Profiles
- 9.6.1. ABB
- 9.6.1.1. Participant's Overview
- 9.6.1.2. Financial Performance
- 9.6.1.3. Product Benchmarking
- 9.6.1.4. Recent Developments
- 9.6.2. Honeywell International Inc.
- 9.6.2.1. Participant's Overview
- 9.6.2.2. Financial Performance
- 9.6.2.3. Product Benchmarking
- 9.6.2.4. Recent Developments
- 9.6.3. Siemens AG
- 9.6.3.1. Participant's Overview
- 9.6.3.2. Financial Performance
- 9.6.3.3. Product Benchmarking
- 9.6.3.4. Recent Developments
- 9.6.4. Schneider Electric
- 9.6.4.1. Participant's Overview
- 9.6.4.2. Financial Performance
- 9.6.4.3. Product Benchmarking
- 9.6.4.4. Recent Developments
- 9.6.5. Rockwell Automation
- 9.6.5.1. Participant's Overview
- 9.6.5.2. Financial Performance
- 9.6.5.3. Product Benchmarking
- 9.6.5.4. Recent Developments
- 9.6.6. General Electric Company
- 9.6.6.1. Participant's Overview
- 9.6.6.2. Financial Performance
- 9.6.6.3. Product Benchmarking
- 9.6.6.4. Recent Developments
- 9.6.7. Hitachi, Ltd.
- 9.6.7.1. Participant's Overview
- 9.6.7.2. Financial Performance
- 9.6.7.3. Product Benchmarking
- 9.6.7.4. Recent Developments
- 9.6.8. Toshiba Corporation
- 9.6.8.1. Participant's Overview
- 9.6.8.2. Financial Performance
- 9.6.8.3. Product Benchmarking
- 9.6.8.4. Recent Developments
- 9.6.9. Robert Bosch GmbH
- 9.6.9.1. Participant's Overview
- 9.6.9.2. Financial Performance
- 9.6.9.3. Product Benchmarking
- 9.6.9.4. Recent Developments
- 9.6.10. Cisco Systems, Inc.
- 9.6.10.1. Participant's Overview
- 9.6.10.2. Financial Performance
- 9.6.10.3. Product Benchmarking
- 9.6.10.4. Recent Developments
- 9.6.11. Emerson Electric Co.
- 9.6.11.1. Participant's Overview
- 9.6.11.2. Financial Performance
- 9.6.11.3. Product Benchmarking
- 9.6.12. Intel Corporation
- 9.6.12.1. Participant's Overview
- 9.6.12.2. Financial Performance
- 9.6.12.3. Product Benchmarking
- 9.6.12.4. Recent Developments
- 9.6.13. IBM Corporation
- 9.6.13.1. Participant's Overview
- 9.6.13.2. Financial Performance
- 9.6.13.3. Product Benchmarking
- 9.6.13.4. Recent Developments
- 9.6.14. Microsoft Corporation
- 9.6.14.1. Participant's Overview
- 9.6.14.2. Financial Performance
- 9.6.14.3. Product Benchmarking
- 9.6.14.4. Recent Developments
- 9.6.15. Yokogawa Electric Corporation
- 9.6.15.1. Participant's Overview
- 9.6.15.2. Financial Performance
- 9.6.15.3. Product Benchmarking
- 9.6.15.4. Recent Developments
- 9.6.16. Claroty
- 9.6.16.1. Participant's Overview
- 9.6.16.2. Financial Performance
- 9.6.16.3. Product Benchmarking
- 9.6.16.4. Recent Developments
- 9.6.1. ABB
