|
|
市場調査レポート
商品コード
1728430
米国のスマートホームの市場規模、シェア、動向分析レポート:製品別、プロトコル別、用途別、セグメント別予測、2025年~2030年U.S. Smart Home Market Size, Share & Trends Analysis Report By Product, By Protocols, By Application, And Segment Forecasts, 2025 - 2030 |
||||||
|
|||||||
カスタマイズ可能
|
|||||||

| 米国のスマートホームの市場規模、シェア、動向分析レポート:製品別、プロトコル別、用途別、セグメント別予測、2025年~2030年 |
|
出版日: 2025年04月28日
発行: Grand View Research
ページ情報: 英文 150 Pages
納期: 2~10営業日
|

全表示
- 概要
- 図表
- 目次
米国のスマートホーム市場規模・動向:
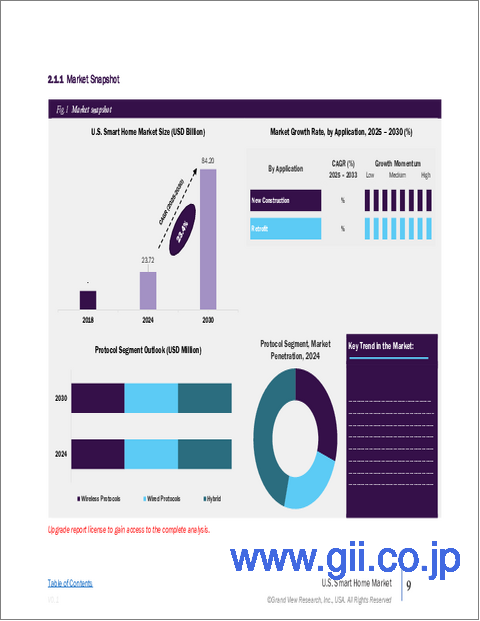
米国のスマートホーム市場規模は2024年に237億2,000万米ドルと推計され、2025年から2030年にかけてCAGR 23.4%で成長すると予測されています。
同産業は、エネルギー効率と持続可能性への関心の高まりにより、大きな成長を遂げています。消費者は、光熱費を管理しエネルギー消費を最適化するために、スマートサーモスタット、照明システム、エネルギー監視装置の採用を増やしています。税制上の優遇措置や州レベルの省エネルギープログラムなどの政府の取り組みが、こうした技術の導入をさらに促進しています。
さらに、環境に対する意識の高まりが、二酸化炭素排出量の削減に役立つソリューションへの投資を一般家庭に促しています。エネルギー・コストの変動が続いていることから、業界内のスマート・エネルギー管理技術に対する需要は引き続き堅調に推移すると予想されます。
業界は、Amazon Alexa、Google Assistant、AppleSiriなどのAI搭載音声アシスタントの統合によって大きく変貌しつつあります。これらのプラットフォームは、ユーザーが複数のデバイスをシームレスに制御することを可能にし、利便性とユーザー体験を向上させています。自然言語処理と機械学習の継続的な進歩は、スマートホームエコシステムの機能性とパーソナライゼーションをさらに向上させています。インテリジェントで応答性の高いシステムに対する消費者の期待が高まるにつれ、メーカーは音声とAI技術をより幅広い機器に組み込もうとしています。このシフトは、業界におけるイノベーションと成長の大きな原動力となっています。
セキュリティへの関心は、特にスマートカメラ、ビデオドアベル、統合アラームシステムの需要を通じて、業界の成長を促進する重要な要因となっています。消費者は、これらのスマート・セキュリティ・ソリューションが提供するリアルタイム・アラート、遠隔監視、クラウド・ストレージ機能を高く評価しています。特定の都市部における犯罪率の上昇や、個人の安全に対する意識の高まりが、製品の採用を加速させています。保険会社も、認定を受けたスマート・セキュリティ・システムを搭載した住宅に対して保険料の割引を提供しており、普及をさらに後押ししています。この動向は、業界の将来の情勢を形成する上で、セキュリティが戦略的な役割を担っていることを裏付けています。
スマートキッチン分野は、市場のイノベーションを促進する主要な原動力として台頭してきています。消費者は、モバイルアプリや音声コマンドで制御できるスマート冷蔵庫、オーブン、食器洗い機、コーヒーメーカーを採用しつつあります。これらの家電製品は利便性を高めるだけでなく、省エネや調理体験の向上にも貢献します。メーカーは、レシピ提案、在庫追跡、自動注文を提供するために、AIやIoT機能を組み込むようになってきています。キッチンはコネクテッド・リビングのハブとなりつつあり、業界の拡大を後押ししています。
スマート・エクステリア、特にスマート・ガレージと私道監視システムへの注目の高まりが、米国のスマートホーム市場の多様化に寄与しています。住宅所有者は、利便性とセキュリティを強化するために、ジオフェンシング、リアルタイムアラート、アプリコントロールを備えたスマートガレージドアオープナーを採用しています。訪問者の行動を監視するために、統合カメラシステムやナンバープレート認識技術が追加されています。これらの機能は、車両のセキュリティと自動アクセスが最優先事項である郊外の家庭には特に魅力的です。この屋外での拡大は、業界内の家庭内オートメーション・エコシステムを補完するものです。
リモートワークは今や多くの家庭で常備されており、市場はこうした進化するプロフェッショナルのニーズに適応しています。ノイズキャンセリングウィンドウ技術、部屋ごとの照明自動化、空調制御システムなどのスマートソリューションが、ホームオフィス環境を強化しています。メッシュWi-Fiネットワークやスマート会議ツールのような接続性を重視したアップグレードが優先されています。雇用主は、遠隔地の生産性を向上させるために、特定のホームアップグレードに補助金を出すことさえあります。このようなプロフェッショナルの使用事例は、スマートホームの利便性とビジネス機能を融合させた新たな需要カテゴリーを生み出しています。
相互接続された直感的なホームオートメーション・ソリューションに対する需要の高まりは、業界に大きな影響を与えており、AmazonやGoogle といった大手企業が、エコシステム中心の強固な戦略で業界をリードしています。これらのハイテク大手は、幅広いスマート・デバイスの集中制御を可能にするAI搭載プラットフォーム、AlexaやGoogle Assistantの開発に特化しています。彼らの競争力は、Amazon・EchoやNest・Thermostatsのような独自製品と、サードパーティ製デバイスとの幅広い互換性の両方を提供することにあります。さらに、オープンなソフトウェア開発キット(SDK)、強力な開発者コミュニティ、広範な小売ネットワークが、市場の拡張性と統合能力を高めています。その結果、これらのエコシステムは、この業界に参入する消費者にとって、頼りになる基盤となっています。
目次
第1章 調査手法と範囲
第2章 エグゼクティブサマリー
第3章 米国のスマートホーム市場の変数、動向、範囲
- 市場系統の見通し
- 市場バリューチェーン分析
- 市場力学
- 市場促進要因分析
- 市場抑制要因分析
- 導入の課題
- 米国のスマートホーム市場分析ツール
- 展開分析- ポーター
- PESTEL分析
第4章 米国のスマートホーム市場:製品の推定・動向分析
- セグメントダッシュボード
- 米国のスマートホーム市場:製品変動分析、2024年および2030年
- セキュリティとアクセス制御
- 防犯カメラ
- ビデオドアフォン
- スマートロック
- リモート監視ソフトウェアとサービス
- その他
- 照明制御
- スマートライト
- リレーとスイッチ
- 人感センサー
- 調光器
- その他の製品
- エンターテイメントデバイス
- スマートディスプレイ/テレビ
- ストリーミングデバイス
- サウンドバーとスピーカー
- 空調
- スマートサーモスタット
- センサー
- スマートベント
- その他
- スマートキッチン家電
- 冷蔵庫
- 食器洗い機
- コンロ
- 電子レンジ/オーブン
- 家電製品
- スマート洗濯機
- スマート給湯器
- スマート掃除機
- スマート家具
- 在宅ヘルスケア
- その他のデバイス
第5章 米国のスマートホーム市場:プロトコルの推定・動向分析
- セグメントダッシュボード
- 米国のスマートホーム市場:プロトコル変動分析、2024年および2030年
- 無線プロトコル
- ZigBee
- Wi-Fi
- Bluetooth
- Z波
- その他
- 有線プロトコル
- ハイブリッド
第6章 米国のスマートホーム市場:用途の推定・動向分析
- セグメントダッシュボード
- 米国のスマートホーム市場:用途変動分析、2024年および2030年
- 新築
- 改造
第7章 競合情勢
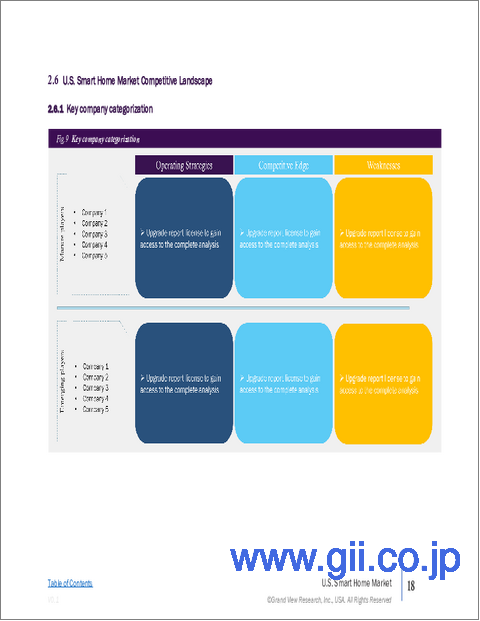
- 企業分類
- 企業の市場ポジショニング
- 企業ヒートマップ分析
- 企業プロファイル/上場企業
- ADT Inc.
- Apple Inc.
- Arlo Technologies
- Ecobee
- Google LLC
- Honeywell International
- Lutron Electronics Co. Inc.
- Panasonic Corporation
- Samsung Electronics
- Schneider Electric
- Sony Corporation
- Vivint, Inc.
- Xiaomi.
List of Tables
- Table 1 U.S. Smart home market size estimates & forecasts 2018 - 2030 (USD Million)
- Table 2 U.S. Smart home market, by product 2018 - 2030 (USD Million)
- Table 3 U.S. Smart home market, by protocols 2018 - 2030 (USD Million)
- Table 4 U.S. Smart home market, by application 2018 - 2030 (USD Million)
- Table 5 Security & access controls market estimates & forecasts, 2018 - 2030 (USD Million)
- Table 6 Security cameras market estimates & forecasts, 2018 - 2030 (USD Million)
- Table 7 Video door phones market estimates & forecasts, 2018 - 2030 (USD Million)
- Table 8 Smart locks market estimates & forecasts, 2018 - 2030 (USD Million)
- Table 9 Remote monitoring software & services market estimates & forecasts, 2018 - 2030 (USD Million)
- Table 10 Others market estimates & forecasts, 2018 - 2030 (USD Million)
- Table 11 Lighting control market estimates & forecasts, 2018 - 2030 (USD Million)
- Table 12 Smart lights market estimates & forecasts, 2018 - 2030 (USD Million)
- Table 13 Relays & switches market estimates & forecasts, 2018 - 2030 (USD Million)
- Table 14 Occupancy sensors market estimates & forecasts, 2018 - 2030 (USD Million)
- Table 15 Dimmers market estimates & forecasts, 2018 - 2030 (USD Million)
- Table 16 Other products market estimates & forecasts, 2018 - 2030 (USD Million)
- Table 17 Entertainment devices market estimates & forecasts, 2018 - 2030 (USD Million)
- Table 18 Smart displays/TV market estimates & forecasts, 2018 - 2030 (USD Million)
- Table 19 Streaming devices market estimates & forecasts, 2018 - 2030 (USD Million)
- Table 20 Soundbars and speakers market estimates & forecasts, 2018 - 2030 (USD Million)
- Table 21 HVAC market estimates & forecasts, 2018 - 2030 (USD Million)
- Table 22 Smart thermostats market estimates & forecasts, 2018 - 2030 (USD Million)
- Table 23 Sensors market estimates & forecasts, 2018 - 2030 (USD Million)
- Table 24 Smart vents market estimates & forecasts, 2018 - 2030 (USD Million)
- Table 25 Others market estimates & forecasts, 2018 - 2030 (USD Million)
- Table 26 Smart kitchen appliances market estimates & forecasts, 2018 - 2030 (USD Million)
- Table 27 Refrigerators market estimates & forecasts, 2018 - 2030 (USD Million)
- Table 28 Dishwashers market estimates & forecasts, 2018 - 2030 (USD Million)
- Table 29 Cooktops market estimates & forecasts, 2018 - 2030 (USD Million)
- Table 30 Microwave/ovens market estimates & forecasts, 2018 - 2030 (USD Million)
- Table 31 Home appliances market estimates & forecasts, 2018 - 2030 (USD Million)
- Table 32 Smart washing machines market estimates & forecasts, 2018 - 2030 (USD Million)
- Table 33 Smart water heaters market estimates & forecasts, 2018 - 2030 (USD Million)
- Table 34 Smart vacuum cleaners market estimates & forecasts, 2018 - 2030 (USD Million)
- Table 35 Smart furniture market estimates & forecasts, 2018 - 2030 (USD Million)
- Table 36 Home healthcare market estimates & forecasts, 2018 - 2030 (USD Million)
- Table 37 Other devices market estimates & forecasts, 2018 - 2030 (USD Million)
- Table 38 Wireless protocols market estimates & forecasts, 2018 - 2030 (USD Million)
- Table 39 Wired protocols market estimates & forecasts, 2018 - 2030 (USD Million)
- Table 40 Hybrid market estimates & forecasts, 2018 - 2030 (USD Million)
- Table 41 New construction market estimates & forecasts, 2018 - 2030 (USD Million)
- Table 42 Retrofit market estimates & forecasts, 2018 - 2030 (USD Million)
List of Figures
- Fig. 1 Market snapshot
- Fig. 2 Information procurement
- Fig. 3 Data analysis models
- Fig. 4 Market formulation and validation
- Fig. 5 Data validating & publishing
- Fig. 6 Market snapshot
- Fig. 7 Segment snapshot
- Fig. 8 Competitive landscape snapshot
- Fig. 9 U.S. Smart home market value, 2024 & 2030 (USD Million)
- Fig. 10 Key opportunity analysis
- Fig. 11 Industry value chain analysis
- Fig. 12 Market dynamics
- Fig. 13 Porter's analysis
- Fig. 14 PESTEL analysis
- Fig. 15 U.S. Smart home market, by product, key takeaways
- Fig. 16 U.S. Smart home market, by product, market share, 2024 & 2030
- Fig. 17 Security & access controls market estimates & forecasts, 2018 - 2030 (USD Million)
- Fig. 18 Security Cameras market estimates & forecasts, 2018 - 2030 (USD Million)
- Fig. 19 Video Door Phones market estimates & forecasts, 2018 - 2030 (USD Million)
- Fig. 20 Smart Locks market estimates & forecasts, 2018 - 2030 (USD Million)
- Fig. 21 Remote monitoring software & services market estimates & forecasts, 2018 - 2030 (USD Million)
- Fig. 22 Others market estimates & forecasts, 2018 - 2030 (USD Million)
- Fig. 23 Lighting control market estimates & forecasts, 2018 - 2030 (USD Million)
- Fig. 24 Smart Lights market estimates & forecasts, 2018 - 2030 (USD Million)
- Fig. 25 Relays & Switches market estimates & forecasts, 2018 - 2030 (USD Million)
- Fig. 26 Occupancy Sensors market estimates & forecasts, 2018 - 2030 (USD Million)
- Fig. 27 Dimmers market estimates & forecasts, 2018 - 2030 (USD Million)
- Fig. 28 Other Products market estimates & forecasts, 2018 - 2030 (USD Million)
- Fig. 29 Entertainment devices market estimates & forecasts, 2018 - 2030 (USD Million)
- Fig. 30 Smart Displays/TV market estimates & forecasts, 2018 - 2030 (USD Million)
- Fig. 31 Streaming devices market estimates & forecasts, 2018 - 2030 (USD Million)
- Fig. 32 Sound bars and speakers market estimates & forecasts, 2018 - 2030 (USD Million)
- Fig. 33 HVAC market estimates & forecasts, 2018 - 2030 (USD Million)
- Fig. 34 Smart Thermostats market estimates & forecasts, 2018 - 2030 (USD Million)
- Fig. 35 Sensors market estimates & forecasts, 2018 - 2030 (USD Million)
- Fig. 36 Smart Vents market estimates & forecasts, 2018 - 2030 (USD Million)
- Fig. 37 Others market estimates & forecasts, 2018 - 2030 (USD Million)
- Fig. 38 Smart kitchen appliances market estimates & forecasts, 2018 - 2030 (USD Million)
- Fig. 39 Refrigerators market estimates & forecasts, 2018 - 2030 (USD Million)
- Fig. 40 Dish washers market estimates & forecasts, 2018 - 2030 (USD Million)
- Fig. 41 Cooktops market estimates & forecasts, 2018 - 2030 (USD Million)
- Fig. 42 Microwave/Ovens market estimates & forecasts, 2018 - 2030 (USD Million)
- Fig. 43 Home appliances market estimates & forecasts, 2018 - 2030 (USD Million)
- Fig. 44 Smart washing machines market estimates & forecasts, 2018 - 2030 (USD Million)
- Fig. 45 Smart water heaters market estimates & forecasts, 2018 - 2030 (USD Million)
- Fig. 46 Smart vacuum cleaners market estimates & forecasts, 2018 - 2030 (USD Million)
- Fig. 47 Smart furniture market estimates & forecasts, 2018 - 2030 (USD Million)
- Fig. 48 Home healthcare market estimates & forecasts, 2018 - 2030 (USD Million)
- Fig. 49 Other devices market estimates & forecasts, 2018 - 2030 (USD Million)
- Fig. 50 U.S. Smart home market, by protocol, key takeaways
- Fig. 51 Smart home market, by protocol, market share, 2024 & 2030
- Fig. 52 Wireless protocols market estimates & forecasts, 2018 - 2030 (USD Million)
- Fig. 53 Wired protocols market estimates & forecasts, 2018 - 2030 (USD Million)
- Fig. 54 Hybrid market estimates & forecasts, 2018 - 2030 (USD Million)
- Fig. 55 U.S. Smart home market, by application, key takeaways
- Fig. 56 U.S. Smart home market, by application, market share, 2024 & 2030
- Fig. 57 New construction market estimates & forecasts, 2018 - 2030 (USD Million)
- Fig. 58 Retrofit market estimates & forecasts, 2018 - 2030 (USD Million)
- Fig. 59 Strategic framework
U.S. Smart Home Market Size & Trends:
The U.S. smart home market size was estimated at USD 23.72 billion in 2024 and is projected to grow at a CAGR of 23.4% from 2025 to 2030. The industry is experiencing significant growth, driven by a heightened focus on energy efficiency and sustainability. Consumers are increasingly adopting smart thermostats, lighting systems, and energy monitoring devices to manage utility expenses and optimize energy consumption. Government initiatives, including tax incentives and state-level energy conservation programs, are further promoting the deployment of these technologies.
Additionally, growing environmental awareness is encouraging households to invest in solutions that help reduce carbon emissions. Given the continued volatility in energy costs, demand for smart energy management technologies within the industry is expected to remain strong.
The industry is being significantly transformed by the integration of AI-powered voice assistants such as Amazon Alexa, Google Assistant, and Apple Siri. These platforms enable users to control multiple devices seamlessly, enhancing convenience and user experience. Continuous advancements in natural language processing and machine learning are further improving the functionality and personalization of smart home ecosystems. As consumer expectations for intelligent, responsive systems grow, manufacturers are embedding voice and AI technologies into a broader range of devices. This shift is a major driver of innovation and growth within the industry.
Security concerns are a key factor fueling the growth of the industry, particularly through the demand for smart cameras, video doorbells, and integrated alarm systems. Consumers value real-time alerts, remote monitoring, and cloud storage capabilities that these smart security solutions provide. The rise in crime rates in certain urban areas and increased awareness about personal safety have accelerated product adoption. Insurance companies are also offering premium discounts for homes equipped with certified smart security systems, further incentivizing uptake. This trend underscores the strategic role of security in shaping the future landscape of the industry.
The smart kitchen segment is emerging as a major driver of innovation in the market. Consumers are adopting smart refrigerators, ovens, dishwashers, and coffee machines that can be controlled via mobile apps or voice commands. These appliances not only enhance convenience but also contribute to energy savings and improved cooking experiences. Manufacturers are increasingly embedding AI and IoT features to provide recipe suggestions, inventory tracking, and automatic ordering. The kitchen is becoming a hub of connected living, reinforcing the expansion of the industry.
A growing focus on smart exteriors, particularly smart garages and driveway monitoring systems, is contributing to the diversification of the U.S. smart home market. Homeowners are adopting smart garage door openers with geofencing, real-time alerts, and app control to enhance convenience and security. Integrated camera systems and license plate recognition technologies are now being added to monitor visitor activity. These features are particularly appealing to suburban households, where vehicle security and automated access are high priorities. This outdoor expansion complements the in-home automation ecosystem within the industry.
Remote work is now a permanent fixture in many households, and the market is adapting to meet these evolving professional needs. Smart solutions such as noise-canceling window tech, room-specific lighting automation, and climate control systems are enhancing home office environments. Connectivity-focused upgrades-like mesh Wi-Fi networks and smart conferencing tools-are being prioritized. Employers are even subsidizing certain home upgrades to improve remote productivity. This professional use-case is creating a new category of demand that merges smart home convenience with business functionality.
The rising demand for interconnected and intuitive home automation solutions is significantly influencing the industry, with major players like Amazon and Google leading the way through their robust ecosystem-centric strategies. These tech giants specialize in developing AI-powered platforms, Alexa and Google Assistant, that enable centralized control of a wide range of smart devices. Their competitive edge lies in offering both proprietary products, such as Amazon Echo and Nest Thermostats, and broad compatibility with third-party devices. Additionally, their open software development kits (SDKs), strong developer communities, and extensive retail networks enhance their market scalability and integration capabilities. Consequently, these ecosystems have become the go-to foundation for consumers entering the industry.
U.S. Smart Home Market Report Segmentation
This report forecasts revenue growth at the country level and provides an analysis of the latest technological trends in each of the sub-segments from 2018 to 2030. For this study, Grand View Research has segmented the U.S. smart home market report based on product, protocols, and application:
- Product Outlook (Revenue, USD Million, 2018 - 2030)
- Security & Access Controls
- Security Cameras
- Video Door Phones
- Smart Locks
- Remote Monitoring Software & Services
- Others
- Lighting Control
- Smart Lights
- Relays & Switches
- Occupancy Sensors
- Dimmers
- Other Products
- Entertainment Devices
- Smart Displays/TV
- Streaming Devices
- Sound bars and Speakers
- HVAC
- Smart Thermostats
- Sensors
- Smart Vents
- Others
- Smart Kitchen Appliances
- Refrigerators
- Dish Washers
- Cooktops
- Microwave/Ovens
- Home Appliances
- Smart Washing Machines
- Smart Water Heaters
- Smart Vacuum Cleaners
- Smart Furniture
- Home Healthcare
- Other Devices
- Protocol Outlook (Revenue, USD Million, 2018 - 2030)
- Wireless Protocols
- ZigBee
- Wi-Fi
- Bluetooth
- Z Wave
- Others
- Wired Protocols
- Hybrid
- Application Outlook (Revenue, USD Million, 2018 - 2030)
- New Construction
- Retrofit
Table of Contents
Chapter 1. Methodology and Scope
- 1.1. Market Segmentation and Scope
- 1.2. Market Definitions
- 1.2.1. Information analysis
- 1.2.2. Market formulation & data visualization
- 1.2.3. Data validation & publishing
- 1.3. Research Scope and Assumptions
- 1.3.1. List of Data Sources
Chapter 2. Executive Summary
- 2.1. Market Outlook
- 2.2. Segment Outlook
- 2.3. Competitive Insights
Chapter 3. U.S. Smart Home Market Variables, Trends, & Scope
- 3.1. Market Lineage Outlook
- 3.2. Market Value Chain Analysis
- 3.3. Market Dynamics
- 3.3.1. Market Driver Analysis
- 3.3.2. Market Restraint Analysis
- 3.3.3. Deployment Challenge
- 3.4. U.S. Smart Home Market Analysis Tools
- 3.4.1. Deployment Analysis - Porter's
- 3.4.1.1. Bargaining power of the suppliers
- 3.4.1.2. Bargaining power of the buyers
- 3.4.1.3. Threats of substitution
- 3.4.1.4. Threats from new entrants
- 3.4.1.5. Competitive rivalry
- 3.4.2. PESTEL Analysis
- 3.4.2.1. Political Landscape
- 3.4.2.2. Economic Landscape
- 3.4.2.3. Social Landscape
- 3.4.2.4. Technology Landscape
- 3.4.2.5. Environmental Landscape
- 3.4.2.6. Legal Landscape
- 3.4.1. Deployment Analysis - Porter's
Chapter 4. U.S. Smart Home Market: Product Estimates & Trend Analysis
- 4.1. Segment Dashboard
- 4.2. U.S. Smart Home Market: Product Movement Analysis, 2024 & 2030 (USD Million)
- 4.3. Security & Access Control
- 4.3.1. Security & Access Control Market Revenue Estimates and Forecasts, 2018 - 2030 (USD Million)
- 4.3.2. Security Cameras
- 4.3.2.1. Security Cameras Market Revenue Estimates and Forecasts, 2018 - 2030 (USD Million)
- 4.3.3. Video Door Phones
- 4.3.3.1. Video Door Phones Market Revenue Estimates and Forecasts, 2018 - 2030 (USD Million)
- 4.3.4. Smart Locks
- 4.3.4.1. Smart Locks Market Revenue Estimates and Forecasts, 2018 - 2030 (USD Million)
- 4.3.5. Remote Monitoring Software & Services
- 4.3.5.1. Remote Monitoring Software & Services Market Revenue Estimates and Forecasts, 2018 - 2030 (USD Million)
- 4.3.6. Others
- 4.3.6.1. Others Market Revenue Estimates and Forecasts, 2018 - 2030 (USD Million)
- 4.4. Lighting Control
- 4.4.1. Lighting Control Market Revenue Estimates and Forecasts, 2018 - 2030 (USD Million)
- 4.4.2. Smart Lights
- 4.4.2.1. Smart Lights Market Revenue Estimates and Forecasts, 2018 - 2030 (USD Million)
- 4.4.3. Relays & Switches
- 4.4.3.1. Relays & Switches Market Revenue Estimates and Forecasts, 2018 - 2030 (USD Million)
- 4.4.4. Occupancy Sensors
- 4.4.4.1. Occupancy Sensors Market Revenue Estimates and Forecasts, 2018 - 2030 (USD Million)
- 4.4.5. Dimmers
- 4.4.5.1. Dimmers Market Revenue Estimates and Forecasts, 2018 - 2030 (USD Million)
- 4.4.6. Other Products
- 4.4.6.1. Other Products Market Revenue Estimates and Forecasts, 2018 - 2030 (USD Million)
- 4.5. Entertainment Devices
- 4.5.1. Entertainment Devices Market Revenue Estimates and Forecasts, 2018 - 2030 (USD Million)
- 4.5.2. Smart Displays/TV
- 4.5.2.1. Smart Displays/TV Market Revenue Estimates and Forecasts, 2018 - 2030 (USD Million)
- 4.5.3. Streaming Devices
- 4.5.3.1. Streaming Devices Market Revenue Estimates and Forecasts, 2018 - 2030 (USD Million)
- 4.5.4. Sound Bars & Speakers
- 4.5.4.1. Sound Bars & Speakers Market Revenue Estimates and Forecasts, 2018 - 2030 (USD Million)
- 4.6. HVAC
- 4.6.1. HVAC Market Revenue Estimates and Forecasts, 2018 - 2030 (USD Million)
- 4.6.2. Smart Thermostats
- 4.6.2.1. Smart Thermostats Market Revenue Estimates and Forecasts, 2018 - 2030 (USD Million)
- 4.6.3. Sensors
- 4.6.3.1. Sensors Market Revenue Estimates and Forecasts, 2018 - 2030 (USD Million)
- 4.6.4. Smart Vents
- 4.6.4.1. Smart Vents Market Revenue Estimates and Forecasts, 2018 - 2030 (USD Million)
- 4.6.5. Others
- 4.6.5.1. Others Market Revenue Estimates and Forecasts, 2018 - 2030 (USD Million)
- 4.7. Smart Kitchen Appliances
- 4.7.1. Smart Kitchen Appliances Market Revenue Estimates and Forecasts, 2018 - 2030 (USD Million)
- 4.7.2. Refrigerators
- 4.7.2.1. Refrigerators Market Revenue Estimates and Forecasts, 2018 - 2030 (USD Million)
- 4.7.3. Dish Washers
- 4.7.3.1. Dish Washers Market Revenue Estimates and Forecasts, 2018 - 2030 (USD Million)
- 4.7.4. Cooktops
- 4.7.4.1. Cooktops Market Revenue Estimates and Forecasts, 2018 - 2030 (USD Million)
- 4.7.5. Microwave/Ovens
- 4.7.5.1. Microwave/Ovens Market Revenue Estimates and Forecasts, 2018 - 2030 (USD Million)
- 4.8. Home Appliances
- 4.8.1. Home Appliances Market Revenue Estimates and Forecasts, 2018 - 2030 (USD Million)
- 4.8.2. Smart Washing Machines
- 4.8.2.1. Smart Washing Machines Market Revenue Estimates and Forecasts, 2018 - 2030 (USD Million)
- 4.8.3. Smart Water Heaters
- 4.8.3.1. Smart Water Heaters Market Revenue Estimates and Forecasts, 2018 - 2030 (USD Million)
- 4.8.4. Smart Vacuum Cleaners
- 4.8.4.1. Smart Vacuum Cleaners Market Revenue Estimates and Forecasts, 2018 - 2030 (USD Million)
- 4.9. Smart Furniture
- 4.9.1. Smart Furniture Market Revenue Estimates and Forecasts, 2018 - 2030 (USD Million)
- 4.10. Home Healthcare
- 4.10.1. Home Healthcare Market Revenue Estimates and Forecasts, 2018 - 2030 (USD Million)
- 4.11. Other Devices
- 4.11.1. Other Devices Market Revenue Estimates and Forecasts, 2018 - 2030 (USD Million)
Chapter 5. U.S. Smart Home Market: Protocol Estimates & Trend Analysis
- 5.1. Segment Dashboard
- 5.2. U.S. Smart Home Market: Protocols Movement Analysis, 2024 & 2030 (USD Million)
- 5.3. Wireless Protocols
- 5.3.1. Wireless Protocols Market Revenue Estimates and Forecasts, 2018 - 2030 (USD Million)
- 5.3.2. ZigBee
- 5.3.2.1. ZigBee Market Revenue Estimates and Forecasts, 2018 - 2030 (USD Million)
- 5.3.3. Wi-Fi
- 5.3.3.1. Wi-Fi Market Revenue Estimates and Forecasts, 2018 - 2030 (USD Million)
- 5.3.4. Bluetooth
- 5.3.4.1. Bluetooth Market Revenue Estimates and Forecasts, 2018 - 2030 (USD Million)
- 5.3.5. Z Waves
- 5.3.5.1. Z Waves Market Revenue Estimates and Forecasts, 2018 - 2030 (USD Million)
- 5.3.6. Others
- 5.3.6.1. Others Market Revenue Estimates and Forecasts, 2018 - 2030 (USD Million)
- 5.4. Wired Protocols
- 5.4.1. Wired Protocols Market Revenue Estimates and Forecasts, 2018 - 2030 (USD Million)
- 5.5. Hybrid
- 5.5.1. Hybrid Market Revenue Estimates and Forecasts, 2018 - 2030 (USD Million)
Chapter 6. U.S. Smart Home Market: Application Estimates & Trend Analysis
- 6.1. Segment Dashboard
- 6.2. U.S. Smart Home Market: Application Movement Analysis, 2024 & 2030 (USD Million)
- 6.3. New Construction
- 6.3.1. New Construction Market Revenue Estimates and Forecasts, 2018 - 2030 (USD Million)
- 6.4. Retrofit
- 6.4.1. Retrofit Market Revenue Estimates and Forecasts, 2018 - 2030 (USD Million)
Chapter 7. Competitive Landscape
- 7.1. Company Categorization
- 7.2. Company Market Positioning
- 7.3. Company Heat Map Analysis
- 7.4. Company Profiles/Listing
- 7.4.1. ADT Inc.
- 7.4.1.1. Participant's Overview
- 7.4.1.2. Financial Performance
- 7.4.1.3. Service Benchmarking
- 7.4.1.4. Strategic Initiatives
- 7.4.2. Apple Inc.
- 7.4.2.1. Participant's Overview
- 7.4.2.2. Financial Performance
- 7.4.2.3. Service Benchmarking
- 7.4.2.4. Strategic Initiatives
- 7.4.3. Arlo Technologies
- 7.4.3.1. Participant's Overview
- 7.4.3.2. Financial Performance
- 7.4.3.3. Service Benchmarking
- 7.4.3.4. Strategic Initiatives
- 7.4.4. Ecobee
- 7.4.4.1. Participant's Overview
- 7.4.4.2. Financial Performance
- 7.4.4.3. Service Benchmarking
- 7.4.4.4. Strategic Initiatives
- 7.4.5. Google LLC
- 7.4.5.1. Participant's Overview
- 7.4.5.2. Financial Performance
- 7.4.5.3. Service Benchmarking
- 7.4.5.4. Strategic Initiatives
- 7.4.6. Honeywell International
- 7.4.6.1. Participant's Overview
- 7.4.6.2. Financial Performance
- 7.4.6.3. Service Benchmarking
- 7.4.6.4. Strategic Initiatives
- 7.4.7. Lutron Electronics Co. Inc.
- 7.4.7.1. Participant's Overview
- 7.4.7.2. Financial Performance
- 7.4.7.3. Service Benchmarking
- 7.4.7.4. Strategic Initiatives
- 7.4.8. Panasonic Corporation
- 7.4.8.1. Participant's Overview
- 7.4.8.2. Financial Performance
- 7.4.8.3. Service Benchmarking
- 7.4.8.4. Strategic Initiatives
- 7.4.9. Samsung Electronics
- 7.4.9.1. Participant's Overview
- 7.4.9.2. Financial Performance
- 7.4.9.3. Service Benchmarking
- 7.4.9.4. Strategic Initiatives
- 7.4.10. Schneider Electric
- 7.4.10.1. Participant's Overview
- 7.4.10.2. Financial Performance
- 7.4.10.3. Service Benchmarking
- 7.4.10.4. Strategic Initiatives
- 7.4.11. Sony Corporation
- 7.4.11.1. Participant's Overview
- 7.4.11.2. Financial Performance
- 7.4.11.3. Service Benchmarking
- 7.4.11.4. Strategic Initiatives
- 7.4.12. Vivint, Inc.
- 7.4.12.1. Participant's Overview
- 7.4.12.2. Financial Performance
- 7.4.12.3. Service Benchmarking
- 7.4.12.4. Strategic Initiatives
- 7.4.13. Xiaomi.
- 7.4.13.1. Participant's Overview
- 7.4.13.2. Financial Performance
- 7.4.13.3. Service Benchmarking
- 7.4.13.4. Strategic Initiatives
- 7.4.1. ADT Inc.
