|
|
市場調査レポート
商品コード
1679565
二次電池の市場規模、シェア、動向分析レポート:タイプ別、用途別、地域別、セグメント予測、2025年~2030年Secondary Battery Market Size, Share & Trends Analysis Report By Type (Lithium-ion, Lead Acid, Nickel Metal Hydride), By Application (Motor Vehicles, Industrial Batteries, Portable Devices, Electronics), By Region, And Segment Forecasts, 2025 - 2030 |
||||||
|
|||||||
カスタマイズ可能
|
|||||||

| 二次電池の市場規模、シェア、動向分析レポート:タイプ別、用途別、地域別、セグメント予測、2025年~2030年 |
|
出版日: 2025年02月27日
発行: Grand View Research
ページ情報: 英文 120 Pages
納期: 2~10営業日
|

全表示
- 概要
- 図表
- 目次
二次電池市場の成長と動向
Grand View Research, Inc.の最新レポートによると、世界の二次電池市場規模は2030年までに2,071億9,000万米ドルに達すると予測され、予測期間中にCAGR 9.4%で拡大すると予測されています。
二次電池の需要は、電気自動車(EV)の急速な普及、再生可能エネルギー貯蔵システムの拡大、ポータブル電子機器の使用の増加により、今後数年間で大きく伸びるとみられます。世界各国政府は、厳しい排出規制を実施し、クリーンエネルギーソリューションに対するインセンティブを提供しており、効率的なエネルギー貯蔵の必要性をさらに高めています。
リチウムイオン電池セグメントは、高エネルギー密度、長サイクル寿命、急速充電機能を兵器に、最大のタイプセグメントとなっています。また、スマートフォン、ノートパソコン、ウェアラブル機器などの民生用電子機器製品の普及も、消費者がより長い電池寿命と高速充電を求めていることから、需要を後押ししています。これらの要因が相まって、リチウムイオン電池はサステイナブルエネルギーと先端技術への世界の移行を可能にする重要な存在となっています。
二次電池産業における携帯機器セグメントは、スマートフォン、ノートパソコン、タブレット、ウェアラブルデバイスの需要増加によって牽引され、仕事、教育、娯楽における技術への依存の高まりがその原動力となっています。消費者は、より長い電池寿命、より高速な充電、コンパクトなデザインのデバイスを求めており、リチウムイオンやその他の電池技術の進歩を後押ししています。
二次電池産業は、電気自動車(EV)の需要拡大、再生可能エネルギー貯蔵ソリューションの拡大、民生用電子機器製品の採用増加によって牽引されています。世界各国の政府は、電池生産と電化を支援する施策やインセンティブを実施しており、市場成長をさらに加速させています。
二次電池市場レポートハイライト
- タイプ別では、リチウムイオン電池が2024年に78.15%以上の最大の売上シェアを占めます。リチウムイオン電池は市場の要であり、主に電気自動車(EV)の急速な普及に牽引されています。EVは高エネルギー密度、長サイクル寿命、急速充電機能を持つリチウムイオン電池に大きく依存しています。
- 用途別では、自動車セグメントが2024年に33.65%以上の売上シェアを占めました。世界各国政府は、厳しい排ガス規制を実施し、クリーンな輸送を促進するインセンティブを提供しており、高性能電池、特にリチウムイオン電池の需要を加速しています。
- アジア太平洋は、中国、インド、日本などの国々における政府の施策、補助金、厳しい排ガス規制が原動力となって、予測期間中に最も速いCAGRで成長すると予想されます。
目次
第1章 調査手法と範囲
第2章 エグゼクティブサマリー
第3章 市場の変数、動向、範囲
- 市場系統の展望
- 浸透と成長の見込みマッピング
- バリューチェーン分析
- 規制の枠組み
- 標準とコンプライアンス
- 規制影響分析
- 市場力学
- 市場促進要因分析
- 市場抑制要因分析
- 市場機会
- 市場課題
- ポーターのファイブフォース分析
- 供給企業の交渉力
- 買い手の交渉力
- 代替の脅威
- 新規参入業者の脅威
- 競争企業間の敵対関係
- PESTLE分析
- 政治
- 経済
- 社会
- 技術
- 環境
- 法律
第4章 二次電池市場:タイプ別、推定・動向分析
- 二次電池市場:タイプ変動分析、2024年と2030年
- リチウムイオン
- 鉛蓄電池
- ニッケル水素
- その他
第5章 二次電池市場:用途別、推定・動向分析
- 二次電池市場:用途変動分析、2024年と2030年
- 自動車
- 産業用電池
- ポータブルデバイス
- エレクトロニクス
- その他
第6章 二次電池市場:地域別、推定・動向分析
- 地域分析、2024年と2030年
- 北米
- タイプ別、2018~2030年
- 用途別、2018~2030年
- 米国
- カナダ
- メキシコ
- 欧州
- タイプ別、2018~2030年
- 用途別、2018~2030年
- ドイツ
- 英国
- フランス
- アジア太平洋
- タイプ別、2018~2030年
- 用途別、2018~2030年
- 中国
- インド
- 日本
- 韓国
- 中南米
- タイプ別、2018~2030年
- 用途別、2018~2030年
- ブラジル
- 中東・アフリカ
- タイプ別、2018~2030年
- 用途別、2018~2030年
- サウジアラビア
- アラブ首長国連邦
第7章 競合情勢
- 主要市場参入企業による最近の動向
- 企業分類
- 主要コンポーネントサプライヤーとチャネルパートナーの一覧
- 企業の市場シェアとポジショニング分析、2024年
- ヒートマップ分析
- ベンダー情勢
- 原料サプライヤー一覧
- 販売店/トレーダー一覧
- その他の主要メーカー一覧
- 潜在エンドユーザー一覧
- 戦略マッピング
- 企業プロファイル/上場企業
- LG Chem
- Hitachi High-Tech India Private Limited
- Aquion Energy LLC
- Johnson Controls
- BTI
- Amperex Technologies
- Panasonic Corporation
- BYD Company Ltd.
- SAMSUNG SDI CO., LTD.
- Energizer Holdings Inc.
List of Tables
- TABLE 1 Secondary Battery market estimates & forecasts, 2018 - 2030 (USD Million)
- TABLE 2 Lithium-ion market estimates & forecasts, 2018 - 2030 (USD Million)
- TABLE 3 Lead acid market estimates & forecasts, 2018 - 2030 (USD Million)
- TABLE 4 Nickel Metal Hydride market estimates & forecasts, 2018 - 2030 (USD Million)
- TABLE 5 Other Secondary Battery market estimates & forecasts, 2018 - 2030 (USD Million)
- TABLE 6 Secondary Battery market estimates & forecasts, in Motor Vehicles, 2018 - 2030 (USD Million)
- TABLE 7 Secondary Battery market estimates & forecasts, in Industrial Batteries, 2018 - 2030 (USD Million)
- TABLE 8 Secondary Battery market estimates & forecasts, in Portable Devices, 2018 - 2030 (USD Million)
- TABLE 9 Secondary Battery market estimates & forecasts, in electronics, 2018 - 2030 (USD Million)
- TABLE 10 Secondary Battery market estimates & forecasts, in other applications, 2018 - 2030 (USD Million)
- TABLE 11 North America Secondary Battery market estimates & forecast, 2018 - 2030 (USD Million)
- TABLE 12 North America Secondary Battery market estimates & forecasts by type, 2018 - 2030 (USD Million)
- TABLE 13 North America Secondary Battery market estimates & forecasts by application, 2018 - 2030 (USD Million)
- TABLE 14 U.S. Secondary Battery market estimates & forecasts, 2018 - 2030 (USD Million)
- TABLE 15 U.S. Secondary Battery market estimates & forecasts by type, 2018 - 2030 (USD Million)
- TABLE 16 U.S. Secondary Battery market estimates & forecasts by application, 2018 - 2030 (USD Million)
- TABLE 17 Canada Secondary Battery market estimates & forecasts, 2018 - 2030 (USD Million)
- TABLE 18 Canada Secondary Battery market estimates & forecasts by type, 2018 - 2030 (USD Million)
- TABLE 19 Canada Secondary Battery market estimates & forecasts by application, 2018 - 2030 (USD Million)
- TABLE 20 Mexico Secondary Battery market estimates & forecasts, 2018 - 2030 (USD Million)
- TABLE 21 Mexico Secondary Battery market estimates & forecasts by type, 2018 - 2030 (USD Million)
- TABLE 22 Mexico Secondary Battery market estimates & forecasts by application, 2018 - 2030 (USD Million)
- TABLE 23 Europe Secondary Battery market estimates & forecasts, 2018 - 2030 (USD Million)
- TABLE 24 Europe Secondary Battery market estimates & forecasts by type, 2018 - 2030 (USD Million)
- TABLE 25 Europe Secondary Battery market estimates & forecasts by application, 2018 - 2030 (USD Million)
- TABLE 26 Germany Secondary Battery market estimates & forecasts, 2018 - 2030 (USD Million)
- TABLE 27 Germany Secondary Battery market estimates & forecasts by type, 2018 - 2030 (USD Million)
- TABLE 28 Germany Secondary Battery market estimates & forecasts by application, 2018 - 2030 (USD Million)
- TABLE 29 France Secondary Battery market estimates & forecasts, 2018 - 2030 (USD Million)
- TABLE 30 France Secondary Battery market estimates & forecasts by type, 2018 - 2030 (USD Million)
- TABLE 31 France Secondary Battery market estimates & forecasts by application, 2018 - 2030 (USD Million)
- TABLE 32 UK Secondary Battery market estimates & forecast, 2018 - 2030 (USD Million)
- TABLE 33 UK Secondary Battery market estimates & forecasts by type, 2018 - 2030 (USD Million)
- TABLE 34 UK Secondary Battery market estimates & forecasts by application, 2018 - 2030 (USD Million)
- TABLE 35 Asia Pacific Secondary Battery market estimates & forecast, 2018 - 2030 (USD Million)
- TABLE 36 Asia Pacific Secondary Battery market estimates & forecasts by type, 2018 - 2030 (USD Million)
- TABLE 37 Asia Pacific Secondary Battery market estimates & forecasts by application, 2018 - 2030 (USD Million)
- TABLE 38 China Secondary Battery market estimates & forecast, 2018 - 2030 (USD Million)
- TABLE 39 China Secondary Battery market estimates & forecasts by type, 2018 - 2030 (USD Million)
- TABLE 40 China Secondary Battery market estimates & forecasts by application, 2018 - 2030 (USD Million)
- TABLE 41 Japan Secondary Battery market estimates & forecast, 2018 - 2030 (USD Million)
- TABLE 42 Japan Secondary Battery market estimates & forecasts by type, 2018 - 2030 (USD Million)
- TABLE 43 Japan Secondary Battery market estimates & forecasts by application, 2018 - 2030 (USD Million)
- TABLE 44 South Korea Secondary Battery market estimates & forecast, 2018 - 2030 (USD Million)
- TABLE 45 South Korea Secondary Battery market estimates & forecasts by type, 2018 - 2030 (USD Million)
- TABLE 46 South Korea Secondary Battery market estimates & forecasts by application, 2018 - 2030 (USD Million)
- TABLE 47 India Secondary Battery market estimates & forecast, 2018 - 2030 (USD Million)
- TABLE 48 India Secondary Battery market estimates & forecasts by type, 2018 - 2030 (USD Million)
- TABLE 49 India Secondary Battery market estimates & forecasts by application, 2018 - 2030 (USD Million)
- TABLE 50 Central & South America Secondary Battery market estimates & forecasts, 2018 - 2030 (USD Million)
- TABLE 51 Central & South America Secondary Battery market estimates & forecasts by type, 2018 - 2030 (USD Million)
- TABLE 52 Central & South America Secondary Battery market estimates & forecasts by application, 2018 - 2030 (USD Million)
- TABLE 53 Brazil Secondary Battery market estimates & forecasts, 2018 - 2030 (USD Million)
- TABLE 54 Brazil Secondary Battery market estimates & forecasts by type, 2018 - 2030 (USD Million)
- TABLE 55 Brazil Secondary Battery market estimates & forecasts by application, 2018 - 2030 (USD Million)
- TABLE 56 Middle East & Africa Secondary Battery market estimates & forecast, 2018 - 2030 (USD Million)
- TABLE 57 Middle East & Africa Secondary Battery market estimates & forecasts by type, 2018 - 2030 (USD Million)
- TABLE 58 Middle East & Africa Secondary Battery market estimates & forecasts by application, 2018 - 2030 (USD Million)
- TABLE 59 Saudi Arabia Secondary Battery market estimates & forecasts, 2018 - 2030 (USD Million)
- TABLE 60 Saudi Arabia Secondary Battery market estimates & forecasts by type, 2018 - 2030 (USD Million)
- TABLE 61 Saudi Arabia Secondary Battery market estimates & forecasts by application, 2018 - 2030 (USD Million)
- TABLE 62 UAE Secondary Battery market estimates & forecast, 2018 - 2030 (USD Million)
- TABLE 63 UAE Secondary Battery market estimates & forecasts by type, 2018 - 2030 (USD Million)
- TABLE 64 UAE Secondary Battery market estimates & forecasts by application, 2018 - 2030 (USD Million)
List of Figures
- FIG. 1 Market segmentation
- FIG. 2 Information procurement
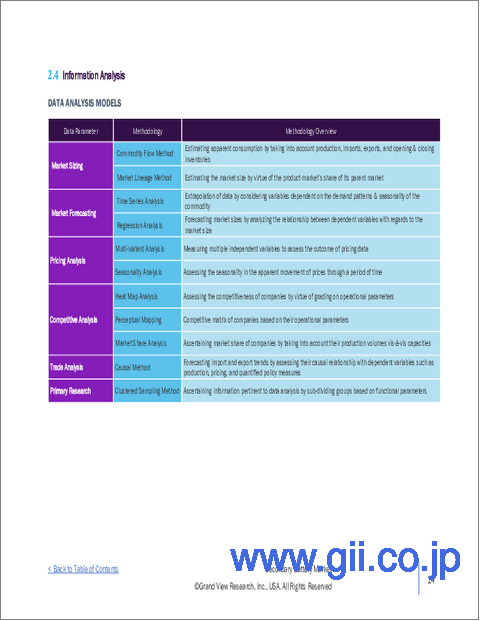
- FIG. 3 Data analysis models
- FIG. 4 Market formulation and validation
- FIG. 5 Data validating & publishing
- FIG. 6 Market snapshot
- FIG. 7 Segmental outlook - Application & Type
- FIG. 8 Competitive Outlook
- FIG. 9 Secondary Battery market outlook, 2018 - 2030 (USD Million)
- FIG. 10 Value chain analysis
- FIG. 11 Market dynamics
- FIG. 12 Porter's Analysis
- FIG. 13 PESTEL Analysis
- FIG. 14 Secondary Battery market, by type: Key takeaways
- FIG. 15 Secondary Battery market, by type: Market share, 2024 & 2030
- FIG. 16 Secondary Battery market, by application: Key takeaways
- FIG. 17 Secondary Battery market, by application: Market share, 2024 & 2030
- FIG. 18 Secondary Battery market: Regional analysis, 2024 & 2030
- FIG. 19 Secondary Battery market, by region: Key takeaways
Secondary Battery Market Growth & Trends:
The global secondary battery market size is anticipated to reach USD 207.19 billion by 2030 and is anticipated to expand at a CAGR of 9.4% during the forecast period, according to a new report by Grand View Research, Inc. The demand for secondary batteries is likely to grow significantly in the coming years, driven by the rapid adoption of electric vehicles (EVs), the expansion of renewable energy storage systems, and the increasing use of portable electronic devices. Governments worldwide are implementing stringent emission regulations and offering incentives for clean energy solutions, further boosting the need for efficient energy storage.
The lithium-ion battery sector is the largest type segment, fueled by high energy density, long cycle life, and fast charging capabilities. The proliferation of consumer electronics, including smartphones, laptops, and wearable devices, also fuels demand, as consumers seek longer battery life and faster charging. Together, these factors position lithium-ion batteries as a critical enabler of the global transition to sustainable energy and advanced technology.
The portable devices segment in the secondary battery industry is driven by the increasing demand for smartphones, laptops, tablets, and wearable devices, fueled by the growing reliance on technology for work, education, and entertainment. Consumers are seeking devices with longer battery life, faster charging, and compact designs, pushing advancements in lithium-ion and other battery technologies.
The secondary battery industry is driven by the growing demand for electric vehicles (EVs), the expansion of renewable energy storage solutions, and increasing consumer electronics adoption. Governments worldwide are implementing policies and incentives to support battery production and electrification, further accelerating market growth.
Secondary Battery Market Report Highlights:
- Based on type, Lithium-ion Batteries held the largest revenue share of over 78.15% in 2024. Lithium-ion batteries are the cornerstone of the market, driven primarily by the rapid adoption of electric vehicles (EVs), which rely heavily on these batteries for their high energy density, long cycle life, and fast charging capabilities.
- Based on applications, Motor vehicles segment held the revenue share of over 33.65% in 2024. Governments worldwide are implementing stringent emission regulations and offering incentives to promote clean transportation, accelerating the demand for high-performance batteries, particularly lithium-ion.
- Asia Pacific is expected to grow at fastest CAGR over the forecast period, driven by fueled by government policies, subsidies, and stringent emission regulations in countries like China, India, and Japan.
Table of Contents
Chapter 1. Methodology and Scope
- 1.1. Market Segmentation & Scope
- 1.2. Market Definition
- 1.3. Information Procurement
- 1.3.1. Information Analysis
- 1.3.2. Market Formulation & Data Visualization
- 1.3.3. Data Validation & Publishing
- 1.4. Research Scope and Assumptions
- 1.4.1. List of Data Sources
Chapter 2. Executive Summary
- 2.1. Market Snapshot
- 2.2. Segmental Outlook
- 2.3. Competitive Outlook
Chapter 3. Market Variables, Trends, and Scope
- 3.1. Market Lineage Outlook
- 3.2. Penetration & Growth Prospect Mapping
- 3.3. Value Chain Analysis
- 3.4. Regulatory Framework
- 3.4.1. Standards & Compliance
- 3.4.2. Regulatory Impact Analysis
- 3.5. Market Dynamics
- 3.5.1. Market Driver Analysis
- 3.5.2. Market Restraint Analysis
- 3.5.3. Market Opportunities
- 3.5.4. Market Challenges
- 3.6. Porter's Five Forces Analysis
- 3.6.1. Bargaining Power of Suppliers
- 3.6.2. Bargaining Power of Buyers
- 3.6.3. Threat of Substitution
- 3.6.4. Threat of New Entrants
- 3.6.5. Competitive Rivalry
- 3.7. PESTLE Analysis
- 3.7.1. Political
- 3.7.2. Economic
- 3.7.3. Social Landscape
- 3.7.4. Technology
- 3.7.5. Environmental
- 3.7.6. Legal
Chapter 4. Secondary Battery Market: Type Estimates & Trend Analysis
- 4.1. Secondary Battery Market: Type Movement Analysis, 2024 & 2030
- 4.2. Lithium-ion
- 4.2.1. Market estimates and forecasts, 2018 - 2030 (USD Million)
- 4.3. Lead acid
- 4.3.1. Market estimates and forecasts, 2018 - 2030 (USD Million)
- 4.4. Nickel Metal Hydride
- 4.4.1. Market estimates and forecasts, 2018 - 2030 (USD Million)
- 4.5. Others
- 4.5.1. Market estimates and forecasts, 2018 - 2030 (USD Million)
Chapter 5. Secondary Battery Market: Application Estimates & Trend Analysis
- 5.1. Secondary Battery Market: Application Movement Analysis, 2024 & 2030
- 5.2. Motor Vehicles
- 5.2.1. Market estimates and forecasts, 2018 - 2030 (USD Million)
- 5.3. Industrial Batteries
- 5.3.1. Market estimates and forecasts, 2018 - 2030 (USD Million)
- 5.4. Portable Devices
- 5.4.1. Market estimates and forecasts, 2018 - 2030 (USD Million)
- 5.5. Electronics
- 5.5.1. Market estimates and forecasts, 2018 - 2030 (USD Million)
- 5.6. Other Applications
- 5.6.1. Market estimates and forecasts, 2018 - 2030 (USD Million)
Chapter 6. Secondary Battery Market: Regional Estimates & Trend Analysis
- 6.1. Regional Analysis, 2024 & 2030
- 6.2. North America
- 6.2.1. Market estimates and forecasts, 2018 - 2030 (USD Million)
- 6.2.2. Market estimates and forecasts, by type, 2018 - 2030 (USD Million)
- 6.2.3. Market estimates and forecasts, by application, 2018 - 2030 (USD Million)
- 6.2.4. U.S.
- 6.2.4.1. Market estimates and forecasts, 2018 - 2030 (USD Million)
- 6.2.4.2. Market estimates and forecasts, by type, 2018 - 2030 (USD Million)
- 6.2.4.3. Market estimates and forecasts, by application, 2018 - 2030 (USD Million)
- 6.2.5. Canada
- 6.2.5.1. Market estimates and forecasts, 2018 - 2030 (USD Million)
- 6.2.5.2. Market estimates and forecasts, by type, 2018 - 2030 (USD Million)
- 6.2.5.3. Market estimates and forecasts, by application, 2018 - 2030 (USD Million)
- 6.2.6. Mexico
- 6.2.6.1. Market estimates and forecasts, 2018 - 2030 (USD Million)
- 6.2.6.2. Market estimates and forecasts, by type, 2018 - 2030 (USD Million)
- 6.2.6.3. Market estimates and forecasts, by application, 2018 - 2030 (USD Million)
- 6.3. Europe
- 6.3.1. Market estimates and forecasts, 2018 - 2030 (USD Million)
- 6.3.2. Market estimates and forecasts, by type, 2018 - 2030 (USD Million)
- 6.3.3. Market estimates and forecasts, by application, 2018 - 2030 (USD Million)
- 6.3.4. Germany
- 6.3.4.1. Market estimates and forecasts, 2018 - 2030 (USD Million)
- 6.3.4.2. Market estimates and forecasts, by type, 2018 - 2030 (USD Million)
- 6.3.4.3. Market estimates and forecasts, by application, 2018 - 2030 (USD Million)
- 6.3.5. UK
- 6.3.5.1. Market estimates and forecasts, 2018 - 2030 (USD Million)
- 6.3.5.2. Market estimates and forecasts, by type, 2018 - 2030 (USD Million)
- 6.3.5.3. Market estimates and forecasts, by application, 2018 - 2030 (USD Million)
- 6.3.6. France
- 6.3.6.1. Market estimates and forecasts, 2018 - 2030 (USD Million)
- 6.3.6.2. Market estimates and forecasts, by type, 2018 - 2030 (USD Million)
- 6.3.6.3. Market estimates and forecasts, by application, 2018 - 2030 (USD Million)
- 6.4. Asia Pacific
- 6.4.1. Market estimates and forecasts, 2018 - 2030 (USD Million)
- 6.4.2. Market estimates and forecasts, by type, 2018 - 2030 (USD Million)
- 6.4.3. Market estimates and forecasts, by application, 2018 - 2030 (USD Million)
- 6.4.4. China
- 6.4.4.1. Market estimates and forecasts, 2018 - 2030 (USD Million)
- 6.4.4.2. Market estimates and forecasts, by type, 2018 - 2030 (USD Million)
- 6.4.4.3. Market estimates and forecasts, by application, 2018 - 2030 (USD Million)
- 6.4.5. India
- 6.4.5.1. Market estimates and forecasts, 2018 - 2030 (USD Million)
- 6.4.5.2. Market estimates and forecasts, by type, 2018 - 2030 (USD Million)
- 6.4.5.3. Market estimates and forecasts, by application, 2018 - 2030 (USD Million)
- 6.4.6. Japan
- 6.4.6.1. Market estimates and forecasts, 2018 - 2030 (USD Million)
- 6.4.6.2. Market estimates and forecasts, by type, 2018 - 2030 (USD Million)
- 6.4.6.3. Market estimates and forecasts, by application, 2018 - 2030 (USD Million)
- 6.4.7. South Korea
- 6.4.7.1. Market estimates and forecasts, 2018 - 2030 (USD Million)
- 6.4.7.2. Market estimates and forecasts, by type, 2018 - 2030 (USD Million)
- 6.4.7.3. Market estimates and forecasts, by application, 2018 - 2030 (USD Million)
- 6.5. Central & South America
- 6.5.1. Market estimates and forecasts, 2018 - 2030 (USD Million)
- 6.5.2. Market estimates and forecasts, by type, 2018 - 2030 (USD Million)
- 6.5.3. Market estimates and forecasts, by application, 2018 - 2030 (USD Million)
- 6.5.4. Brazil
- 6.5.4.1. Market estimates and forecasts, 2018 - 2030 (USD Million)
- 6.5.4.2. Market estimates and forecasts, by type, 2018 - 2030 (USD Million)
- 6.5.4.3. Market estimates and forecasts, by application, 2018 - 2030 (USD Million)
- 6.6. Middle East & Africa
- 6.6.1. Market estimates and forecasts, 2018 - 2030 (USD Million)
- 6.6.2. Market estimates and forecasts, by type, 2018 - 2030 (USD Million)
- 6.6.3. Market estimates and forecasts, by application, 2018 - 2030 (USD Million)
- 6.6.4. Saudi Arabia
- 6.6.4.1. Market estimates and forecasts, 2018 - 2030 (USD Million)
- 6.6.4.2. Market estimates and forecasts, by type, 2018 - 2030 (USD Million)
- 6.6.4.3. Market estimates and forecasts, by application, 2018 - 2030 (USD Million)
- 6.6.5. UAE
- 6.6.5.1. Market estimates and forecasts, 2018 - 2030 (USD Million)
- 6.6.5.2. Market estimates and forecasts, by type, 2018 - 2030 (USD Million)
- 6.6.5.3. Market estimates and forecasts, by application, 2018 - 2030 (USD Million)
Chapter 7. Competitive Landscape
- 7.1. Recent Developments, By Key Market Participants
- 7.2. Company Categorization
- 7.3. List of Key Component Suppliers & Channel Partners
- 7.4. Company Market Share & Positioning Analysis, 2024
- 7.5. Heat Map Analysis
- 7.6. Vendor Landscape
- 7.6.1. List of Raw Material Suppliers
- 7.6.2. List of Distributors/Traders
- 7.6.3. List of Other Prominent Manufacturers
- 7.7. List of Prospective End Users
- 7.8. Strategy Mapping
- 7.9. Company Profiles/Listing
- 7.9.1. LG Chem
- 7.9.1.1. Company Overview
- 7.9.1.2. Financial Performance
- 7.9.1.3. Product Benchmarking
- 7.9.2. Hitachi High-Tech India Private Limited
- 7.9.2.1. Company Overview
- 7.9.2.2. Financial Performance
- 7.9.2.3. Product Benchmarking
- 7.9.3. Aquion Energy LLC
- 7.9.3.1. Company Overview
- 7.9.3.2. Financial Performance
- 7.9.3.3. Product Benchmarking
- 7.9.4. Johnson Controls
- 7.9.4.1. Company Overview
- 7.9.4.2. Financial Performance
- 7.9.4.3. Product Benchmarking
- 7.9.5. BTI
- 7.9.5.1. Company Overview
- 7.9.5.2. Financial Performance
- 7.9.5.3. Product Benchmarking
- 7.9.6. Amperex Technologies
- 7.9.6.1. Company Overview
- 7.9.6.2. Financial Performance
- 7.9.6.3. Product Benchmarking
- 7.9.7. Panasonic Corporation
- 7.9.7.1. Company Overview
- 7.9.7.2. Financial Performance
- 7.9.7.3. Product Benchmarking
- 7.9.8. BYD Company Ltd.
- 7.9.8.1. Company Overview
- 7.9.8.2. Financial Performance
- 7.9.8.3. Product Benchmarking
- 7.9.9. SAMSUNG SDI CO., LTD.
- 7.9.9.1. Company Overview
- 7.9.9.2. Financial Performance
- 7.9.9.3. Product Benchmarking
- 7.9.10. Energizer Holdings Inc.
- 7.9.10.1. Company Overview
- 7.9.10.2. Financial Performance
- 7.9.10.3. Product Benchmarking
- 7.9.1. LG Chem
