|
|
市場調査レポート
商品コード
1678527
腫瘍アブレーションの世界市場:市場規模・シェア・動向分析 (技術別・治療法別・用途別・地域別)、セグメント別予測 (2025年~2030年)Tumor Ablation Market Size, Share & Trends Analysis Report By Technology (Radiofrequency, Microwave), By Treatment (Surgical, Laparoscopic), By Application (Liver Cancer), By Region, And Segment Forecasts, 2025 - 2030 |
||||||

|
|||||||
カスタマイズ可能
|
|||||||

| 腫瘍アブレーションの世界市場:市場規模・シェア・動向分析 (技術別・治療法別・用途別・地域別)、セグメント別予測 (2025年~2030年) |
|
出版日: 2025年02月03日
発行: Grand View Research
ページ情報: 英文 180 Pages
納期: 2~10営業日
|

全表示
- 概要
- 図表
- 目次
腫瘍アブレーション市場の成長と動向:
Grand View Research, Inc.の最新レポートによると、世界の腫瘍アブレーションの市場規模は2030年までに40億8,000万米ドルに達すると推定され、2025年から2030年にかけて13.8%のCAGRで成長すると予測されています。
がんの罹患率の増加と効果的な治療オプションに対する需要の高さが市場成長の主な要因です。国際がん研究機関によると、2020年には19,292,789人のがん患者が報告され、2025年には50,550,287人に達すると予測されています。乳がん、肺がん、大腸がん、前立腺がん、胃がんが最も多く報告されています。回復の早さ、患者の快適さ、所要時間の短さなどの利点から、低侵襲手技への嗜好が高まっており、高度な腫瘍アブレーション手技の需要を牽引すると予測されています。
さらに、このような装置と超音波、MRI、CTのような非常に効果的なインターベンショナル・イメージング技術との統合は、外来で行われるアブレーション処置に変革をもたらすと考えられています。このシフトは、入院に関連する費用を含め、患者のコストを大幅に削減すると予想されます。検診プログラム、啓発キャンペーン、特定のがんスキームなどの政府主催のイニシアチブは、診断症例数を増加させると予測されます。例えば、2019年、英国の国民保健制度(NHS)は、特定の地域で肺がん検診プログラムを開始しました。このような取り組みにより、早期がん管理の需要が増加し、市場成長が促進されると予測されます。
腫瘍アブレーション市場レポートハイライト
- 技術別では、高周波腫瘍アブレーション分野が2024年に32.8%の最大売上シェアで市場を牽引。
- 技術別では、経皮的アブレーションセグメントが2024年に最大の収益シェアを占めました。
- 用途別では、その他のセグメントが2024年に最大の市場シェアを占めました。その他のセグメントには、骨転移や耳鼻咽喉がんなど、さまざまな種類のがんが含まれます。
- 北米は、2024年に34.33%の最大の収益シェアを占め、腫瘍アブレーション市場を独占しました。
目次
第1章 分析方法・範囲
第2章 エグゼクティブサマリー
第3章 腫瘍アブレーション市場:変動要因・傾向・範囲
- 市場連関の見通し
- 親市場の見通し
- 関連/付随市場の見通し
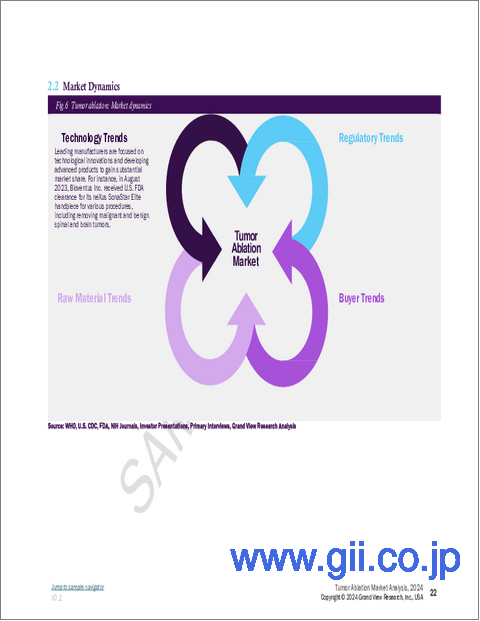
- 市場力学
- 市場促進要因の分析
- 市場抑制要因の分析
- 腫瘍アブレーション市場:分析ツール
- 業界分析:ポーターのファイブフォース分析
- PESTEL分析
第4章 腫瘍アブレーション市場:技術別の推定・動向分析
- 定義と範囲
- 高周波アブレーション
- マイクロ波アブレーション
- 凍結療法
- 不可逆的電気穿孔アブレーション
- HIFU
- その他のアブレーション技術
- 市場シェア:技術別 (2024年・2030年)
- セグメントダッシュボード
- 世界の腫瘍アブレーション市場:技術別の展望
- 市場規模の予測と動向分析:技術別 (2018~2030年)
- 高周波アブレーション
- マイクロ波アブレーション
- 凍結療法
- 不可逆的電気穿孔アブレーション
- HIFU
- その他のアブレーション技術
第5章 腫瘍アブレーション市場:治療法別の推定・動向分析
- 定義と範囲
- 外科的アブレーション
- 腹腔鏡下アブレーション
- 経皮的アブレーション
- 市場シェア:治療法別 (2024年・2030年)
- セグメントダッシュボード
- 世界の腫瘍アブレーション市場:治療法別の展望
- 市場規模の予測と動向分析:治療法別 (2018~2030年)
- 外科的アブレーション
- 腹腔鏡下アブレーション
- 経皮的アブレーション
第6章 腫瘍アブレーション市場:用途別の推定・動向分析
- 定義と範囲
- 腎臓がん
- 肝臓がん
- 乳がん
- 肺がん
- 前立腺がん
- その他のがん
- 市場シェア:用途別 (2024年・2030年)
- セグメントダッシュボード
- 世界の腫瘍アブレーション市場:用途別の展望
- 市場規模の予測と動向分析:用途別 (2018~2030年)
- 腎臓がん
- 肝臓がん
- 乳がん
- 肺がん
- 前立腺がん
- その他のがん
第7章 腫瘍アブレーション市場:地域別の推定・動向分析
- 市場シェア分析:地域別 (2024年・2030年)
- 市場ダッシュボード:地域別
- 世界市場のスナップショット:地域別
- 市場規模の予測と動向分析 (2018~2030年)
- 北米
- 米国
- カナダ
- 欧州
- 英国
- ドイツ
- フランス
- イタリア
- スペイン
- ノルウェー
- スウェーデン
- デンマーク
- アジア太平洋
- 日本
- 中国
- インド
- オーストラリア
- 韓国
- タイ
- ラテンアメリカ
- ブラジル
- メキシコ
- アルゼンチン
- 中東・アフリカ
- 南アフリカ
- サウジアラビア
- アラブ首長国連邦
- クウェート
第8章 競合情勢
- 最新動向と影響分析:主な市場参入企業別
- 企業/競合の分類
- イノベーター
- ベンダー情勢
- 主要販売代理店およびチャネルパートナーのリスト
- 主要顧客
- 主要企業の市場シェア分析(2024年)
- Medtronic
- Boston Scientific Corporation
- Johnson &Johnson Service Inc.(Ethicon, Inc.)
- AngioDynamics
- Bioventus Inc.(Misonix Inc.)
- EDAP TMS
- Chongqing Haifu Medical Technology Co., Ltd
- Mermaid Medical
- HealthTronics, Inc.
- HS Hospital Service SpA
List of Tables
- Table 1 List of Abbreviation
- Table 2 North America tumor ablation market, by region, 2018 - 2030 (USD Million)
- Table 3 North America tumor ablation market, by technology, 2018 - 2030 (USD Million)
- Table 4 North America tumor ablation market, by treatment, 2018 - 2030 (USD Million)
- Table 5 North America tumor ablation market, by application, 2018 - 2030 (USD Million)
- Table 6 North America tumor ablation market, by application, 2018 - 2030 (USD Million)
- Table 7 U.S tumor ablation market, by technology, 2018 - 2030 (USD Million)
- Table 8 U.S tumor ablation market, by treatment, 2018 - 2030 (USD Million)
- Table 9 U.S tumor ablation market, by application, 2018 - 2030 (USD Million)
- Table 10 Canada tumor ablation market, by technology, 2018 - 2030 (USD Million)
- Table 11 Canada tumor ablation market, by treatment, 2018 - 2030 (USD Million)
- Table 12 Canada tumor ablation market, by application, 2018 - 2030 (USD Million)
- Table 13 Europe tumor ablation market, by region, 2018 - 2030 (USD Million)
- Table 14 Europe tumor ablation market, by technology, 2018 - 2030 (USD Million)
- Table 15 Europe tumor ablation market, by treatment, 2018 - 2030 (USD Million)
- Table 16 Europe tumor ablation market, by application, 2018 - 2030 (USD Million)
- Table 17 Germany tumor ablation market, by technology, 2018 - 2030 (USD Million)
- Table 18 Germany tumor ablation market, by treatment, 2018 - 2030 (USD Million)
- Table 19 Germany tumor ablation market, by application, 2018 - 2030 (USD Million)
- Table 20 UK tumor ablation market, by technology, 2018 - 2030 (USD Million)
- Table 21 UK tumor ablation market, by treatment, 2018 - 2030 (USD Million)
- Table 22 UK tumor ablation market, by application, 2018 - 2030 (USD Million)
- Table 23 France tumor ablation market, by technology, 2018 - 2030 (USD Million)
- Table 24 France tumor ablation market, by treatment, 2018 - 2030 (USD Million)
- Table 25 France tumor ablation market, by application, 2018 - 2030 (USD Million)
- Table 26 Italy tumor ablation market, by technology, 2018 - 2030 (USD Million)
- Table 27 Italy tumor ablation market, by treatment, 2018 - 2030 (USD Million)
- Table 28 Italy tumor ablation market, by application, 2018 - 2030 (USD Million)
- Table 29 Spain tumor ablation market, by technology, 2018 - 2030 (USD Million)
- Table 30 Spain tumor ablation market, by treatment, 2018 - 2030 (USD Million)
- Table 31 Spain tumor ablation market, by application, 2018 - 2030 (USD Million)
- Table 32 Denmark tumor ablation market, by technology, 2018 - 2030 (USD Million)
- Table 33 Denmark tumor ablation market, by treatment, 2018 - 2030 (USD Million)
- Table 34 Denmark tumor ablation market, by application, 2018 - 2030 (USD Million)
- Table 35 Sweden tumor ablation market, by technology, 2018 - 2030 (USD Million)
- Table 36 Sweden tumor ablation market, by treatment, 2018 - 2030 (USD Million)
- Table 37 Sweden tumor ablation market, by application, 2018 - 2030 (USD Million)
- Table 38 Norway tumor ablation market, by technology, 2018 - 2030 (USD Million)
- Table 39 Norway tumor ablation market, by treatment, 2018 - 2030 (USD Million)
- Table 40 Norway tumor ablation market, by application, 2018 - 2030 (USD Million)
- Table 41 Asia Pacific tumor ablation market, by region, 2018 - 2030 (USD Million)
- Table 42 Asia Pacific tumor ablation market, by technology, 2018 - 2030 (USD Million)
- Table 43 Asia Pacific tumor ablation market, by treatment, 2018 - 2030 (USD Million)
- Table 44 Asia Pacific tumor ablation market, by application, 2018 - 2030 (USD Million)
- Table 45 China tumor ablation market, by technology, 2018 - 2030 (USD Million)
- Table 46 China tumor ablation market, by treatment, 2018 - 2030 (USD Million)
- Table 47 China tumor ablation market, by application, 2018 - 2030 (USD Million)
- Table 48 Japan tumor ablation market, by technology, 2018 - 2030 (USD Million)
- Table 49 Japan tumor ablation market, by treatment, 2018 - 2030 (USD Million)
- Table 50 Japan tumor ablation market, by application, 2018 - 2030 (USD Million)
- Table 51 India tumor ablation market, by technology, 2018 - 2030 (USD Million)
- Table 52 India tumor ablation market, by treatment, 2018 - 2030 (USD Million)
- Table 53 India tumor ablation market, by application, 2018 - 2030 (USD Million)
- Table 54 South Korea tumor ablation market, by technology, 2018 - 2030 (USD Million)
- Table 55 South Korea tumor ablation market, by treatment, 2018 - 2030 (USD Million)
- Table 56 South Korea tumor ablation market, by application, 2018 - 2030 (USD Million)
- Table 57 Australia tumor ablation market, by technology, 2018 - 2030 (USD Million)
- Table 58 Australia tumor ablation market, by treatment, 2018 - 2030 (USD Million)
- Table 59 Australia tumor ablation market, by application, 2018 - 2030 (USD Million)
- Table 60 Thailand tumor ablation market, by technology, 2018 - 2030 (USD Million)
- Table 61 Thailand tumor ablation market, by treatment, 2018 - 2030 (USD Million)
- Table 62 Thailand tumor ablation market, by application, 2018 - 2030 (USD Million)
- Table 63 Latin America tumor ablation market, by technology, 2018 - 2030 (USD Million)
- Table 64 Latin America tumor ablation market, by treatment, 2018 - 2030 (USD Million)
- Table 65 Latin America surgical ablation market, by application, 2018 - 2030 (USD Million)
- Table 66 Latin America laparoscopic ablation market, by application, 2018 - 2030 (USD Million)
- Table 67 Latin America percutaneous ablation market, by application, 2018 - 2030 (USD Million)
- Table 68 Latin America tumor ablation market, by application, 2018 - 2030 (USD Million)
- Table 69 Brazil tumor ablation market, by technology, 2018 - 2030 (USD Million)
- Table 70 Brazil tumor ablation market, by treatment, 2018 - 2030 (USD Million)
- Table 71 Brazil surgical ablation market, by application, 2018 - 2030 (USD Million)
- Table 72 Brazil laparoscopic ablation market, by application, 2018 - 2030 (USD Million)
- Table 73 Brazil percutaneous ablation market, by application, 2018 - 2030 (USD Million)
- Table 74 Brazil tumor ablation market, by application, 2018 - 2030 (USD Million)
- Table 75 Mexico tumor ablation market, by technology, 2018 - 2030 (USD Million)
- Table 76 Mexico tumor ablation market, by treatment, 2018 - 2030 (USD Million)
- Table 77 Mexico surgical ablation market, by application, 2018 - 2030 (USD Million)
- Table 78 Mexico laparoscopic ablation market, by application, 2018 - 2030 (USD Million)
- Table 79 Mexico percutaneous ablation market, by application, 2018 - 2030 (USD Million)
- Table 80 Mexico tumor ablation market, by application, 2018 - 2030 (USD Million)
- Table 81 Argentina tumor ablation market, by technology, 2018 - 2030 (USD Million)
- Table 82 Argentina tumor ablation market, by treatment, 2018 - 2030 (USD Million)
- Table 83 Argentina surgical ablation market, by application, 2018 - 2030 (USD Million)
- Table 84 Argentina laparoscopic ablation market, by application, 2018 - 2030 (USD Million)
- Table 85 Argentina percutaneous ablation market, by application, 2018 - 2030 (USD Million)
- Table 86 Argentina tumor ablation market, by application, 2018 - 2030 (USD Million)
- Table 87 MEA tumor ablation market, by region, 2018 - 2030 (USD Million)
- Table 88 MEA tumor ablation market, by technology, 2018 - 2030 (USD Million)
- Table 89 MEA tumor ablation market, by treatment, 2018 - 2030 (USD Million)
- Table 90 MEA tumor ablation market, by application, 2018 - 2030 (USD Million)
- Table 91 South Africa tumor ablation market, by technology, 2018 - 2030 (USD Million)
- Table 92 South Africa tumor ablation market, by treatment, 2018 - 2030 (USD Million)
- Table 93 South Africa tumor ablation market, by application, 2018 - 2030 (USD Million)
- Table 94 Saudi Arabia tumor ablation market, by technology, 2018 - 2030 (USD Million)
- Table 95 Saudi Arabia tumor ablation market, by treatment, 2018 - 2030 (USD Million)
- Table 96 Saudi Arabia tumor ablation market, by application, 2018 - 2030 (USD Million)
- Table 97 UAE tumor ablation market, by technology, 2018 - 2030 (USD Million)
- Table 98 UAE tumor ablation market, by treatment, 2018 - 2030 (USD Million)
- Table 99 UAE tumor ablation market, by application, 2018 - 2030 (USD Million)
- Table 100 Kuwait tumor ablation market, by technology, 2018 - 2030 (USD Million)
- Table 101 Kuwait tumor ablation market, by treatment, 2018 - 2030 (USD Million)
- Table 102 Kuwait tumor ablation market, by application, 2018 - 2030 (USD Million)
List of Figures
- Fig. 1 Market research process
- Fig. 2 Data triangulation techniques
- Fig. 3 Primary research pattern
- Fig. 4 Primary interviews in North America
- Fig. 5 Primary interviews in Europe
- Fig. 6 Primary interviews in APAC
- Fig. 7 Primary interviews in Latin America
- Fig. 8 Primary interviews in MEA
- Fig. 9 Market research approaches
- Fig. 10 Value-chain-based sizing & forecasting
- Fig. 11 QFD modeling for market share assessment
- Fig. 12 Market formulation & validation
- Fig. 13 Tumor ablation market: market outlook
- Fig. 14 Tumor ablation competitive insights
- Fig. 15 Parent market outlook
- Fig. 16 Related/ancillary market outlook
- Fig. 17 Penetration and growth prospect mapping
- Fig. 18 Industry value chain analysis
- Fig. 19 Tumor ablation market driver impact
- Fig. 20 Tumor ablation market restraint impact
- Fig. 21 Tumor ablation market strategic initiatives analysis
- Fig. 22 Tumor ablation market: Technology movement analysis
- Fig. 23 Tumor ablation market: Technology outlook and key takeaways
- Fig. 24 Radiofrequency ablation market estimates and forecast, 2018 - 2030
- Fig. 25 Microwave ablation estimates and forecast, 2018 - 2030
- Fig. 26 Cryoablation market estimates and forecast, 2018 - 2030
- Fig. 27 Irreversible electroporation ablation estimates and forecast, 2018 - 2030
- Fig. 28 HIFU market estimates and forecast, 2018 - 2030
- Fig. 29 Others estimates and forecast, 2018 - 2030
- Fig. 30 Tumor ablation Market: Treatment Movement Analysis
- Fig. 31 Tumor ablation market: Treatment outlook and key takeaways
- Fig. 32 Surgical ablation market estimates and forecast, 2018 - 2030
- Fig. 33 Percutaneous ablation market estimates and forecast, 2018 - 2030
- Fig. 34 Laparoscopic ablation market estimates and forecast, 2018 - 2030
- Fig. 35 Tumor ablation market: application movement analysis
- Fig. 36 Tumor ablation market: application outlook and key takeaways
- Fig. 37 Kidney cancer market estimates and forecast, 2018 - 2030
- Fig. 38 Liver cancer market estimates and forecast, 2018 - 2030
- Fig. 39 Breast cancer market estimates and forecast, 2018 - 2030
- Fig. 40 Lung cancer market estimates and forecast, 2018 - 2030
- Fig. 41 Prostate cancer market estimates and forecast, 2018 - 2030
- Fig. 42 Other market estimates and forecast, 2018 - 2030
- Fig. 43 Global tumor ablation market: Regional movement analysis
- Fig. 44 Global tumor ablation market: Regional outlook and key takeaways
- Fig. 45 Global tumor ablation market share and leading players
- Fig. 46 North America market share and leading players
- Fig. 47 Europe market share and leading players
- Fig. 48 Asia Pacific market share and leading players
- Fig. 49 Latin America market share and leading players
- Fig. 50 Middle East & Africa market share and leading players
- Fig. 51 North America: SWOT
- Fig. 52 Europe SWOT
- Fig. 53 Asia Pacific SWOT
- Fig. 54 Latin America SWOT
- Fig. 55 MEA SWOT
- Fig. 56 North America
- Fig. 57 North America market estimates and forecast, 2018 - 2030
- Fig. 58 US
- Fig. 59 US market estimates and forecast, 2018 - 2030
- Fig. 60 Canada
- Fig. 61 Canada market estimates and forecast, 2018 - 2030
- Fig. 62 Europe
- Fig. 63 Europe market estimates and forecast, 2018 - 2030
- Fig. 64 UK
- Fig. 65 UK market estimates and forecast, 2018 - 2030
- Fig. 66 Germany
- Fig. 67 Germany market estimates and forecast, 2018 - 2030
- Fig. 68 France
- Fig. 69 France market estimates and forecast, 2018 - 2030
- Fig. 70 Italy
- Fig. 71 Italy market estimates and forecast, 2018 - 2030
- Fig. 72 Spain
- Fig. 73 Spain market estimates and forecast, 2018 - 2030
- Fig. 74 Denmark
- Fig. 75 Denmark market estimates and forecast, 2018 - 2030
- Fig. 76 Sweden
- Fig. 77 Sweden market estimates and forecast, 2018 - 2030
- Fig. 78 Norway
- Fig. 79 Norway market estimates and forecast, 2018 - 2030
- Fig. 80 Asia Pacific
- Fig. 81 Asia Pacific market estimates and forecast, 2018 - 2030
- Fig. 82 China
- Fig. 83 China market estimates and forecast, 2018 - 2030
- Fig. 84 Japan
- Fig. 85 Japan market estimates and forecast, 2018 - 2030
- Fig. 86 India
- Fig. 87 India market estimates and forecast, 2018 - 2030
- Fig. 88 Thailand
- Fig. 89 Thailand market estimates and forecast, 2018 - 2030
- Fig. 90 South Korea
- Fig. 91 South Korea market estimates and forecast, 2018 - 2030
- Fig. 92 Australia
- Fig. 93 Australia market estimates and forecast, 2018 - 2030
- Fig. 94 Latin America
- Fig. 95 Latin America market estimates and forecast, 2018 - 2030
- Fig. 96 Brazil
- Fig. 97 Brazil market estimates and forecast, 2018 - 2030
- Fig. 98 Mexico
- Fig. 99 Mexico market estimates and forecast, 2018 - 2030
- Fig. 100 Argentina
- Fig. 101 Argentina market estimates and forecast, 2018 - 2030
- Fig. 102 Middle East and Africa
- Fig. 103 Middle East and Africa market estimates and forecast, 2018 - 2030
- Fig. 104 South Africa
- Fig. 105 South Africa market estimates and forecast, 2018 - 2030
- Fig. 106 Saudi Arabia
- Fig. 107 Saudi Arabia market estimates and forecast, 2018 - 2030
- Fig. 108 UAE
- Fig. 109 UAE market estimates and forecast, 2018 - 2030
- Fig. 110 Kuwait
- Fig. 111 Kuwait market estimates and forecast, 2018 - 2030
- Fig. 112 Market share of key market players - Tumor ablation market
Tumor Ablation Market Growth & Trends:
The global tumor ablation market size is estimated to reach USD 4.08 billion by 2030, registering to grow at a CAGR of 13.8% from 2025 to 2030 according to a new report by Grand View Research, Inc. An increasing incidence of cancer and high demand for effective treatment options are the major factors contributing to market growth. According to the International Agency for Research on Cancer, 19,292,789 cancer cases were reported in 2020, and are expected to reach 50,550,287 by 2025. Breast, lung, colorectum, prostate, and stomach are the most common cancers reported. The growing preference for minimally invasive procedures, attributed to advantages like fast recovery, patient comfort, and shorter turnaround times, is projected to drive demand for advanced tumor ablation techniques.
Furthermore, the integration of such devices with highly effective interventional imaging technologies, such as ultrasound, MRI, and CT, is poised to bring about a transformation in ablation procedures conducted in outpatient settings. This shift is anticipated to substantially reduce costs for patients, including expenses related to hospital stays. Government-sponsored initiatives, including screening programs, awareness campaigns, and specific cancer schemes, are projected to increase the number of diagnosed cases. For instance, in 2019, the National Health Scheme (NHS) in England initiated lung cancer screening programs in selected regions. Such initiatives are expected to increase the demand for early-stage cancer management, thus driving market growth.
Tumor Ablation Market Report Highlights:
- Based on technology, the radiofrequency tumor ablation segment led the market with the largest revenue share of 32.8% in 2024.
- Based on technology, the percutaneous ablation segment accounted for the largest revenue share in 2024.
- Based on application, the other segments accounted for the largest market share in 2024. The other segment includes various types of cancer, such as bone metastasis and ENT cancer.
- North America dominated the tumor ablation market with the largest revenue share of 34.33% in 2024.
Table of Contents
Chapter 1. Methodology and Scope
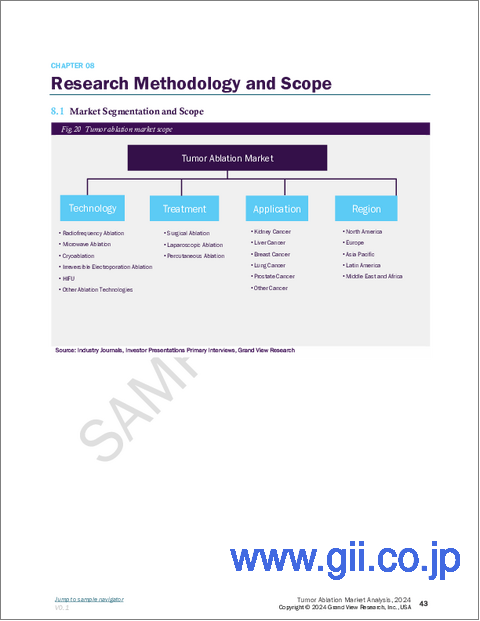
- 1.1. Market Segmentation & Scope
- 1.1.1. Technology
- 1.1.2. Treatment
- 1.1.3. Application
- 1.1.4. Regional scope
- 1.1.5. Estimates and forecast timeline
- 1.2. Research Methodology
- 1.3. Information Procurement
- 1.3.1. Purchased database
- 1.3.2. GVR's internal database
- 1.3.3. Secondary sources
- 1.3.4. Primary research
- 1.3.5. Details of primary research
- 1.3.5.1. Data for primary interviews in North America
- 1.3.5.2. Data for primary interviews in Europe
- 1.3.5.3. Data for primary interviews in Asia Pacific
- 1.3.5.4. Data for primary interviews in Latin America
- 1.3.5.5. Data for Primary interviews in MEA
- 1.4. Information or Data Analysis
- 1.4.1. Data analysis models
- 1.5. Market Formulation & Validation
- 1.6. Model Details
- 1.6.1. Commodity flow analysis (Model 1)
- 1.6.2. Approach 1: Commodity flow approach
- 1.6.3. Volume price analysis (Model 2)
- 1.6.4. Approach 2: Volume price analysis
- 1.7. List of Secondary Sources
- 1.8. List of Primary Sources
- 1.9. Objectives
Chapter 2. Executive Summary
- 2.1. Market Outlook
- 2.2. Segment Outlook
- 2.2.1. Technology outlook
- 2.2.2. Treatment outlook
- 2.2.3. Application outlook
- 2.2.4. Regional outlook
- 2.3. Competitive Insights
Chapter 3. Tumor Ablation Market Variables, Trends & Scope
- 3.1. Market Lineage Outlook
- 3.1.1. Parent market outlook
- 3.1.2. Related/ancillary market outlook
- 3.2. Market Dynamics
- 3.2.1. Market driver analysis
- 3.2.1.1. Rising incidence of cancer
- 3.2.1.2. Technological advancements in ablation devices
- 3.2.1.3. Increasing per capita income
- 3.2.1.4. Growing demand of minimally invasive surgeries.
- 3.2.2. Market restraint analysis
- 3.2.2.1. Stringent regulations & approvals
- 3.2.2.2. Presence of alternative treatment options
- 3.2.1. Market driver analysis
- 3.3. Tumor Ablation Market Analysis Tools
- 3.3.1. Industry Analysis - Porter's
- 3.3.1.1. Supplier power
- 3.3.1.2. Buyer power
- 3.3.1.3. Substitution threat
- 3.3.1.4. Threat of new entrant
- 3.3.1.5. Competitive rivalry
- 3.3.2. PESTEL Analysis
- 3.3.2.1. Political landscape
- 3.3.2.2. Technological landscape
- 3.3.2.3. Economic landscape
- 3.3.1. Industry Analysis - Porter's
Chapter 4. Tumor Ablation Market: Technology Estimates & Trend Analysis
- 4.1. Definitions and Scope
- 4.1.1. Radiofrequency ablation
- 4.1.2. Microwave ablation
- 4.1.3. Cryoablation
- 4.1.4. Irreversible electroporation ablation
- 4.1.5. HIFU
- 4.1.6. Other ablation technologies
- 4.2. Technology Market Share, 2024 & 2030
- 4.3. Segment Dashboard
- 4.4. Global Tumor Ablation Market by Technology Outlook
- 4.5. Market Size & Forecasts and Trend Analyses, 2018 to 2030 for the following
- 4.5.1. Radiofrequency ablation
- 4.5.1.1. Market estimates and forecast 2018 to 2030 (USD Million)
- 4.5.2. Microwave Ablation
- 4.5.2.1. Market estimates and forecast 2018 to 2030 (USD Million)
- 4.5.3. Cryoablation
- 4.5.3.1. Market estimates and forecast 2018 to 2030 (USD Million)
- 4.5.4. Irreversible electroporation ablation
- 4.5.4.1. Market estimates and forecast 2018 to 2030 (USD Million)
- 4.5.5. HIFU
- 4.5.5.1. Market estimates and forecast 2018 to 2030 (USD Million)
- 4.5.6. Other ablation technologies
- 4.5.6.1. Market estimates and forecast 2018 to 2030 (USD Million)
- 4.5.1. Radiofrequency ablation
Chapter 5. Tumor Ablation Market: Treatment Estimates & Trend Analysis
- 5.1. Definitions and Scope
- 5.1.1. Surgical ablation
- 5.1.2. Laparoscopic ablation
- 5.1.3. Percutaneous ablation
- 5.2. Treatment Market Share, 2024 & 2030
- 5.3. Segment Dashboard
- 5.4. Global Tumor Ablation Market by Treatment Outlook
- 5.5. Market Size & Forecasts and Trend Analyses, 2018 to 2030 for the following
- 5.5.1. Surgical ablation
- 5.5.1.1. Market estimates and forecast 2018 to 2030 (USD Million)
- 5.5.2. Laparoscopic ablation
- 5.5.2.1. Market estimates and forecast 2018 to 2030 (USD Million)
- 5.5.3. Percutaneous ablation
- 5.5.3.1. Market estimates and forecast 2018 to 2030 (USD Million)
- 5.5.1. Surgical ablation
Chapter 6. Tumor Ablation Market: Application Estimates & Trend Analysis
- 6.1. Definitions and Scope
- 6.1.1. Kidney cancer
- 6.1.2. Liver cancer
- 6.1.3. Breast cancer
- 6.1.4. Lung cancer
- 6.1.5. Prostate cancer
- 6.1.6. Other cancer
- 6.2. Application Market Share, 2024 & 2030
- 6.3. Segment Dashboard
- 6.4. Global Tumor Ablation Market by Application Outlook
- 6.5. Market Size & Forecasts and Trend Analyses, 2018 to 2030 for the following
- 6.5.1. Kidney cancer
- 6.5.1.1. Market estimates and forecast 2018 to 2030 (USD million)
- 6.5.2. Liver cancer
- 6.5.2.1. Market estimates and forecast 2018 to 2030 (USD Million)
- 6.5.3. Breast cancer
- 6.5.3.1. Market estimates and forecast 2018 to 2030 (USD Million)
- 6.5.4. Lung cancer
- 6.5.4.1. Market estimates and forecast 2018 to 2030 (USD Million)
- 6.5.5. Prostate cancer
- 6.5.5.1. Market estimates and forecast 2018 to 2030 (USD Million)
- 6.5.6. Other cancer
- 6.5.6.1. Market estimates and forecast 2018 to 2030 (USD Million)
- 6.5.1. Kidney cancer
Chapter 7. Tumor Ablation Market: Regional Estimates & Trend Analysis
- 7.1. Regional Market Share Analysis, 2024 & 2030
- 7.2. Regional Market Dashboard
- 7.3. Global Regional Market Snapshot
- 7.4. Market Size & Forecasts Trend Analysis, 2018 to 2030
- 7.5. North America
- 7.5.1. U.S.
- 7.5.1.1. U.S. market estimates and forecast, 2018 - 2030 (USD Million)
- 7.5.2. Canada
- 7.5.2.1. Canada market estimates and forecast, 2018 - 2030 (USD Million)
- 7.5.1. U.S.
- 7.6. Europe
- 7.6.1. UK
- 7.6.1.1. UK market estimates and forecast, 2018 - 2030 (USD Million)
- 7.6.2. Germany
- 7.6.2.1. Germany market estimates and forecast, 2018 - 2030 (USD Million)
- 7.6.3. France
- 7.6.3.1. France market estimates and forecast, 2018 - 2030 (USD Million)
- 7.6.4. Italy
- 7.6.4.1. Italy market estimates and forecast, 2018 - 2030 (USD Million)
- 7.6.5. Spain
- 7.6.5.1. Spain market estimates and forecast, 2018 - 2030 (USD Million)
- 7.6.6. Norway
- 7.6.6.1. Norway market estimates and forecast, 2018 - 2030 (USD Million)
- 7.6.7. Sweden
- 7.6.7.1. Sweden market estimates and forecast, 2018 - 2030 (USD Million)
- 7.6.8. Denmark
- 7.6.8.1. Denmark market estimates and forecast, 2018 - 2030 (USD Million)
- 7.6.1. UK
- 7.7. Asia Pacific
- 7.7.1. Japan
- 7.7.1.1. Japan market estimates and forecast, 2018 - 2030 (USD Million)
- 7.7.2. China
- 7.7.2.1. China market estimates and forecast, 2018 - 2030 (USD Million)
- 7.7.3. India
- 7.7.3.1. India market estimates and forecast, 2018 - 2030 (USD Million)
- 7.7.4. Australia
- 7.7.4.1. Australia market estimates and forecast, 2018 - 2030 (USD Million)
- 7.7.5. South Korea
- 7.7.5.1. South Korea market estimates and forecast, 2018 - 2030 (USD Million)
- 7.7.6. Thailand
- 7.7.6.1. Thailand market estimates and forecast, 2018 - 2030 (USD Million)
- 7.7.1. Japan
- 7.8. Latin America
- 7.8.1. Brazil
- 7.8.1.1. Brazil market estimates and forecast, 2018 - 2030 (USD Million)
- 7.8.2. Mexico
- 7.8.2.1. Mexico market estimates and forecast, 2018 - 2030 (USD Million)
- 7.8.3. Argentina
- 7.8.3.1. Argentina market estimates and forecast, 2018 - 2030 (USD Million)
- 7.8.1. Brazil
- 7.9. MEA
- 7.9.1. South Africa
- 7.9.1.1. South Africa market estimates and forecast, 2018 - 2030 (USD Million)
- 7.9.2. Saudi Arabia
- 7.9.2.1. Saudi Arabia market estimates and forecast, 2018 - 2030 (USD Million)
- 7.9.3. UAE
- 7.9.3.1. UAE market estimates and forecast, 2018 - 2030 (USD Million)
- 7.9.4. Kuwait
- 7.9.4.1. Kuwait market estimates and forecast, 2018 - 2030 (USD Million)
- 7.9.1. South Africa
Chapter 8. Competitive Landscape
- 8.1. Recent Developments & Impact Analysis, By Key Market Participants
- 8.2. Company/Competition Categorization
- 8.2.1. Innovators
- 8.3. Vendor Landscape
- 8.3.1. List of key distributors and channel partners
- 8.3.2. Key customers
- 8.3.3. Key company market share analysis, 2024
- 8.3.4. Medtronic
- 8.3.4.1. Company overview
- 8.3.4.2. Financial performance
- 8.3.4.3. Product benchmarking
- 8.3.4.4. Strategic initiatives
- 8.3.5. Boston Scientific Corporation
- 8.3.5.1. Company overview
- 8.3.5.2. Financial performance
- 8.3.5.3. Product benchmarking
- 8.3.5.4. Strategic initiatives
- 8.3.6. Johnson & Johnson Service Inc. (Ethicon, Inc.)
- 8.3.6.1. Company overview
- 8.3.6.2. Financial performance
- 8.3.6.3. Product benchmarking
- 8.3.6.4. Strategic initiatives
- 8.3.7. AngioDynamics
- 8.3.7.1. Company overview
- 8.3.7.2. Financial performance
- 8.3.7.3. Product benchmarking
- 8.3.7.4. Strategic initiatives
- 8.3.8. Bioventus Inc. (Misonix Inc.)
- 8.3.8.1. Company overview
- 8.3.8.2. Financial performance
- 8.3.8.3. Product benchmarking
- 8.3.8.4. Strategic initiatives
- 8.3.9. EDAP TMS
- 8.3.9.1. Company overview
- 8.3.9.2. Financial performance
- 8.3.9.3. Product benchmarking
- 8.3.9.4. Strategic initiatives
- 8.3.10. Chongqing Haifu Medical Technology Co., Ltd
- 8.3.10.1. Company overview
- 8.3.10.2. Financial performance
- 8.3.10.3. Product benchmarking
- 8.3.10.4. Strategic initiatives
- 8.3.11. Mermaid Medical
- 8.3.11.1. Company overview
- 8.3.11.2. Financial performance
- 8.3.11.3. Product benchmarking
- 8.3.11.4. Strategic initiatives
- 8.3.12. HealthTronics, Inc.
- 8.3.12.1. Company overview
- 8.3.12.2. Financial performance
- 8.3.12.3. Product benchmarking
- 8.3.12.4. Strategic initiatives
- 8.3.13. H.S. Hospital Service S.p.A.
- 8.3.13.1. Company overview
- 8.3.13.2. Financial performance
- 8.3.13.3. Product benchmarking
- 8.3.13.4. Strategic initiatives

