|
|
市場調査レポート
商品コード
1654284
腎機能検査の市場規模、シェア、動向分析レポート:製品別、最終用途別、地域別、セグメント予測、2025年~2030年Kidney Function Tests Market Size, Share & Trends Analysis Report By Product, By End Use, By Region, And Segment Forecasts, 2025 - 2030 |
||||||
|
|||||||
カスタマイズ可能
|
|||||||

| 腎機能検査の市場規模、シェア、動向分析レポート:製品別、最終用途別、地域別、セグメント予測、2025年~2030年 |
|
出版日: 2025年01月20日
発行: Grand View Research
ページ情報: 英文 150 Pages
納期: 2~10営業日
|

全表示
- 概要
- 図表
- 目次
腎機能検査市場の成長と動向:
Grand View Research, Inc.の最新レポートによると、世界の腎機能検査市場規模は2025年から2030年にかけてCAGR 6.7%で推移し、2030年には13億9,000万米ドルに達する見込みです。
腎臓疾患の有病率の高さ、研究開発活動の活発化、市場参入企業による投資の増加、技術革新などの主な要因が、市場成長を大きく促進すると予測されています。さらに、診断検査に対する払い戻しなど、様々な施設を提供するために政府によって実施されているイニシアチブの数が増加していることも、市場を押し上げる主な要因であると考えられます。
事業会社による革新的な腎機能検査のイントロダクションは、これらの診断検査の採用を増加させています。例えば、2022年12月、Journey Biosciences, Inc.は主要製品-NaviDKDを発売しました。これはバイオマーカーに基づく血液検査で、症状が現れる数年前に糖尿病患者の腎疾患の危険性を評価します。特許取得済みのコンパス・レポーティング・プラットフォームとともに、この製品は、合併症が生じる前にそれを管理・予防するための実用的な洞察を提供します。このような開発は、予測期間中の市場の活性化につながると予想されます。
さらに、新製品開発のための研究開発イニシアチブの高まりは、予測期間中の市場成長を大きく促進すると予想されます。例えば、2021年2月、University Hospitals of Derby and Burton, NHS Foundation Trust, and the University of Nottinghamの研究者は、腎疾患の治療と診断の改善に役立てるため、232万米ドルの資金提供を受けました。調査チームは、CKDに苦しむ患者を評価するためにマルチパラメトリックMRIスキャンを使用する予定です。同様に、カナダの腎臓研究組織は、2027年までの活動を支援するために、新たに1,180万米ドルの投資を受けました。Can-SOLVE慢性腎臓病ネットワークは、カナダにおける過去最大の腎臓研究イニシアチブです。
COVID-19パンデミックは、入院の増加や国内各地の感染ホットスポットと関連しています。2021年6月までに世界中で少なくとも3回のCOVID-19の波があり、病院の資源、特に労働力や透析機器・用品の入手に大きな負担がかかりました。さらに、COVID-19パンデミックは腎疾患患者のヘルスケアサービスにも影響を与えました。社会的距離の取り方とロックダウンが世界の標準となり、他の医療サービスの一時的閉鎖につながりました。パンデミックの間、緊急でない診察や検査サービスが停止されたため、いくつかの腎疾患の診断が延期されました。
さらに、腎疾患の有病率の増加は、調査期間中の診断検査需要を増加させると予測されています。例えば、全米腎臓財団(The National Kidney Foundation, Inc.)によると、米国では推定3,700万人、すなわち成人の7人に1人以上が何らかの腎疾患を抱えて生活しています。同様に、FDAが発表したデータによると、米国では毎年約1万人の小児が急性腎不全(AKI)を発症しています。これらの小児の生存率は約38%~43%です。AKIを発症した新生児の死亡率は約60%です。このような要因が新生児血液透析の需要を押し上げ、市場の成長を促進すると考えられます。
一方、腎臓病に対する意識の低さが市場成長の妨げになると予想されます。例えば、米国では推定3,700万人の成人が腎臓病を患っていますが、約90%はこの病気に気づいていないです。腎臓病の主な危険因子は、高血圧、糖尿病、心臓病、肥満、腎臓病の家族歴です。しかし、様々な政府機関が腎機能検査に対する意識を高めるためのプログラムを開始しています。例えば、Tamilnadu Kidney Research Foundationは2020年3月まで1,279の啓発プログラムを実施しています。
腎機能検査市場レポートハイライト
- 製品別では、クリアランス検査分野が市場の最大シェアを占めています。これらの検査は、最適な感度と精度により、性能のばらつきを最小限に抑えることができます。低コストで入手しやすいことから、採用が拡大しています。
- 最終用途別では、CKD有病率の増加による体外診断用医薬品(IVD)検査需要の高まりから、2024年の市場シェアは病院分野が圧倒的でした。
- 北米は、ヘルスケアインフラが確立されており、償還政策や政府の取り組みが充実していることから、2024年の世界市場を独占しました。
- アジア太平洋地域は、中国やインドなどの新興経済圏でCKDに関する認知度向上プログラムが増加しているため、将来的に大きく成長すると予想されます。
目次
第1章 調査手法と範囲
第2章 エグゼクティブサマリー
第3章 腎機能検査市場の変数、動向、範囲
- 市場系統の見通し
- 親市場の見通し
- 関連/付随市場の見通し
- 市場力学
- 市場牽引要因分析
- 市場抑制要因分析
- 腎機能検査市場分析ツール
- 業界分析- ポーターのファイブフォース分析
- PESTEL分析
第4章 腎機能検査市場:製品の推定・動向分析
- 製品市場シェア、2024年および2030年
- セグメントダッシュボード
- 世界の腎機能検査市場の製品別展望
- 2018年から2030年までの市場規模と予測および動向分析
- クリアランステスト
- 血液検査
- 尿検査
- 希釈および濃度試験
- その他のテスト
第5章 腎機能検査市場:最終用途の推定・動向分析
- 最終用途市場シェア、2024年および2030年
- セグメントダッシュボード
- 世界の腎機能検査市場の最終用途別展望
- 2018年から2030年までの市場規模と予測および動向分析
- 病院
- 診断検査室
- 調査室および研究所
- その他
第6章 腎機能検査市場:地域の推定・動向分析
- 地域別市場シェア分析、2024年および2030年
- 地域市場ダッシュボード
- 世界地域市場のスナップショット
- 市場規模と予測動向分析、2018年から2030年:
- 北米
- 米国
- カナダ
- メキシコ
- 欧州
- 英国
- ドイツ
- フランス
- イタリア
- スペイン
- ノルウェー
- スウェーデン
- デンマーク
- アジア太平洋
- 日本
- 中国
- インド
- オーストラリア
- 韓国
- タイ
- ラテンアメリカ
- ブラジル
- アルゼンチン
- 中東・アフリカ
- 南アフリカ
- サウジアラビア
- アラブ首長国連邦
- クウェート
第7章 競合情勢
- 主要市場参入企業による最近の動向と影響分析
- 企業/競合の分類
- ベンダー情勢
- Key company market share analysis, 2024
- Danaher
- Danaher
- F. Hoffmann-La Roche Ltd
- Sysmex Corporation
- Siemens Healthineers
- Randox Laboratories Ltd
- Quest Diagnostics
- Acon Laboratories, Inc
- Nova Biomedical Corporation
- Laboratory Corporation Of America Holdings
List of Tables
- Table 1 Premarket approval process
- Table 2 Key companies adopting expansion strategy
- Table 3 Key companies adopting collaboration strategy
- Table 4 Key companies launching new products/services
- Table 5 Key companies adopting partnership strategy
- Table 6 List of Secondary Sources
- Table 7 List of Abbreviations
- Table 8 Global Kidney Function Tests Market, by Product, 2018 - 2030 (USD Million)
- Table 9 Global Kidney Function Tests Market, by End-use, 2018 - 2030 (USD Million)
- Table 10 Global Kidney Function Tests Market, by Region, 2018 - 2030 (USD Million)
- Table 11 North America Kidney Function Tests Market, by Country, 2018 - 2030 (USD Million)
- Table 12 North America Kidney Function Tests Market, by Product, 2018 - 2030 (USD Million)
- Table 13 North America Kidney Function Tests Market, by End-use, 2018 - 2030 (USD Million)
- Table 14 U.S Kidney Function Tests Market, by Product, 2018 - 2030 (USD Million)
- Table 15 U.S Kidney Function Tests Market, by End-use, 2018 - 2030 (USD Million)
- Table 16 Canada Kidney Function Tests Market, by Product, 2018 - 2030 (USD Million)
- Table 17 Canada Kidney Function Tests Market, by End-use, 2018 - 2030 (USD Million)
- Table 18 Mexico Kidney Function Tests Market, by Product, 2018 - 2030 (USD Million)
- Table 19 Mexico Kidney Function Tests Market, by End-use, 2018 - 2030 (USD Million)
- Table 20 Europe Kidney Function Tests Market, by Country, 2018 - 2030 (USD Million)
- Table 21 Europe Kidney Function Tests Market, by Product, 2018 - 2030 (USD Million)
- Table 22 Europe Kidney Function Tests Market, by End-use, 2018 - 2030 (USD Million)
- Table 23 Germany Kidney Function Tests Market, by Product, 2018 - 2030 (USD Million)
- Table 24 Germany Kidney Function Tests Market, by End-use, 2018 - 2030 (USD Million)
- Table 25 UK Kidney Function Tests Market, by Product, 2018 - 2030 (USD Million)
- Table 26 UK Kidney Function Tests Market, by End-use, 2018 - 2030 (USD Million)
- Table 27 France Kidney Function Tests Market, by Product, 2018 - 2030 (USD Million)
- Table 28 France Kidney Function Tests Market, by End-use, 2018 - 2030 (USD Million)
- Table 29 Italy Kidney Function Tests Market, by Product, 2018 - 2030 (USD Million)
- Table 30 Italy Kidney Function Tests Market, by End-use, 2018 - 2030 (USD Million)
- Table 31 Spain Kidney Function Tests Market, by Product, 2018 - 2030 (USD Million)
- Table 32 Spain Kidney Function Tests Market, by End-use, 2018 - 2030 (USD Million)
- Table 33 Denmark Kidney Function Tests Market, by Product, 2018 - 2030 (USD Million)
- Table 34 Denmark Kidney Function Tests Market, by End-use, 2018 - 2030 (USD Million)
- Table 35 Sweden Kidney Function Tests Market, by Product, 2018 - 2030 (USD Million)
- Table 36 Sweden Kidney Function Tests Market, by End-use, 2018 - 2030 (USD Million)
- Table 37 Norway Kidney Function Tests Market, by Product, 2018 - 2030 (USD Million)
- Table 38 Norway Kidney Function Tests Market, by End-use, 2018 - 2030 (USD Million)
- Table 39 Asia Pacific Kidney Function Tests Market, by Country, 2018 - 2030 (USD Million)
- Table 40 Asia Pacific Kidney Function Tests Market, by Product, 2018 - 2030 (USD Million)
- Table 41 Asia Pacific Kidney Function Tests Market, by End-use, 2018 - 2030 (USD Million)
- Table 42 Japan Kidney Function Tests Market, by Product, 2018 - 2030 (USD Million)
- Table 43 Japan Kidney Function Tests Market, by End-use, 2018 - 2030 (USD Million)
- Table 44 China Kidney Function Tests Market, by Product, 2018 - 2030 (USD Million)
- Table 45 China Kidney Function Tests Market, by End-use, 2018 - 2030 (USD Million)
- Table 46 India Kidney Function Tests Market, by Product, 2018 - 2030 (USD Million)
- Table 47 India Kidney Function Tests Market, by End-use, 2018 - 2030 (USD Million)
- Table 48 South Korea Kidney Function Tests Market, by Product, 2018 - 2030 (USD Million)
- Table 49 South Korea Kidney Function Tests Market, by End-use, 2018 - 2030 (USD Million)
- Table 50 Australia Kidney Function Tests Market, by Product, 2018 - 2030 (USD Million)
- Table 51 Australia Kidney Function Tests Market, by End-use, 2018 - 2030 (USD Million)
- Table 52 Singapore Kidney Function Tests Market, by Product, 2018 - 2030 (USD Million)
- Table 53 Singapore Kidney Function Tests Market, by End-use, 2018 - 2030 (USD Million)
- Table 54 Thailand Kidney Function Tests Market, by Product, 2018 - 2030 (USD Million)
- Table 55 Thailand Kidney Function Tests Market, by End-use, 2018 - 2030 (USD Million)
- Table 56 Latin America Kidney Function Tests Market, by Country, 2018 - 2030 (USD Million)
- Table 57 Latin America Kidney Function Tests Market, by Product, 2018 - 2030 (USD Million)
- Table 58 Latin America Kidney Function Tests Market, by End-use, 2018 - 2030 (USD Million)
- Table 59 Brazil Kidney Function Tests Market, by Product, 2018 - 2030 (USD Million)
- Table 60 Brazil Kidney Function Tests Market, by End-use, 2018 - 2030 (USD Million)
- Table 61 Argentina Kidney Function Tests Market, by Product, 2018 - 2030 (USD Million)
- Table 62 Argentina Kidney Function Tests Market, by End-use, 2018 - 2030 (USD Million)
- Table 63 Middle East & Africa Kidney Function Tests Market, by Country, 2018 - 2030 (USD Million)
- Table 64 Middle East & Africa Kidney Function Tests Market, by Product, 2018 - 2030 (USD Million)
- Table 65 Middle East & Africa Kidney Function Tests Market, by End-use, 2018 - 2030 (USD Million)
- Table 66 South Africa Kidney Function Tests Market, by Product, 2018 - 2030 (USD Million)
- Table 67 South Africa Kidney Function Tests Market, by End-use, 2018 - 2030 (USD Million)
- Table 68 Saudi Arabia Kidney Function Tests Market, by Product, 2018 - 2030 (USD Million)
- Table 69 Saudi Arabia Kidney Function Tests Market, by End-use, 2018 - 2030 (USD Million)
- Table 70 UAE Kidney Function Tests Market, by Product, 2018 - 2030 (USD Million)
- Table 71 UAE Kidney Function Tests Market, by End-use, 2018 - 2030 (USD Million)
- Table 72 Kuwait Kidney Function Tests Market, by Product, 2018 - 2030 (USD Million)
- Table 73 Kuwait Kidney Function Tests Market, by End-use, 2018 - 2030 (USD Million)
List of Figures
- Fig. 1 Market research process
- Fig. 2 Data triangulation techniques
- Fig. 3 Primary research pattern
- Fig. 4 Executives contacted
- Fig. 5 Market research approaches
- Fig. 6 Value-chain-based sizing & forecasting
- Fig. 7 QFD modeling for market share assessment
- Fig. 8 Market formulation & validation
- Fig. 9 Kidney function tests market estimation process
- Fig. 10 Market snapshot
- Fig. 11 Market segmentation and scope
- Fig. 12 Penetration and growth prospect mapping
- Fig. 13 SWOT analysis, by factor (political & legal, economic and technological)
- Fig. 14 Porter's five forces analysis
- Fig. 15 Market drivers impact
- Fig. 16 Reported causes of end-stage renal disease in the U.S.
- Fig. 17 Percentage of U.S. adults aged 18 or older with CKD
- Fig. 18 Market restraint relevance analysis (Current & future impact)
- Fig. 19 Kidney function test market: product outlook and key takeaways
- Fig. 20 Kidney function tests market: product movement analysis
- Fig. 21 Clearance tests market estimates and forecast, 2018 - 2030 (USD Million)
- Fig. 22 Blood tests market estimates and forecast, 2018 - 2030 (USD Million)
- Fig. 23 Urine tests market estimates and forecast, 2018 - 2030 (USD Million)
- Fig. 24 Dilution & concentration tests market estimates and forecast, 2018 - 2030 (USD Million)
- Fig. 25 Other tests market estimates and forecast, 2018 - 2030 (USD Million)
- Fig. 26 Kidney function test market: end-use outlook and key takeaways
- Fig. 27 Kidney function test market: end-use movement analysis
- Fig. 28 Hospitals market estimates and forecast, 2018 - 2030 (USD Million)
- Fig. 29 Diagnostic laboratories market estimates and forecast, 2018 - 2030 (USD Million)
- Fig. 30 Research laboratories and institutes market estimates and forecast, 2018 - 2030 (USD Million)
- Fig. 31 Others market estimates and forecast, 2018 - 2030 (USD Million)
- Fig. 32 Regional marketplace: key takeaways
- Fig. 33 North America kidney function tests market estimates and forecasts, 2018 - 2030 (USD Million)
- Fig. 34 U.S. kidney function tests market estimates and forecasts, 2018 - 2030 (USD Million)
- Fig. 35 Canada kidney function tests market estimates and forecasts, 2018 - 2030 (USD Million)
- Fig. 36 Mexico kidney function tests market estimates and forecasts, 2018 - 2030 (USD Million)
- Fig. 37 Europe kidney function tests market estimates and forecasts, 2018 - 2030 (USD Million)
- Fig. 38 Germany kidney function tests market estimates and forecasts, 2018 - 2030 (USD Million)
- Fig. 39 UK kidney function tests market estimates and forecasts, 2018 - 2030 (USD Million)
- Fig. 40 France kidney function tests market estimates and forecasts, 2018 - 2030 (USD Million)
- Fig. 41 Italy kidney function tests market estimates and forecasts, 2018 - 2030 (USD Million)
- Fig. 42 Spain kidney function tests market estimates and forecasts, 2018 - 2030 (USD Million)
- Fig. 43 Denmark kidney function tests market estimates and forecasts, 2018 - 2030 (USD Million)
- Fig. 44 Sweden kidney function tests market estimates and forecasts, 2018 - 2030 (USD Million)
- Fig. 45 Norway kidney function tests market estimates and forecasts, 2018 - 2030 (USD Million)
- Fig. 46 Asia Pacific kidney function tests market estimates and forecasts, 2018 - 2030 (USD Million)
- Fig. 47 Japan kidney function tests market estimates and forecasts, 2018 - 2030 (USD Million)
- Fig. 48 China kidney function tests market estimates and forecasts, 2018 - 2030 (USD Million)
- Fig. 49 India kidney function tests market estimates and forecasts, 2018 - 2030 (USD Million)
- Fig. 50 South Korea kidney function tests market estimates and forecasts, 2018 - 2030 (USD Million)
- Fig. 51 Australia kidney function tests market estimates and forecasts, 2018 - 2030 (USD Million)
- Fig. 52 Thailand kidney function tests market estimates and forecasts, 2018 - 2030 (USD Million)
- Fig. 53 Singapore kidney function tests market estimates and forecasts, 2018 - 2030 (USD Million)
- Fig. 54 Latin America kidney function tests market estimates and forecasts, 2018 - 2030 (USD Million)
- Fig. 55 Brazil kidney function tests market estimates and forecasts, 2018 - 2030 (USD Million)
- Fig. 56 Argentina kidney function tests market estimates and forecasts, 2018 - 2030 (USD Million)
- Fig. 57 Middle East and Africa kidney function tests market estimates and forecasts, 2018 - 2030 (USD Million)
- Fig. 58 South Africa kidney function tests market estimates and forecasts, 2018 - 2030 (USD Million)
- Fig. 59 UAE kidney function tests market estimates and forecasts, 2018 - 2030 (USD Million)
- Fig. 60 Saudi Arabia kidney function tests market estimates and forecasts, 2018 - 2030 (USD Million)
- Fig. 61 Kuwait kidney function tests market estimates and forecasts, 2018 - 2030 (USD Million)
- Fig. 62 Market participant categorization
- Fig. 63 Kidney function tests market share analysis, 2024
- Fig. 64 Strategic framework
Kidney Function Tests Market Growth & Trends:
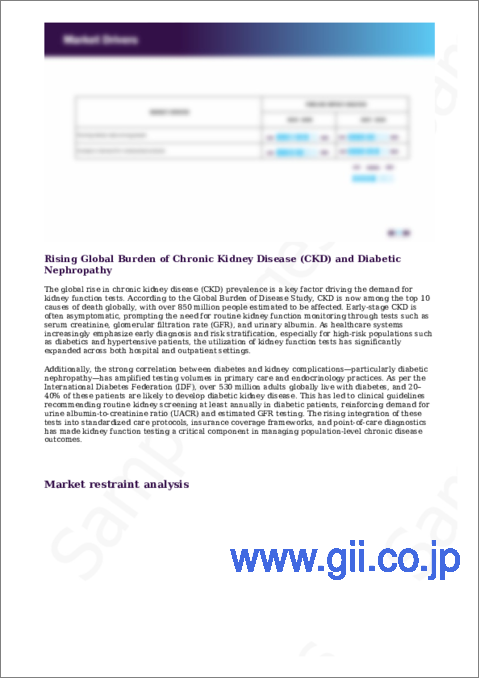
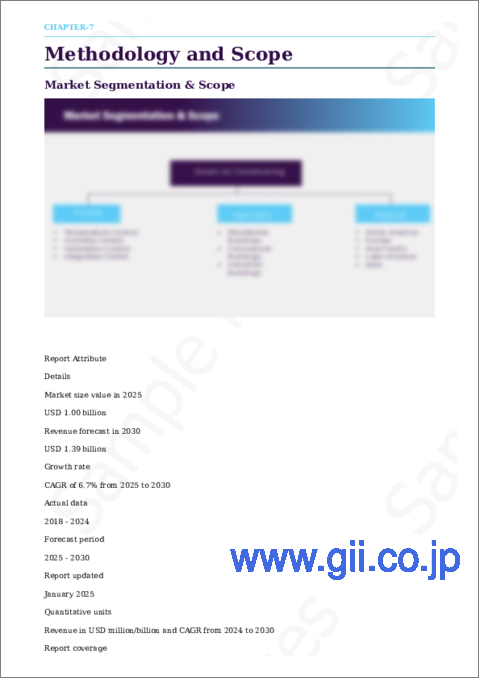
The global kidney function tests market size is expected to reach USD 1.39 billion by 2030, registering at a CAGR of 6.7% from 2025 to 2030, according to a new report by Grand View Research, Inc. Key factors such as high prevalence of kidney diseases, the rising R&D activities, increasing investments by market players, and technological innovations are anticipated to significantly drive the market growth. Moreover, the growing number of initiatives undertaken by the government to provide various facilities, such as reimbursement for diagnostic tests is a major factor likely to boost the market.
Introduction of innovative kidney function tests in the market by the operating players is increasing the adoption of these diagnostics tests. For instance, in December 2022, Journey Biosciences, Inc. launched its leading product-NaviDKD. It is a biomarker-based blood test, which evaluates the peril of renal disease in people with diabetes years before the symptoms appear. Along with its patented compass reporting platform, the product provides actionable insights for managing and preventing complications before they arise. Such developments are foreseen to fuel the market during the forecast period.
Furthermore, rising R&D initiatives for the development of novel products are expected to significantly fuel the market growth during the forecast period. For instance, in February 2021, Researchers from the University Hospitals of Derby and Burton, NHS Foundation Trust, and the University of Nottingham received USD 2.32 million in funding to help improve the treatment and diagnosis of renal diseases. Researchers will use multi-parametric MRI scanning to evaluate patients suffering from CKD. Similarly, the Canadian kidney research organization received a new USD 11.8 million investment to support its work through 2027. The Can-SOLVE Chronic Kidney Disease Network is the largest-ever kidney research initiative in Canada.
The COVID-19 pandemic has been associated with increase in hospitalization and infection hotspots around the country. There were at least three separate waves of COVID-19 around the world by June 2021 that put a significant strain on hospital resources, especially labor and availability of dialysis equipment & supplies. In addition, the COVID-19 pandemic has affected healthcare services for renal disease patients. Social distancing and lockdown were mandate norms, globally, leading to temporary closure of other medical services. The diagnosis of several renal diseases deferred during the pandemic due to suspension of non-urgent visits and testing services.
Moreover, the growing prevalence of renal diseases is projected to increase the demand for diagnostic tests during the study period. For instance, according to The National Kidney Foundation, Inc., an estimated 37 million people in the U.S., i.e., more than one in seven adults, are living with some form of renal disease. Similarly, according to data published by FDA, about 10,000 children in the U.S. develop acute kidney infections (AKI) every year. These children possess a survival rate of around 38%-43%. The mortality rate for neonates with AKI is around 60%. Such factors are likely to drive the demand for neonatal hemodialysis, thereby driving the market growth.
On the other hand, low awareness regarding renal diseases is expected to hamper the market growth. For instance, In the U.S., an estimated 37 million adults have kidney disease and about 90% remain unaware of the condition. Major risk factors for the disease are high blood pressure and diabetes as well as heart disease, obesity, & family history of kidney disease. However, various government bodies are initiating programs for raising awareness of kidney function tests. For instance, Tamilnadu Kidney Research Foundation has conducted 1,279 awareness programs until March 2020.
Kidney Function Tests Market Report Highlights:
- By product, the clearance tests segment held the largest share of the market. These tests ensure that there is minimal variation in performance owing to their optimum sensitivity and precision. The low cost and easy availability of these products in the market lead to their increased adoption.
- By end-user, the hospitals segment accounted for the dominant market share in 2024, due to the rising demand for IVD tests because of increase in the prevalence of CKD.
- North America dominated the global market in 2024 due to the well-established healthcare infrastructure, favorable reimbursement policies and government initiatives in the region.
- Asia Pacific is expected to grow considerably in the future owing to the increasing awareness programs about CKD in emerging economies, such as China & India.
Table of Contents
Chapter 1. Methodology and Scope
- 1.1. Market Segmentation & Scope
- 1.2. Segment Definitions
- 1.2.1. Product
- 1.2.2. End use
- 1.2.3. Application
- 1.2.4. Regional scope
- 1.2.5. Estimates and forecasts timeline
- 1.3. Research Methodology
- 1.4. Information Procurement
- 1.4.1. Purchased database
- 1.4.2. GVR's internal database
- 1.4.3. Secondary sources
- 1.4.4. Primary research
- 1.4.5. Details of primary research
- 1.4.5.1. Data for primary interviews in North America
- 1.4.5.2. Data for primary interviews in Europe
- 1.4.5.3. Data for primary interviews in Asia Pacific
- 1.4.5.4. Data for primary interviews in Latin America
- 1.4.5.5. Data for Primary interviews in MEA
- 1.5. Information or Data Analysis
- 1.5.1. Data analysis models
- 1.6. Market Formulation & Validation
- 1.7. Model Details
- 1.7.1. Commodity flow analysis (Model 1)
- 1.7.2. Approach 1: Commodity flow approach
- 1.7.3. Volume price analysis (Model 2)
- 1.7.4. Approach 2: Volume price analysis
- 1.8. List of Secondary Sources
- 1.9. List of Primary Sources
- 1.10. Objectives
Chapter 2. Executive Summary
- 2.1. Market Outlook
- 2.2. Segment Outlook
- 2.2.1. Product outlook
- 2.2.2. End use outlook
- 2.2.3. Application outlook
- 2.2.4. Regional outlook
- 2.3. Competitive Insights
Chapter 3. Kidney Function Tests Market Variables, Trends & Scope
- 3.1. Market Lineage Outlook
- 3.1.1. Parent market outlook
- 3.1.2. Related/ancillary market outlook
- 3.2. Market Dynamics
- 3.2.1. Market driver analysis
- 3.2.1.1. Introduction Of Innovative Kidney Function Tests
- 3.2.1.2. Increasing Investments In R&D
- 3.2.1.3. Increasing Prevalence Of Acute Kidney Injury And Associated Chronic Kidney Disease
- 3.2.2. Market restraint analysis
- 3.2.2.1. Low Awareness Regarding Kidney Diseases
- 3.2.1. Market driver analysis
- 3.3. Kidney Function Tests Market Analysis Tools
- 3.3.1. Industry Analysis - Porter's
- 3.3.1.1. Supplier power
- 3.3.1.2. Buyer power
- 3.3.1.3. Substitution threat
- 3.3.1.4. Threat of new entrant
- 3.3.1.5. Competitive rivalry
- 3.3.2. PESTEL Analysis
- 3.3.2.1. Political landscape
- 3.3.2.2. Technological landscape
- 3.3.2.3. Economic landscape
- 3.3.1. Industry Analysis - Porter's
Chapter 4. Kidney Function Tests Market: Product Estimates & Trend Analysis
- 4.1. Product Market Share, 2024 & 2030
- 4.2. Segment Dashboard
- 4.3. Global Kidney Function Tests Market by Product Outlook
- 4.4. Market Size & Forecasts and Trend Analyses, 2018 to 2030 for the following
- 4.4.1. Clearance Tests
- 4.4.1.1. Market estimates and forecasts 2018 to 2030 (USD million)
- 4.4.2. Blood Tests
- 4.4.2.1. Market estimates and forecasts 2018 to 2030 (USD Million)
- 4.4.3. Urine Tests
- 4.4.3.1. Market estimates and forecasts 2018 to 2030 (USD Million)
- 4.4.4. Dilution & Concentration Tests
- 4.4.4.1. Market estimates and forecasts 2018 to 2030 (USD Million)
- 4.4.5. Other Tests
- 4.4.5.1. Market estimates and forecasts 2018 to 2030 (USD Million)
- 4.4.1. Clearance Tests
Chapter 5. Kidney Function Tests Market: End Use Estimates & Trend Analysis
- 5.1. End Use Market Share, 2024 & 2030
- 5.2. Segment Dashboard
- 5.3. Global Kidney Function Tests Market by End Use Outlook
- 5.4. Market Size & Forecasts and Trend Analyses, 2018 to 2030 for the following
- 5.4.1. Hospitals
- 5.4.1.1. Market estimates and forecasts 2018 to 2030 (USD million)
- 5.4.2. Diagnostic Laboratories
- 5.4.2.1. Market estimates and forecasts 2018 to 2030 (USD Million)
- 5.4.3. Research Laboratories And Institutes
- 5.4.3.1. Market estimates and forecasts 2018 to 2030 (USD Million)
- 5.4.4. Others
- 5.4.4.1. Market estimates and forecasts 2018 to 2030 (USD Million)
- 5.4.1. Hospitals
Chapter 6. Kidney Function Tests Market: Regional Estimates & Trend Analysis
- 6.1. Regional Market Share Analysis, 2024 & 2030
- 6.2. Regional Market Dashboard
- 6.3. Global Regional Market Snapshot
- 6.4. Market Size & Forecasts Trend Analysis, 2018 to 2030:
- 6.5. North America
- 6.5.1. U.S.
- 6.5.1.1. Key country dynamics
- 6.5.1.2. Regulatory framework/ reimbursement structure
- 6.5.1.3. Competitive scenario
- 6.5.1.4. U.S. market estimates and forecasts 2018 to 2030 (USD Million)
- 6.5.2. Canada
- 6.5.2.1. Key country dynamics
- 6.5.2.2. Regulatory framework/ reimbursement structure
- 6.5.2.3. Competitive scenario
- 6.5.2.4. Canada market estimates and forecasts 2018 to 2030 (USD Million)
- 6.5.3. Mexico
- 6.5.3.1. Key country dynamics
- 6.5.3.2. Regulatory framework/ reimbursement structure
- 6.5.3.3. Competitive scenario
- 6.5.3.4. Mexico market estimates and forecasts 2018 to 2030 (USD Million
- 6.5.1. U.S.
- 6.6. Europe
- 6.6.1. UK
- 6.6.1.1. Key country dynamics
- 6.6.1.2. Regulatory framework/ reimbursement structure
- 6.6.1.3. Competitive scenario
- 6.6.1.4. UK market estimates and forecasts 2018 to 2030 (USD Million)
- 6.6.2. Germany
- 6.6.2.1. Key country dynamics
- 6.6.2.2. Regulatory framework/ reimbursement structure
- 6.6.2.3. Competitive scenario
- 6.6.2.4. Germany market estimates and forecasts 2018 to 2030 (USD Million)
- 6.6.3. France
- 6.6.3.1. Key country dynamics
- 6.6.3.2. Regulatory framework/ reimbursement structure
- 6.6.3.3. Competitive scenario
- 6.6.3.4. France market estimates and forecasts 2018 to 2030 (USD Million)
- 6.6.4. Italy
- 6.6.4.1. Key country dynamics
- 6.6.4.2. Regulatory framework/ reimbursement structure
- 6.6.4.3. Competitive scenario
- 6.6.4.4. Italy market estimates and forecasts 2018 to 2030 (USD Million)
- 6.6.5. Spain
- 6.6.5.1. Key country dynamics
- 6.6.5.2. Regulatory framework/ reimbursement structure
- 6.6.5.3. Competitive scenario
- 6.6.5.4. Spain market estimates and forecasts 2018 to 2030 (USD Million)
- 6.6.6. Norway
- 6.6.6.1. Key country dynamics
- 6.6.6.2. Regulatory framework/ reimbursement structure
- 6.6.6.3. Competitive scenario
- 6.6.6.4. Norway market estimates and forecasts 2018 to 2030 (USD Million)
- 6.6.7. Sweden
- 6.6.7.1. Key country dynamics
- 6.6.7.2. Regulatory framework/ reimbursement structure
- 6.6.7.3. Competitive scenario
- 6.6.7.4. Sweden market estimates and forecasts 2018 to 2030 (USD Million)
- 6.6.8. Denmark
- 6.6.8.1. Key country dynamics
- 6.6.8.2. Regulatory framework/ reimbursement structure
- 6.6.8.3. Competitive scenario
- 6.6.8.4. Denmark market estimates and forecasts 2018 to 2030 (USD Million)
- 6.6.1. UK
- 6.7. Asia Pacific
- 6.7.1. Japan
- 6.7.1.1. Key country dynamics
- 6.7.1.2. Regulatory framework/ reimbursement structure
- 6.7.1.3. Competitive scenario
- 6.7.1.4. Japan market estimates and forecasts 2018 to 2030 (USD Million)
- 6.7.2. China
- 6.7.2.1. Key country dynamics
- 6.7.2.2. Regulatory framework/ reimbursement structure
- 6.7.2.3. Competitive scenario
- 6.7.2.4. China market estimates and forecasts 2018 to 2030 (USD Million)
- 6.7.3. India
- 6.7.3.1. Key country dynamics
- 6.7.3.2. Regulatory framework/ reimbursement structure
- 6.7.3.3. Competitive scenario
- 6.7.3.4. India market estimates and forecasts 2018 to 2030 (USD Million)
- 6.7.4. Australia
- 6.7.4.1. Key country dynamics
- 6.7.4.2. Regulatory framework/ reimbursement structure
- 6.7.4.3. Competitive scenario
- 6.7.4.4. Australia market estimates and forecasts 2018 to 2030 (USD Million)
- 6.7.5. South Korea
- 6.7.5.1. Key country dynamics
- 6.7.5.2. Regulatory framework/ reimbursement structure
- 6.7.5.3. Competitive scenario
- 6.7.5.4. South Korea market estimates and forecasts 2018 to 2030 (USD Million)
- 6.7.6. Thailand
- 6.7.6.1. Key country dynamics
- 6.7.6.2. Regulatory framework/ reimbursement structure
- 6.7.6.3. Competitive scenario
- 6.7.6.4. Thailand market estimates and forecasts 2018 to 2030 (USD Million)
- 6.7.1. Japan
- 6.8. Latin America
- 6.8.1. Brazil
- 6.8.1.1. Key country dynamics
- 6.8.1.2. Regulatory framework/ reimbursement structure
- 6.8.1.3. Competitive scenario
- 6.8.1.4. Brazil market estimates and forecasts 2018 to 2030 (USD Million)
- 6.8.2. Argentina
- 6.8.2.1. Key country dynamics
- 6.8.2.2. Regulatory framework/ reimbursement structure
- 6.8.2.3. Competitive scenario
- 6.8.2.4. Argentina market estimates and forecasts 2018 to 2030 (USD Million)
- 6.8.1. Brazil
- 6.9. MEA
- 6.9.1. South Africa
- 6.9.1.1. Key country dynamics
- 6.9.1.2. Regulatory framework/ reimbursement structure
- 6.9.1.3. Competitive scenario
- 6.9.1.4. South Africa market estimates and forecasts 2018 to 2030 (USD Million)
- 6.9.2. Saudi Arabia
- 6.9.2.1. Key country dynamics
- 6.9.2.2. Regulatory framework/ reimbursement structure
- 6.9.2.3. Competitive scenario
- 6.9.2.4. Saudi Arabia market estimates and forecasts 2018 to 2030 (USD Million)
- 6.9.3. UAE
- 6.9.3.1. Key country dynamics
- 6.9.3.2. Regulatory framework/ reimbursement structure
- 6.9.3.3. Competitive scenario
- 6.9.3.4. UAE market estimates and forecasts 2018 to 2030 (USD Million)
- 6.9.4. Kuwait
- 6.9.4.1. Key country dynamics
- 6.9.4.2. Regulatory framework/ reimbursement structure
- 6.9.4.3. Competitive scenario
- 6.9.4.4. Kuwait market estimates and forecasts 2018 to 2030 (USD Million)
- 6.9.1. South Africa
Chapter 7. Competitive Landscape
- 7.1. Recent Developments & Impact Analysis, By Key Market Participants
- 7.2. Company/Competition Categorization
- 7.3. Vendor Landscape
- 7.3.1. Key company market share analysis, 2024
- 7.3.2. Danaher
- 7.3.2.1. Company overview
- 7.3.2.2. Financial performance
- 7.3.2.3. Product benchmarking
- 7.3.2.4. Strategic initiatives
- 7.3.3. Danaher
- 7.3.3.1. Company overview
- 7.3.3.2. Financial performance
- 7.3.3.3. Product benchmarking
- 7.3.3.4. Strategic initiatives
- 7.3.4. F. Hoffmann-La Roche Ltd
- 7.3.4.1. Company overview
- 7.3.4.2. Financial performance
- 7.3.4.3. Product benchmarking
- 7.3.4.4. Strategic initiatives
- 7.3.5. Sysmex Corporation
- 7.3.5.1. Company overview
- 7.3.5.2. Financial performance
- 7.3.5.3. Product benchmarking
- 7.3.5.4. Strategic initiatives
- 7.3.6. Siemens Healthineers
- 7.3.6.1. Company overview
- 7.3.6.2. Financial performance
- 7.3.6.3. Product benchmarking
- 7.3.6.4. Strategic initiatives
- 7.3.7. Randox Laboratories Ltd
- 7.3.7.1. Company overview
- 7.3.7.2. Financial performance
- 7.3.7.3. Product benchmarking
- 7.3.7.4. Strategic initiatives
- 7.3.8. Quest Diagnostics
- 7.3.8.1. Company overview
- 7.3.8.2. Financial performance
- 7.3.8.3. Product benchmarking
- 7.3.8.4. Strategic initiatives
- 7.3.9. Acon Laboratories, Inc
- 7.3.9.1. Company overview
- 7.3.9.2. Financial performance
- 7.3.9.3. Product benchmarking
- 7.3.9.4. Strategic initiatives
- 7.3.10. Nova Biomedical Corporation
- 7.3.10.1. Company overview
- 7.3.10.2. Financial performance
- 7.3.10.3. Product benchmarking
- 7.3.10.4. Strategic initiatives
- 7.3.11. Laboratory Corporation Of America Holdings
- 7.3.11.1. Company overview
- 7.3.11.2. Financial performance
- 7.3.11.3. Product benchmarking
- 7.3.11.4. Strategic initiatives

