|
|
市場調査レポート
商品コード
1631472
歯科用セメントの世界市場規模、シェア、動向分析レポート:材料別、タイプ別、用途別、地域別、セグメント別予測(2025年~2030年)Dental Cement Market Size, Share & Trends Analysis Report By Material, By Type, By Application, By Region, And Segment Forecasts, 2025 - 2030 |
||||||

|
|||||||
カスタマイズ可能
|
|||||||

| 歯科用セメントの世界市場規模、シェア、動向分析レポート:材料別、タイプ別、用途別、地域別、セグメント別予測(2025年~2030年) |
|
出版日: 2024年12月17日
発行: Grand View Research
ページ情報: 英文 105 Pages
納期: 2~10営業日
|

全表示
- 概要
- 図表
- 目次
歯科用セメント市場の成長と動向:
Grand View Research, Inc.の最新レポートによると、世界の歯科用セメントの市場規模は2030年までに30億米ドルに達すると推定され、2025年~2030年CAGR6.6%で成長する見込みです。
虫歯と他の歯科疾患の発生率の増加と新しい製剤の導入は、市場の主な促進要因です。
不健康な飲食習慣、歯垢形成、口腔衛生状態の悪化、フッ化物欠乏、胸焼けやドライマウスなどの疾患は、主な素因の一部です。これらの要因により、歯科処置の数が増加しています。例えば、PubMedに掲載された論文によると、甘い飲み物をたまに1本でも摂取する人は、全く摂取しない人に比べて、むし歯や歯の喪失のリスクが44%近く増加するといいます。
さらに、これらのセメントや材料技術の進歩により、より耐久性が高く強度の高いセメントが登場し、成長を後押ししています。例えば、レジンモディファイドアイオノマーセメントは、従来のグラスアイオノマーと比較して、接着性の向上、高い引張強度、セメント埋入後の知覚過敏の軽減を実証しました。
歯科用セメント市場レポートのハイライト
- 2024年の市場シェアは、樹脂ベースが19.7%と最も高いです。また、優れた接着性、審美性、機械的強度の向上などの優れた特性により、市場内で最も急成長している分野でもあります。
- 樹脂ベースセグメントの市場での優位性は、接着、合着、治療用途など、さまざまな歯科処置への適応性にも起因しています。
- パーマネントセグメントは、2024年に52.5%と最大の売上シェアを占めました。また、歯科修復、特にクラウン、ブリッジ、その他の長期的な歯科修復を伴う処置において重要な役割を果たすため、2024年に最も急成長するセグメントです。
- ルーティングセグメントは、クラウン、ブリッジ、インレーなどの歯科修復物を歯の構造に固定する上で重要な役割を果たすことから、2024年に市場で最大の収益シェアである38.7%を占めています。
- 市場の修復セグメントは、歯科疾患の有病率の増加、高齢者人口の増加、歯科技術の進歩など、いくつかの主要促進要因によって、CAGRが最も急速に成長しています。
- 北米の歯科用セメント市場は2024年に39.0%の市場シェアを占め、市場を独占しました。
目次
第1章 調査手法と範囲
第2章 エグゼクティブサマリー
第3章 歯科用セメント市場の変数、動向、範囲
- 市場系統の見通し
- 親市場の見通し
- 関連/補助市場の見通し
- 市場力学
- 市場促進要因分析
- 市場抑制要因分析
- 歯科用セメント市場分析ツール
- 業界分析:ポーターのファイブフォース分析
- PESTEL分析
第4章 歯科用セメント市場:材料の推定・動向分析
- 世界の歯科用セメント市場:材料ダッシュボード
- 世界の歯科用セメント市場:材料変動分析
- 世界の歯科用セメント市場:材料別、収益別
- 酸化亜鉛オイゲノール
- ポリカルボキシレート
- リン酸亜鉛
- グラスアイオノマー
- 樹脂ベース
- その他
第5章 歯科用セメント市場:タイプの推定・動向分析
- 世界の歯科用セメント市場:タイプダッシュボード
- 世界の歯科用セメント市場:タイプ変動分析
- 世界の歯科用セメント市場:タイプ別、収益別
- パーマネント
- テンポラリー
第6章 歯科用セメント市場:用途の推定・動向分析
- 世界の歯科用セメント市場:用途ダッシュボード
- 世界の歯科用セメント市場:用途変動分析
- 世界の歯科用セメント市場:用途別、収益別
- 歯髄保護
- ルーティング
- 修復
- 外科用包帯
第7章 歯科用セメント市場:地域別推定・動向分析、材料別、用途別、タイプ別
- 地域ダッシュボード
- 市場規模、予測動向分析、2018年~2030年:
- 北米
- 米国
- カナダ
- メキシコ
- 欧州
- 英国
- ドイツ
- フランス
- イタリア
- スペイン
- ノルウェー
- スウェーデン
- デンマーク
- アジア太平洋
- 日本
- 中国
- インド
- オーストラリア
- 韓国
- タイ
- ラテンアメリカ
- ブラジル
- アルゼンチン
- 中東・アフリカ
- 南アフリカ
- サウジアラビア
- アラブ首長国連邦
- クウェート
第8章 競合情勢
- 企業/競合の分類
- ベンダー情勢
- 主要企業の市場シェア分析 :2024年
- 3M
- Danaher Corporation
- Dentsply Sirona
- Ivoclar Vivadent
- SHOFU Dental GmbH
- BISCO, Inc.
- SDI Limited
- DMG America LLC
- FGM Dental Group
- MEDENTAL INTERNATIONAL
List of Tables
- Table 1 List of abbreviation
- Table 2 North America dental cement market, by region, 2018 - 2030 (USD Million)
- Table 3 North America dental cement market, by material, 2018 - 2030 (USD Million)
- Table 4 North America dental cement market, by type, 2018 - 2030 (USD Million)
- Table 5 North America dental cement market, by application, 2018 - 2030 (USD Million)
- Table 6 U.S. dental cement market, by material, 2018 - 2030 (USD Million)
- Table 7 U.S. dental cement market, by type, 2018 - 2030 (USD Million)
- Table 8 U.S. dental cement market, by application, 2018 - 2030 (USD Million)
- Table 9 Canada dental cement market, by material, 2018 - 2030 (USD Million)
- Table 10 Canada dental cement market, by type, 2018 - 2030 (USD Million)
- Table 11 Canada dental cement market, by application, 2018 - 2030 (USD Million)
- Table 12 Mexico dental cement market, by material, 2018 - 2030 (USD Million)
- Table 13 Mexico dental cement market, by type, 2018 - 2030 (USD Million)
- Table 14 Mexico dental cement market, by application, 2018 - 2030 (USD Million)
- Table 15 Europe dental cement market, by region, 2018 - 2030 (USD Million)
- Table 16 Europe dental cement market, by material, 2018 - 2030 (USD Million)
- Table 17 Europe dental cement market, by type, 2018 - 2030 (USD Million)
- Table 18 Europe dental cement market, by application, 2018 - 2030 (USD Million)
- Table 19 Germany dental cement market, by material, 2018 - 2030 (USD Million)
- Table 20 Germany dental cement market, by type, 2018 - 2030 (USD Million)
- Table 21 Germany dental cement market, by application, 2018 - 2030 (USD Million)
- Table 22 UK dental cement market, by material, 2018 - 2030 (USD Million)
- Table 23 UK dental cement market, by type, 2018 - 2030 (USD Million)
- Table 24 UK dental cement market, by application, 2018 - 2030 (USD Million)
- Table 25 France dental cement market, by material, 2018 - 2030 (USD Million)
- Table 26 France dental cement market, by type, 2018 - 2030 (USD Million)
- Table 27 France dental cement market, by application, 2018 - 2030 (USD Million)
- Table 28 Italy dental cement market, by material, 2018 - 2030 (USD Million)
- Table 29 Italy dental cement market, by type, 2018 - 2030 (USD Million)
- Table 30 Italy dental cement market, by application, 2018 - 2030 (USD Million)
- Table 31 Spain dental cement market, by material, 2018 - 2030 (USD Million)
- Table 32 Spain dental cement market, by type, 2018 - 2030 (USD Million)
- Table 33 Spain dental cement market, by application, 2018 - 2030 (USD Million)
- Table 34 Denmark dental cement market, by material, 2018 - 2030 (USD Million)
- Table 35 Denmark dental cement market, by type, 2018 - 2030 (USD Million)
- Table 36 Denmark dental cement market, by application, 2018 - 2030 (USD Million)
- Table 37 Sweden dental cement market, by material, 2018 - 2030 (USD Million)
- Table 38 Sweden dental cement market, by type, 2018 - 2030 (USD Million)
- Table 39 Sweden dental cement market, by application, 2018 - 2030 (USD Million)
- Table 40 Norway dental cement market, by material, 2018 - 2030 (USD Million)
- Table 41 Norway dental cement market, by type, 2018 - 2030 (USD Million)
- Table 42 Norway dental cement market, by application, 2018 - 2030 (USD Million)
- Table 43 Asia Pacific dental cement market, by region, 2018 - 2030 (USD Million)
- Table 44 Asia Pacific dental cement market, by material, 2018 - 2030 (USD Million)
- Table 45 Asia Pacific dental cement market, by type, 2018 - 2030 (USD Million)
- Table 46 Asia Pacific dental cement market, by application, 2018 - 2030 (USD Million)
- Table 47 China dental cement market, by material, 2018 - 2030 (USD Million)
- Table 48 China dental cement market, by type, 2018 - 2030 (USD Million)
- Table 49 China dental cement market, by application, 2018 - 2030 (USD Million)
- Table 50 Japan dental cement market, by material, 2018 - 2030 (USD Million)
- Table 51 Japan dental cement market, by type, 2018 - 2030 (USD Million)
- Table 52 Japan dental cement market, by application, 2018 - 2030 (USD Million)
- Table 53 India dental cement market, by material, 2018 - 2030 (USD Million)
- Table 54 India dental cement market, by type, 2018 - 2030 (USD Million)
- Table 55 India dental cement market, by application, 2018 - 2030 (USD Million)
- Table 56 South Korea dental cement market, by material, 2018 - 2030 (USD Million)
- Table 57 South Korea dental cement market, by type, 2018 - 2030 (USD Million)
- Table 58 South Korea dental cement market, by application, 2018 - 2030 (USD Million)
- Table 59 Australia dental cement market, by material, 2018 - 2030 (USD Million)
- Table 60 Australia dental cement market, by type, 2018 - 2030 (USD Million)
- Table 61 Australia dental cement market, by application, 2018 - 2030 (USD Million)
- Table 62 Thailand dental cement market, by material, 2018 - 2030 (USD Million)
- Table 63 Thailand dental cement market, by type, 2018 - 2030 (USD Million)
- Table 64 Thailand dental cement market, by application, 2018 - 2030 (USD Million)
- Table 65 Latin America dental cement market, by region, 2018 - 2030 (USD Million)
- Table 66 Latin America dental cement market, by material, 2018 - 2030 (USD Million)
- Table 67 Latin America dental cement market, by type, 2018 - 2030 (USD Million)
- Table 68 Latin America dental cement market, by application, 2018 - 2030 (USD Million)
- Table 69 Brazil dental cement market, by material, 2018 - 2030 (USD Million)
- Table 70 Brazil dental cement market, by type, 2018 - 2030 (USD Million)
- Table 71 Brazil dental cement market, by application, 2018 - 2030 (USD Million)
- Table 72 Argentina dental cement market, by material, 2018 - 2030 (USD Million)
- Table 73 Argentina dental cement market, by type, 2018 - 2030 (USD Million)
- Table 74 Argentina dental cement market, by application, 2018 - 2030 (USD Million)
- Table 75 MEA dental cement market, by region, 2018 - 2030 (USD Million)
- Table 76 MEA dental cement market, by material, 2018 - 2030 (USD Million)
- Table 77 MEA dental cement market, by type, 2018 - 2030 (USD Million)
- Table 78 MEA dental cement market, by application, 2018 - 2030 (USD Million)
- Table 79 South Africa dental cement market, by material, 2018 - 2030 (USD Million)
- Table 80 South Africa dental cement market, by type, 2018 - 2030 (USD Million)
- Table 81 South Africa dental cement market, by application, 2018 - 2030 (USD Million)
- Table 82 Saudi Arabia dental cement market, by material, 2018 - 2030 (USD Million)
- Table 83 Saudi Arabia dental cement market, by type, 2018 - 2030 (USD Million)
- Table 84 Saudi Arabia dental cement market, by application, 2018 - 2030 (USD Million)
- Table 85 UAE dental cement market, by material, 2018 - 2030 (USD Million)
- Table 86 UAE dental cement market, by type, 2018 - 2030 (USD Million)
- Table 87 UAE dental cement market, by application, 2018 - 2030 (USD Million)
- Table 88 Kuwait dental cement market, by material, 2018 - 2030 (USD Million)
- Table 89 Kuwait dental cement market, by type, 2018 - 2030 (USD Million)
- Table 90 Kuwait dental cement market, by application, 2018 - 2030 (USD Million)
List of Figures
- Fig. 1 Market research process
- Fig. 2 Data triangulation techniques
- Fig. 3 Market research approaches
- Fig. 4 QFD modeling for market share assessment
- Fig. 5 Market formulation & validation
- Fig. 6 Dental cement market: market outlook
- Fig. 7 Dental cement competitive insights
- Fig. 8 Parent market outlook
- Fig. 9 Related/ancillary market outlook
- Fig. 10 Dental cement market driver impact
- Fig. 11 Dental cement market restraint impact
- Fig. 12 Dental cement market: Material movement analysis
- Fig. 13 Dental cement market: Material outlook and key takeaways
- Fig. 14 Zinc-oxide eugenol market estimates and forecast, 2018 - 2030 (USD Million)
- Fig. 15 Polycarboxylate market estimates and forecast, 2018 - 2030 (USD Million)
- Fig. 16 Zinc phosphate market estimates and forecast, 2018 - 2030 (USD Million)
- Fig. 17 Glass ionomer market estimates and forecast, 2018 - 2030 (USD Million)
- Fig. 18 Resin based market estimates and forecast, 2018 - 2030 (USD Million)
- Fig. 19 Others market estimates and forecast, 2018 - 2030 (USD Million)
- Fig. 20 Dental cement market: Type movement analysis
- Fig. 21 Dental cement market: Type outlook and key takeaways
- Fig. 22 Permanent market estimates and forecast, 2018 - 2030 (USD Million)
- Fig. 23 Temporary market estimates and forecast, 2018 - 2030 (USD Million)
- Fig. 24 Dental cement market: Application movement analysis
- Fig. 25 Dental cement market: Application outlook and key takeaways
- Fig. 26 Pulpal protection market estimates and forecast, 2018 - 2030 (USD Million)
- Fig. 27 Luting market estimates and forecast, 2018 - 2030 (USD Million)
- Fig. 28 Restorations market estimates and forecast, 2018 - 2030 (USD Million)
- Fig. 29 Surgical dressing market estimates and forecast, 2018 - 2030 (USD Million)
- Fig. 30 Global dental cement market: Regional movement analysis
- Fig. 31 Global dental cement market: Regional outlook and key takeaways
- Fig. 32 Global dental cement market share and leading players
- Fig. 33 North America, by country
- Fig. 34 North America market estimates and forecasts, 2018 - 2030 (USD Million)
- Fig. 35 U.S. key country dynamics
- Fig. 36 U.S. market estimates and forecasts, 2018 - 2030 (USD Million)
- Fig. 37 Canada key country dynamics
- Fig. 38 Canada market estimates and forecasts, 2018 - 2030 (USD Million)
- Fig. 39 Mexico key country dynamics
- Fig. 40 Mexico market estimates and forecasts, 2018 - 2030 (USD Million)
- Fig. 41 Europe market estimates and forecasts, 2018 - 2030 (USD Million)
- Fig. 42 UK key country dynamics
- Fig. 43 UK market estimates and forecasts, 2018 - 2030 (USD Million)
- Fig. 44 Germany key country dynamics
- Fig. 45 Germany market estimates and forecasts, 2018 - 2030 (USD Million)
- Fig. 46 France key country dynamics
- Fig. 47 France market estimates and forecasts, 2018 - 2030 (USD Million)
- Fig. 48 Italy key country dynamics
- Fig. 49 Italy market estimates and forecasts, 2018 - 2030 (USD Million)
- Fig. 50 Spain key country dynamics
- Fig. 51 Spain market estimates and forecasts, 2018 - 2030 (USD Million)
- Fig. 52 Denmark key country dynamics
- Fig. 53 Denmark market estimates and forecasts, 2018 - 2030 (USD Million)
- Fig. 54 Sweden key country dynamics
- Fig. 55 Sweden market estimates and forecasts, 2018 - 2030 (USD Million)
- Fig. 56 Norway key country dynamics
- Fig. 57 Norway market estimates and forecasts, 2018 - 2030 (USD Million)
- Fig. 58 Asia Pacific market estimates and forecasts, 2018 - 2030 (USD Million)
- Fig. 59 China key country dynamics
- Fig. 60 China market estimates and forecasts, 2018 - 2030 (USD Million)
- Fig. 61 Japan key country dynamics
- Fig. 62 Japan market estimates and forecasts, 2018 - 2030 (USD Million)
- Fig. 63 India key country dynamics
- Fig. 64 India market estimates and forecasts, 2018 - 2030 (USD Million)
- Fig. 65 Thailand key country dynamics
- Fig. 66 Thailand market estimates and forecasts, 2018 - 2030 (USD Million)
- Fig. 67 South Korea key country dynamics
- Fig. 68 South Korea market estimates and forecasts, 2018 - 2030 (USD Million)
- Fig. 69 Australia key country dynamics
- Fig. 70 Australia market estimates and forecasts, 2018 - 2030 (USD Million)
- Fig. 71 Latin America market estimates and forecasts, 2018 - 2030 (USD Million)
- Fig. 72 Brazil key country dynamics
- Fig. 73 Brazil market estimates and forecasts, 2018 - 2030 (USD Million)
- Fig. 74 Argentina key country dynamics
- Fig. 75 Argentina market estimates and forecasts, 2018 - 2030 (USD Million)
- Fig. 76 Middle East and Africa market estimates and forecasts, 2018 - 2030 (USD Million)
- Fig. 77 South Africa key country dynamics
- Fig. 78 South Africa market estimates and forecasts, 2018 - 2030 (USD Million)
- Fig. 79 Saudi Arabia key country dynamics
- Fig. 80 Saudi Arabia market estimates and forecasts, 2018 - 2030 (USD Million)
- Fig. 81 UAE key country dynamics
- Fig. 82 UAE market estimates and forecasts, 2018 - 2030 (USD Million)
- Fig. 83 Kuwait key country dynamics
- Fig. 84 Kuwait market estimates and forecasts, 2018 - 2030 (USD Million)
- Fig. 85 Market share of key market players- Dental cement market
Dental Cement Market Growth & Trends:
The global dental cement market size is estimated to reach USD 3.0 billion by 2030, registering to grow at a CAGR of 6.6% from 2025 to 2030 according to a new report by Grand View Research, Inc. Increasing incidence of dental cavities & other dental diseases and introduction of new formulations are major drivers of the market.
Unhealthy eating & drinking habits, plaque formation, poor oral hygiene, fluoride deficiency, and disorders such as heartburn & dry mouth are some of the major predisposing factors. These factors have resulted in an increase in the number of dental procedures. For instance, according to an article published by PubMed, individuals who consume one sugary drink occasionally are at an increased risk of dental caries and tooth loss by nearly 44% as compared to ones who do not consume any.
Moreover, advancements in these cements and material technology have led to introduction of more durable and stronger cements, fueling growth. For instance, resin-modified ionomer cement demonstrated improved adhesion, higher tensile strength, and reduced post-cementation sensitivity when compared to conventional glass ionomer.
Dental Cement Market Report Highlights:
- The resin-based segment holds the highest market share of 19.7% in 2024. It is also the fastest growing segment within the market due to its superior properties, including excellent adhesion, aesthetic appeal, and enhanced mechanical strength.
- The resin-based segment's dominance in the market can also be attributed to its adaptability across various dental procedures, including bonding, luting, and therapeutic applications.
- The permanent segment of the market accounted for the largest revenue share of 52.5% in 2024. It is also the fastest growing segment in 2024 due to its critical role in restoraive dentistry, particularly for procedures involving crowns, bridges, and other long-term dental restorations.
- The luting segment holds the largest revenue share of 38.7% in 2024 in the market, primarily due to its critical role in securing dental restorations such as crowns, bridges, and inlays to tooth structures.
- The restoration segment of the market is experiencing the fastest-growing CAGR due to several key drivers, including an increasing prevalence of dental diseases, a rising senior population, and advancements in dental technology.
- The dental cement market in North America dominated the market with a 39.0% market share in 2024, driven by an increasing demand for aesthetic dental solutions.
Table of Contents
Chapter 1. Methodology and Scope
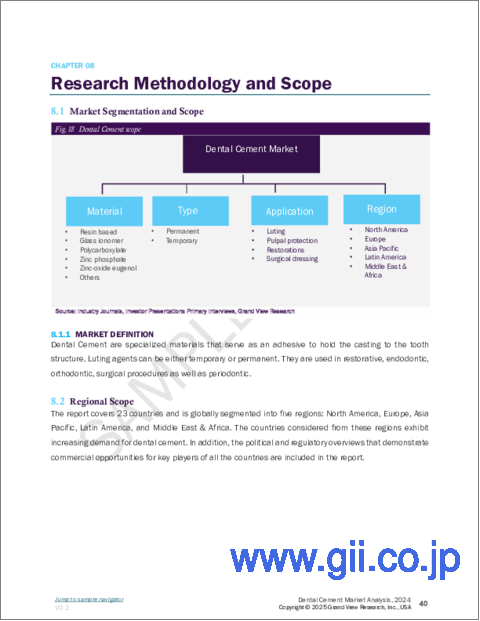
- 1.1. Market Segmentation & Scope
- 1.2. Segment Definitions
- 1.2.1. Material
- 1.2.2. Type
- 1.2.3. Application
- 1.2.4. Regional scope
- 1.2.5. Estimates and forecasts timeline
- 1.3. Research Methodology
- 1.4. Information Procurement
- 1.4.1. Purchased database
- 1.4.2. GVR's internal database
- 1.4.3. Secondary sources
- 1.4.4. Primary research
- 1.4.5. Details of primary research
- 1.4.5.1. Data for primary interviews in North America
- 1.4.5.2. Data for primary interviews in Europe
- 1.4.5.3. Data for primary interviews in Asia Pacific
- 1.4.5.4. Data for primary interviews in Latin America
- 1.4.5.5. Data for Primary interviews in MEA
- 1.5. Information or Data Analysis
- 1.5.1. Data analysis models
- 1.6. Market Formulation & Validation
- 1.7. Model Details
- 1.7.1. Commodity flow analysis (Model 1)
- 1.7.2. Approach 1: Commodity flow approach
- 1.8. List of Secondary Sources
- 1.9. List of Primary Sources
- 1.10. Objectives
Chapter 2. Executive Summary
- 2.1. Market Outlook
- 2.2. Segment Outlook
- 2.2.1. Material outlook
- 2.2.2. Type outlook
- 2.2.3. Application outlook
- 2.2.4. Regional outlook
- 2.3. Competitive Insights
Chapter 3. Dental Cement Market Variables, Trends & Scope
- 3.1. Market Lineage Outlook
- 3.1.1. Parent market outlook
- 3.1.2. Related/ancillary market outlook
- 3.2. Market Dynamics
- 3.2.1. Market driver analysis
- 3.2.1.1. Rising dental procedures
- 3.2.1.2. Technological advancements
- 3.2.1.3. Growing aesthetic dentistry
- 3.2.2. Market restraint analysis
- 3.2.2.1. High cost
- 3.2.2.2. Alternatives availability
- 3.2.1. Market driver analysis
- 3.3. Dental Cement Market Analysis Tools
- 3.3.1. Industry Analysis - Porter's
- 3.3.1.1. Supplier power
- 3.3.1.2. Buyer power
- 3.3.1.3. Substitution threat
- 3.3.1.4. Threat of new entrant
- 3.3.1.5. Competitive rivalry
- 3.3.2. PESTEL Analysis
- 3.3.2.1. Political landscape
- 3.3.2.2. Technological landscape
- 3.3.2.3. Economic landscape
- 3.3.1. Industry Analysis - Porter's
Chapter 4. Dental Cement Market: Material Estimates & Trend Analysis
- 4.1. Global Dental Cement Market: Material Dashboard
- 4.2. Global Dental Cement Market: Material Movement Analysis
- 4.3. Global Dental Cement Market by Material, Revenue
- 4.4. Zinc-oxide eugenol
- 4.4.1. Zinc-oxide eugenol market estimates and forecasts 2018 to 2030 (USD Million)
- 4.5. Polycarboxylate
- 4.5.1. Polycarboxylate market estimates and forecasts 2018 to 2030 (USD Million)
- 4.6. Zinc phosphate
- 4.6.1. Zinc phosphate market estimates and forecasts 2018 to 2030 (USD Million)
- 4.7. Glass ionomer
- 4.7.1. Glass ionomer market estimates and forecasts 2018 to 2030 (USD Million)
- 4.8. Resin based
- 4.8.1. Resin based market estimates and forecasts 2018 to 2030 (USD Million)
- 4.9. Others
- 4.9.1. Others market estimates and forecasts 2018 to 2030 (USD Million)
Chapter 5. Dental Cement Market: Type Estimates & Trend Analysis
- 5.1. Global Dental Cement Market: Type Dashboard
- 5.2. Global Dental Cement Market: Type Movement Analysis
- 5.3. Global Dental Cement Market Estimates and Forecasts, by Type, Revenue (USD Million)
- 5.4. Permanent
- 5.4.1. Permanent market estimates and forecasts 2018 to 2030 (USD Million)
- 5.5. Temporary
- 5.5.1. Temporary market estimates and forecasts 2018 to 2030 (USD Million)
Chapter 6. Dental Cement Market: Application Estimates & Trend Analysis
- 6.1. Global Dental Cement Market: Application Dashboard
- 6.2. Global Dental Cement Market: Application Movement Analysis
- 6.3. Global Dental Cement Market Estimates and Forecasts, By Application, Revenue (USD Million)
- 6.4. Pulpal protection
- 6.4.1. Pulpal protection market estimates and forecasts 2018 to 2030 (USD Million)
- 6.5. Luting
- 6.5.1. Luting market estimates and forecasts 2018 to 2030 (USD Million)
- 6.6. Restorations
- 6.6.1. Restorations market estimates and forecasts 2018 to 2030 (USD Million)
- 6.7. Surgical dressing
- 6.7.1. Surgical dressing market estimates and forecasts 2018 to 2030 (USD Million)
Chapter 7. Dental Cement Market: Regional Estimates & Trend Analysis by Material, Application and Type
- 7.1. Regional Dashboard
- 7.2. Market Size, & Forecasts Trend Analysis, 2018 to 2030:
- 7.3. North America
- 7.3.1. U.S.
- 7.3.1.1. Key country dynamics
- 7.3.1.2. Regulatory framework/ reimbursement structure
- 7.3.1.3. Competitive scenario
- 7.3.1.4. U.S. market estimates and forecasts 2018 to 2030 (USD Million)
- 7.3.2. Canada
- 7.3.2.1. Key country dynamics
- 7.3.2.2. Regulatory framework/ reimbursement structure
- 7.3.2.3. Competitive scenario
- 7.3.2.4. Canada market estimates and forecasts 2018 to 2030 (USD Million)
- 7.3.3. Mexico
- 7.3.3.1. Key country dynamics
- 7.3.3.2. Regulatory framework/ reimbursement structure
- 7.3.3.3. Competitive scenario
- 7.3.3.4. Mexico market estimates and forecasts 2018 to 2030 (USD Million)
- 7.3.1. U.S.
- 7.4. Europe
- 7.4.1. UK
- 7.4.1.1. Key country dynamics
- 7.4.1.2. Regulatory framework/ reimbursement structure
- 7.4.1.3. Competitive scenario
- 7.4.1.4. UK market estimates and forecasts 2018 to 2030 (USD Million)
- 7.4.2. Germany
- 7.4.2.1. Key country dynamics
- 7.4.2.2. Regulatory framework/ reimbursement structure
- 7.4.2.3. Competitive scenario
- 7.4.2.4. Germany market estimates and forecasts 2018 to 2030 (USD Million)
- 7.4.3. France
- 7.4.3.1. Key country dynamics
- 7.4.3.2. Regulatory framework/ reimbursement structure
- 7.4.3.3. Competitive scenario
- 7.4.3.4. France market estimates and forecasts 2018 to 2030 (USD Million)
- 7.4.4. Italy
- 7.4.4.1. Key country dynamics
- 7.4.4.2. Regulatory framework/ reimbursement structure
- 7.4.4.3. Competitive scenario
- 7.4.4.4. Italy market estimates and forecasts 2018 to 2030 (USD Million)
- 7.4.5. Spain
- 7.4.5.1. Key country dynamics
- 7.4.5.2. Regulatory framework/ reimbursement structure
- 7.4.5.3. Competitive scenario
- 7.4.5.4. Spain market estimates and forecasts 2018 to 2030 (USD Million)
- 7.4.6. Norway
- 7.4.6.1. Key country dynamics
- 7.4.6.2. Regulatory framework/ reimbursement structure
- 7.4.6.3. Competitive scenario
- 7.4.6.4. Norway market estimates and forecasts 2018 to 2030 (USD Million)
- 7.4.7. Sweden
- 7.4.7.1. Key country dynamics
- 7.4.7.2. Regulatory framework/ reimbursement structure
- 7.4.7.3. Competitive scenario
- 7.4.7.4. Sweden market estimates and forecasts 2018 to 2030 (USD Million)
- 7.4.8. Denmark
- 7.4.8.1. Key country dynamics
- 7.4.8.2. Regulatory framework/ reimbursement structure
- 7.4.8.3. Competitive scenario
- 7.4.8.4. Denmark market estimates and forecasts 2018 to 2030 (USD Million)
- 7.4.1. UK
- 7.5. Asia Pacific
- 7.5.1. Japan
- 7.5.1.1. Key country dynamics
- 7.5.1.2. Regulatory framework/ reimbursement structure
- 7.5.1.3. Competitive scenario
- 7.5.1.4. Japan market estimates and forecasts 2018 to 2030 (USD Million)
- 7.5.2. China
- 7.5.2.1. Key country dynamics
- 7.5.2.2. Regulatory framework/ reimbursement structure
- 7.5.2.3. Competitive scenario
- 7.5.2.4. China market estimates and forecasts 2018 to 2030 (USD Million)
- 7.5.3. India
- 7.5.3.1. Key country dynamics
- 7.5.3.2. Regulatory framework/ reimbursement structure
- 7.5.3.3. Competitive scenario
- 7.5.3.4. India market estimates and forecasts 2018 to 2030 (USD Million)
- 7.5.4. Australia
- 7.5.4.1. Key country dynamics
- 7.5.4.2. Regulatory framework/ reimbursement structure
- 7.5.4.3. Competitive scenario
- 7.5.4.4. Australia market estimates and forecasts 2018 to 2030 (USD Million)
- 7.5.5. South Korea
- 7.5.5.1. Key country dynamics
- 7.5.5.2. Regulatory framework/ reimbursement structure
- 7.5.5.3. Competitive scenario
- 7.5.5.4. South Korea market estimates and forecasts 2018 to 2030 (USD Million)
- 7.5.6. Thailand
- 7.5.6.1. Key country dynamics
- 7.5.6.2. Regulatory framework/ reimbursement structure
- 7.5.6.3. Competitive scenario
- 7.5.6.4. Thailand market estimates and forecasts 2018 to 2030 (USD Million)
- 7.5.1. Japan
- 7.6. Latin America
- 7.6.1. Brazil
- 7.6.1.1. Key country dynamics
- 7.6.1.2. Regulatory framework/ reimbursement structure
- 7.6.1.3. Competitive scenario
- 7.6.1.4. Brazil market estimates and forecasts 2018 to 2030 (USD Million)
- 7.6.2. Argentina
- 7.6.2.1. Key country dynamics
- 7.6.2.2. Regulatory framework/ reimbursement structure
- 7.6.2.3. Competitive scenario
- 7.6.2.4. Argentina market estimates and forecasts 2018 to 2030 (USD Million)
- 7.6.1. Brazil
- 7.7. MEA
- 7.7.1. South Africa
- 7.7.1.1. Key country dynamics
- 7.7.1.2. Regulatory framework/ reimbursement structure
- 7.7.1.3. Competitive scenario
- 7.7.1.4. South Africa market estimates and forecasts 2018 to 2030 (USD Million)
- 7.7.2. Saudi Arabia
- 7.7.2.1. Key country dynamics
- 7.7.2.2. Regulatory framework/ reimbursement structure
- 7.7.2.3. Competitive scenario
- 7.7.2.4. Saudi Arabia market estimates and forecasts 2018 to 2030 (USD Million)
- 7.7.3. UAE
- 7.7.3.1. Key country dynamics
- 7.7.3.2. Regulatory framework/ reimbursement structure
- 7.7.3.3. Competitive scenario
- 7.7.3.4. UAE market estimates and forecasts 2018 to 2030 (USD Million)
- 7.7.4. Kuwait
- 7.7.4.1. Key country dynamics
- 7.7.4.2. Regulatory framework/ reimbursement structure
- 7.7.4.3. Competitive scenario
- 7.7.4.4. Kuwait market estimates and forecasts 2018 to 2030 (USD Million)
- 7.7.1. South Africa
Chapter 8. Competitive Landscape
- 8.1. Company/Competition Categorization
- 8.2. Vendor Landscape
- 8.2.1. Key company market share analysis, 2024
- 8.2.2. 3M
- 8.2.2.1. Company overview
- 8.2.2.2. Financial performance
- 8.2.2.3. Product benchmarking
- 8.2.2.4. Strategic initiatives
- 8.2.3. Danaher Corporation
- 8.2.3.1. Company overview
- 8.2.3.2. Financial performance
- 8.2.3.3. Product benchmarking
- 8.2.3.4. Strategic initiatives
- 8.2.4. Dentsply Sirona
- 8.2.4.1. Company overview
- 8.2.4.2. Financial performance
- 8.2.4.3. Product benchmarking
- 8.2.4.4. Strategic initiatives
- 8.2.5. Ivoclar Vivadent
- 8.2.5.1. Company overview
- 8.2.5.2. Financial performance
- 8.2.5.3. Product benchmarking
- 8.2.5.4. Strategic initiatives
- 8.2.6. SHOFU Dental GmbH
- 8.2.6.1. Company overview
- 8.2.6.2. Financial performance
- 8.2.6.3. Product benchmarking
- 8.2.6.4. Strategic initiatives
- 8.2.7. BISCO, Inc.
- 8.2.7.1. Company overview
- 8.2.7.2. Financial performance
- 8.2.7.3. Product benchmarking
- 8.2.7.4. Strategic initiatives
- 8.2.8. SDI Limited
- 8.2.8.1. Company overview
- 8.2.8.2. Financial performance
- 8.2.8.3. Product benchmarking
- 8.2.8.4. Strategic initiatives
- 8.2.9. DMG America LLC
- 8.2.9.1. Company overview
- 8.2.9.2. Financial performance
- 8.2.9.3. Product benchmarking
- 8.2.9.4. Strategic initiatives
- 8.2.10. FGM Dental Group
- 8.2.10.1. Company overview
- 8.2.10.2. Financial performance
- 8.2.10.3. Product benchmarking
- 8.2.10.4. Strategic initiatives
- 8.2.11. MEDENTAL INTERNATIONAL
- 8.2.11.1. Company overview
- 8.2.11.2. Financial performance
- 8.2.11.3. Product benchmarking
- 8.2.11.4. Strategic initiatives
