|
|
市場調査レポート
商品コード
1630937
在宅ケア検査市場規模、シェア、動向分析レポート:年齢別、サンプル別、検査タイプ別、流通チャネル別、製品別、地域別、セグメント別予測、2025年~2030年Home Care Testing Market Size, Share & Trends Analysis Report By Age (Pediatric, Adult, Geriatric), By Sample, By Test Type (Infectious Disease Tests, Pregnancy Tests), By Distribution Channel, By Product, By Region, And Segment Forecasts, 2025 - 2030 |
||||||
|
|||||||
カスタマイズ可能
|
|||||||

| 在宅ケア検査市場規模、シェア、動向分析レポート:年齢別、サンプル別、検査タイプ別、流通チャネル別、製品別、地域別、セグメント別予測、2025年~2030年 |
|
出版日: 2024年12月02日
発行: Grand View Research
ページ情報: 英文 120 Pages
納期: 2~10営業日
|

全表示
- 概要
- 図表
- 目次
在宅ケア検査市場の成長と動向:
Grand View Research, Inc.の最新レポートによると、世界の在宅ケア検査市場規模は2030年までに179億5,000万米ドルに達すると推定され、2025年から2030年にかけてCAGR 9.36%で成長すると予測されています。
市場の成長は、便利で利用しやすいヘルスケアソリューションへの需要の増加、予防ヘルスケアとウェルネスへの関心の高まり、技術の進歩などの要因に起因しています。デジタル画像診断、分子診断、ラボオンチップシステムなどの診断技術が大きく進歩し、革新的で効果的な家庭用検査機器の開発が可能になった。2023年3月、ヘルスケア・テクノロジー企業であるキュー・ヘルスは、キュー・ケア・プラットフォームを拡大し、一連の在宅診断検査を発表しました。
これらの検査は、迅速かつ正確な結果を個人に提供し、健康とウェルネスを管理できるように設計されています。新しい検査には、COVID-19、インフルエンザ、呼吸器合胞体ウイルス(RSV)の検査など、さまざまなオプションが含まれています。さらに、在宅ケア検査はヘルスケアコストの削減にも貢献しています。患者自身が自宅で検査を行えるようにすることで、ヘルスケアプロバイダーは、ヘルスケア環境で検査を行うために必要な人件費やインフラのコストを削減することができます。これにより、特に頻繁な検査を必要とする慢性疾患を持つ患者にとって、ヘルスケアをより安価で身近なものにすることができます。さらに、在宅医療検査は、ヘルスケア施設へのアクセスが容易でない農村部や遠隔地の患者にとってのアクセシビリティを高めています。
パンデミックは、定期的なモニタリングと疾患の早期発見の重要性を浮き彫りにし、在宅ケア検査キットの需要を押し上げました。迅速で正確な検査ソリューションに対する需要の高まりに対応するため、各社は新しい技術やソリューションを開発してきました。その結果、迅速抗原検査、抗体検査、PCR検査など、さまざまな新しい在宅ケア検査製品が開発され、これらはすべてCOVID-19の診断やモニタリングに役立てられています。2023年3月、Lucira Healthは市販(OTC)インフルエンザおよびCOVID-19検査のFDA認可を取得しました。この検査では、ヘルスケア提供者を必要とせず、自宅でCOVID-19とインフルエンザを自分で検査することができます。
在宅ケア検査市場レポートハイライト
- 年齢別では、高齢者人口と慢性疾患の発生率の高さから、高齢者人口セグメントが2024年に最も高い市場シェアを獲得しました。
- サンプル別では、尿サンプル・セグメントが2024年の市場を独占しました。技術の進歩により、尿サンプル検査はより正確で信頼できるものとなり、健康状態の早期発見と治療が可能になった。
- 検査タイプ別では、感染症分野が2024年に市場を独占すると予測されています。このセグメントの成長は、世界の感染症患者の増加や製品承認数の多さなどの要因によるものです。
- 流通チャネル別では、小売薬局部門が2024年に市場を独占すると予想されます。小売薬局は消費者にとってアクセスしやすく、ショッピングセンターや食料品店などの便利な場所に多く立地しています。
- 製品別では、ストリップ・セグメントが2024年の市場を独占する見込みです。ストリップ検査は比較的安価で使いやすく、専門的な機器を必要とせずに家庭で実施できます。
- 北米が市場を独占し、2024年には33.71%の最大売上シェアを占めました。これは高齢者人口の存在と医療インフラの発達によるものです。
目次
第1章 調査手法と範囲
第2章 エグゼクティブサマリー
第3章 世界の在宅ケア検査市場の変数、動向、範囲
- 市場系統の見通し
- 親市場の見通し
- 関連/補助的な市場見通し。
- 市場力学
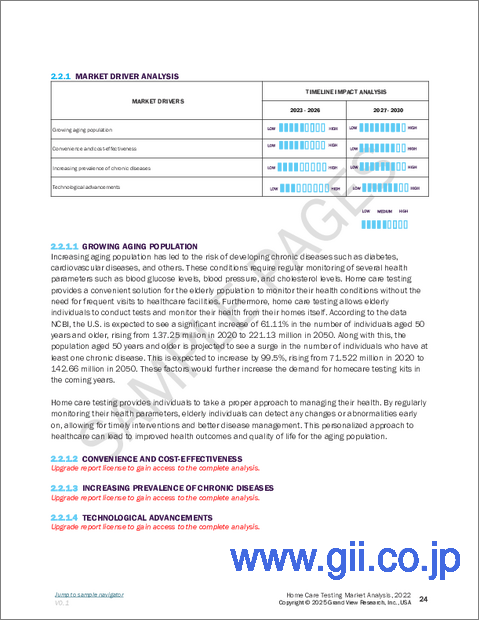
- 市場ドライバー分析
- 市場抑制要因分析
- 世界の住宅検査市場分析ツール
- 業界分析- ポーターのファイブフォース分析
- PESTEL分析
- COVID-19の影響分析
第4章 世界の在宅ケア検査市場:年齢の推定・動向分析
- セグメントダッシュボード
- 世界の在宅ケア検査市場の年齢の変動分析
- 世界の在宅ケア検査市場規模と動向分析、年齢別、2018~2030年
- 小児
- 成人
- 高齢者
第5章 世界の在宅ケア検査市場:サンプルの推定・動向分析
- セグメントダッシュボード
- 世界の在宅ケア検査市場のサンプルの変動分析
- 世界の在宅ケア検査市場規模と動向分析、サンプル別、2018~2030年
- 尿
- 唾液
- 血
- その他
第6章 世界の在宅ケア検査市場:検査タイプの推定・動向分析
- セグメントダッシュボード
- 世界の在宅ケア検査市場の検査タイプ変動分析
- 世界の在宅ケア検査市場規模と動向分析、検査タイプ別、2018~2030年
- HIV検査キット
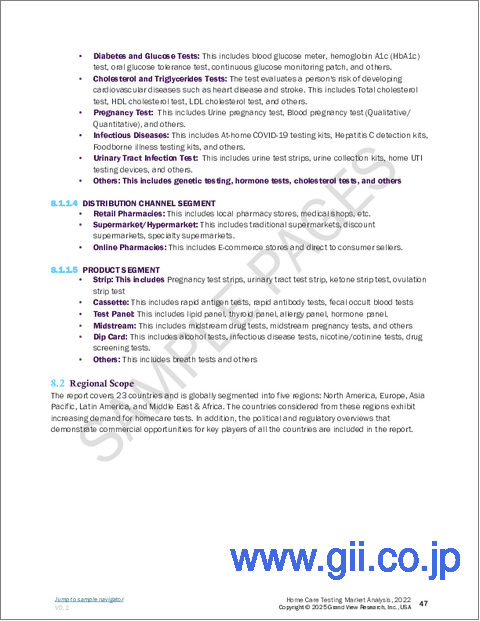
- 糖尿病と血糖検査
- コレステロールとトリグリセリド検査
- 妊娠検査
- 感染症検査
- 尿路感染症検査
- その他
第7章 世界の在宅ケア検査市場:流通チャネルの推定・動向分析
- セグメントダッシュボード
- 世界の在宅ケア検査市場の流通チャネルの変動分析
- 世界の在宅ケア検査市場規模と動向分析、流通チャネル別、2018~2030年
- 小売薬局
- スーパーマーケット/ハイパーマーケット
- オンライン薬局
第8章 世界の在宅ケア検査市場:製品の推定・動向分析
- セグメントダッシュボード
- 世界の在宅ケア検査市場の製品の変動分析
- 世界の在宅ケア検査市場規模と動向分析、製品別、2018~2030年
- ストリップ
- カセット
- パネル
- ミッドストリーム
- ディップカード
- その他
第9章 在宅ケア検査市場:地域推定・動向分析
- 地域ダッシュボード
- 市場規模と予測動向分析、2018年から2030年:
- 北米
- 米国
- カナダ
- メキシコ
- 欧州
- 英国
- ドイツ
- フランス
- イタリア
- スペイン
- ノルウェー
- スウェーデン
- デンマーク
- アジア太平洋
- 日本
- 中国
- インド
- オーストラリア
- 韓国
- タイ
- ラテンアメリカ
- ブラジル
- アルゼンチン
- 中東・アフリカ
- 南アフリカ
- サウジアラビア
- アラブ首長国連邦
- クウェート
第10章 競合情勢
- 企業/競合の分類
- 戦略マッピング
- 企業市況分析、2024年
- 主要な認証プロバイダー/スキーム所有者のリスト
- 企業プロファイル/上場企業
- Abbott
- BD
- Quidel Corporation
- BioSure
- F. Hoffmann-La Roche Ltd.
- Nova Biomedical
- Siemens Healthcare GmbH
- ACON Laboratories, Inc.
- OraSure Technologies, Inc.
- Chembio Diagnostics, Inc.
List of Tables
- Table 1 List of Secondary Sources
- Table 2 List of Abbreviations
- Table 3 Global Home Care Testing Market, by Age, 2018 - 2030 (USD Million)
- Table 4 Global Home Care Testing Market, by Sample, 2018 - 2030 (USD Million)
- Table 5 Global Home Care Testing Market, by Test Type, 2018 - 2030 (USD Million)
- Table 6 Global Home Care Testing Market, by Distribution Channel, 2018 - 2030 (USD Million)
- Table 7 Global Home Care Testing Market, by Product, 2018 - 2030 (USD Million)
- Table 8 Global Home Care Testing Market, by Region, 2018 - 2030 (USD Million)
- Table 9 North America Home Care Testing Market, by Country, 2018 - 2030 (USD Million)
- Table 10 North America Home Care Testing Market, by Age, 2018 - 2030 (USD Million)
- Table 11 North America Home Care Testing Market, by Sample, 2018 - 2030 (USD Million)
- Table 12 North America Home Care Testing Market, by Test Type, 2018 - 2030 (USD Million)
- Table 13 North America Home Care Testing Market, by Distribution Channel, 2018 - 2030 (USD Million)
- Table 14 North America Home Care Testing Market, by Product, 2018 - 2030 (USD Million)
- Table 15 U.S. Home Care Testing Market, by Age, 2018 - 2030 (USD Million)
- Table 16 U.S. Home Care Testing Market, by Sample, 2018 - 2030 (USD Million)
- Table 17 U.S. Home Care Testing Market, by Test Type, 2018 - 2030 (USD Million)
- Table 18 U.S. Home Care Testing Market, by Distribution Channel, 2018 - 2030 (USD Million)
- Table 19 U.S. Home Care Testing Market, by Product, 2018 - 2030 (USD Million)
- Table 20 Canada Home Care Testing Market, by Age, 2018 - 2030 (USD Million)
- Table 21 Canada Home Care Testing Market, by Sample, 2018 - 2030 (USD Million)
- Table 22 Canada Home Care Testing Market, by Test Type, 2018 - 2030 (USD Million)
- Table 23 Canada Home Care Testing Market, by Distribution Channel, 2018 - 2030 (USD Million)
- Table 24 Canada Home Care Testing Market, by Product, 2018 - 2030 (USD Million)
- Table 25 Mexico Home Care Testing Market, by Age, 2018 - 2030 (USD Million)
- Table 26 Mexico Home Care Testing Market, by Sample, 2018 - 2030 (USD Million)
- Table 27 Mexico Home Care Testing Market, by Test Type, 2018 - 2030 (USD Million)
- Table 28 Mexico Home Care Testing Market, by Distribution Channel, 2018 - 2030 (USD Million)
- Table 29 Mexico Home Care Testing Market, by Product, 2018 - 2030 (USD Million)
- Table 30 Europe Home Care Testing Market, by Country, 2018 - 2030 (USD Million)
- Table 31 Europe Home Care Testing Market, by Age, 2018 - 2030 (USD Million)
- Table 32 Europe Home Care Testing Market, by Sample, 2018 - 2030 (USD Million)
- Table 33 Europe Home Care Testing Market, by Test Type, 2018 - 2030 (USD Million)
- Table 34 Europe Home Care Testing Market, by Distribution Channel, 2018 - 2030 (USD Million)
- Table 35 Europe Home Care Testing Market, by Product, 2018 - 2030 (USD Million)
- Table 36 Germany Home Care Testing Market, by Age, 2018 - 2030 (USD Million)
- Table 37 Germany Home Care Testing Market, by Sample, 2018 - 2030 (USD Million)
- Table 38 Germany Home Care Testing Market, by Test Type, 2018 - 2030 (USD Million)
- Table 39 Germany Home Care Testing Market, by Distribution Channel, 2018 - 2030 (USD Million)
- Table 40 Germany Home Care Testing Market, by Product, 2018 - 2030 (USD Million)
- Table 41 UK Home Care Testing Market, by Age, 2018 - 2030 (USD Million)
- Table 42 UK Home Care Testing Market, by Sample, 2018 - 2030 (USD Million)
- Table 43 UK Home Care Testing Market, by Test Type, 2018 - 2030 (USD Million)
- Table 44 UK Home Care Testing Market, by Distribution Channel, 2018 - 2030 (USD Million)
- Table 45 UK Home Care Testing Market, by Product, 2018 - 2030 (USD Million)
- Table 46 France Home Care Testing Market, by Age, 2018 - 2030 (USD Million)
- Table 47 France Home Care Testing Market, by Sample, 2018 - 2030 (USD Million)
- Table 48 France Home Care Testing Market, by Test Type, 2018 - 2030 (USD Million)
- Table 49 France Home Care Testing Market, by Distribution Channel, 2018 - 2030 (USD Million)
- Table 50 France Home Care Testing Market, by Product, 2018 - 2030 (USD Million)
- Table 51 Italy Home Care Testing Market, by Age, 2018 - 2030 (USD Million)
- Table 52 Italy Home Care Testing Market, by Sample, 2018 - 2030 (USD Million)
- Table 53 Italy Home Care Testing Market, by Test Type, 2018 - 2030 (USD Million)
- Table 54 Italy Home Care Testing Market, by Distribution Channel, 2018 - 2030 (USD Million)
- Table 55 Italy Home Care Testing Market, by Product, 2018 - 2030 (USD Million)
- Table 56 Spain Home Care Testing Market, by Age, 2018 - 2030 (USD Million)
- Table 57 Spain Home Care Testing Market, by Sample, 2018 - 2030 (USD Million)
- Table 58 Spain Home Care Testing Market, by Test Type, 2018 - 2030 (USD Million)
- Table 59 Spain Home Care Testing Market, by Distribution Channel, 2018 - 2030 (USD Million)
- Table 60 Spain Home Care Testing Market, by Product, 2018 - 2030 (USD Million)
- Table 61 Norway Home Care Testing Market, by Age, 2018 - 2030 (USD Million)
- Table 62 Norway Home Care Testing Market, by Sample, 2018 - 2030 (USD Million)
- Table 63 Norway Home Care Testing Market, by Test Type, 2018 - 2030 (USD Million)
- Table 64 Norway Home Care Testing Market, by Distribution Channel, 2018 - 2030 (USD Million)
- Table 65 Norway Home Care Testing Market, by Product, 2018 - 2030 (USD Million)
- Table 66 Sweden Home Care Testing Market, by Age, 2018 - 2030 (USD Million)
- Table 67 Sweden Home Care Testing Market, by Sample, 2018 - 2030 (USD Million)
- Table 68 Sweden Home Care Testing Market, by Test Type, 2018 - 2030 (USD Million)
- Table 69 Sweden Home Care Testing Market, by Distribution Channel, 2018 - 2030 (USD Million)
- Table 70 Sweden Home Care Testing Market, by Product, 2018 - 2030 (USD Million)
- Table 71 Denmark Home Care Testing Market, by Age, 2018 - 2030 (USD Million)
- Table 72 Denmark Home Care Testing Market, by Sample, 2018 - 2030 (USD Million)
- Table 73 Denmark Home Care Testing Market, by Test Type, 2018 - 2030 (USD Million)
- Table 74 Denmark Home Care Testing Market, by Distribution Channel, 2018 - 2030 (USD Million)
- Table 75 Denmark Home Care Testing Market, by Product, 2018 - 2030 (USD Million)
- Table 76 Asia Pacific Home Care Testing Market, by Country, 2018 - 2030 (USD Million)
- Table 77 Asia Pacific Home Care Testing Market, by Age, 2018 - 2030 (USD Million)
- Table 78 Asia Pacific Home Care Testing Market, by Sample, 2018 - 2030 (USD Million)
- Table 79 Asia Pacific Home Care Testing Market, by Test Type, 2018 - 2030 (USD Million)
- Table 80 Asia Pacific Home Care Testing Market, by Distribution Channel, 2018 - 2030 (USD Million)
- Table 81 Asia Pacific Home Care Testing Market, by Product, 2018 - 2030 (USD Million)
- Table 82 China Home Care Testing Market, by Age, 2018 - 2030 (USD Million)
- Table 83 China Home Care Testing Market, by Sample, 2018 - 2030 (USD Million)
- Table 84 China Home Care Testing Market, by Test Type, 2018 - 2030 (USD Million)
- Table 85 China Home Care Testing Market, by Distribution Channel, 2018 - 2030 (USD Million)
- Table 86 China Home Care Testing Market, by Product, 2018 - 2030 (USD Million)
- Table 87 Japan Home Care Testing Market, by Age, 2018 - 2030 (USD Million)
- Table 88 Japan Home Care Testing Market, by Sample, 2018 - 2030 (USD Million)
- Table 89 Japan Home Care Testing Market, by Test Type, 2018 - 2030 (USD Million)
- Table 90 Japan Home Care Testing Market, by Distribution Channel, 2018 - 2030 (USD Million)
- Table 91 Japan Home Care Testing Market, by Product, 2018 - 2030 (USD Million)
- Table 92 India Home Care Testing Market, by Age, 2018 - 2030 (USD Million)
- Table 93 India Home Care Testing Market, by Sample, 2018 - 2030 (USD Million)
- Table 94 India Home Care Testing Market, by Test Type, 2018 - 2030 (USD Million)
- Table 95 India Home Care Testing Market, by Distribution Channel, 2018 - 2030 (USD Million)
- Table 96 India Home Care Testing Market, by Product, 2018 - 2030 (USD Million)
- Table 97 Australia Home Care Testing Market, by Age, 2018 - 2030 (USD Million)
- Table 98 Australia Home Care Testing Market, by Sample, 2018 - 2030 (USD Million)
- Table 99 Australia Home Care Testing Market, by Test Type, 2018 - 2030 (USD Million)
- Table 100 Australia Home Care Testing Market, by Distribution Channel, 2018 - 2030 (USD Million)
- Table 101 Australia Home Care Testing Market, by Product, 2018 - 2030 (USD Million)
- Table 102 South Korea Home Care Testing Market, by Age, 2018 - 2030 (USD Million)
- Table 103 South Korea Home Care Testing Market, by Sample, 2018 - 2030 (USD Million)
- Table 104 South Korea Home Care Testing Market, by Test Type, 2018 - 2030 (USD Million)
- Table 105 South Korea Home Care Testing Market, by Distribution Channel, 2018 - 2030 (USD Million)
- Table 106 South Korea Home Care Testing Market, by Product, 2018 - 2030 (USD Million)
- Table 107 Thailand Home Care Testing Market, by Age, 2018 - 2030 (USD Million)
- Table 108 Thailand Home Care Testing Market, by Sample, 2018 - 2030 (USD Million)
- Table 109 Thailand Home Care Testing Market, by Test Type, 2018 - 2030 (USD Million)
- Table 110 Thailand Home Care Testing Market, by Distribution Channel, 2018 - 2030 (USD Million)
- Table 111 Thailand Home Care Testing Market, by Product, 2018 - 2030 (USD Million)
- Table 112 Latin America Home Care Testing Market, by Country, 2018 - 2030 (USD Million)
- Table 113 Latin America Home Care Testing Market, by Age, 2018 - 2030 (USD Million)
- Table 114 Latin America Home Care Testing Market, by Sample, 2018 - 2030 (USD Million)
- Table 115 Latin America Home Care Testing Market, by Test Type, 2018 - 2030 (USD Million)
- Table 116 Latin America Home Care Testing Market, by Distribution Channel, 2018 - 2030 (USD Million)
- Table 117 Latin America Home Care Testing Market, by Product, 2018 - 2030 (USD Million)
- Table 118 Brazil Home Care Testing Market, by Age, 2018 - 2030 (USD Million)
- Table 119 Brazil Home Care Testing Market, by Sample, 2018 - 2030 (USD Million)
- Table 120 Brazil Home Care Testing Market, by Test Type, 2018 - 2030 (USD Million)
- Table 121 Brazil Home Care Testing Market, by Distribution Channel, 2018 - 2030 (USD Million)
- Table 122 Brazil Home Care Testing Market, by Product, 2018 - 2030 (USD Million)
- Table 123 Argentina Home Care Testing Market, by Age, 2018 - 2030 (USD Million)
- Table 124 Argentina Home Care Testing Market, by Sample, 2018 - 2030 (USD Million)
- Table 125 Argentina Home Care Testing Market, by Test Type, 2018 - 2030 (USD Million)
- Table 126 Argentina Home Care Testing Market, by Distribution Channel, 2018 - 2030 (USD Million)
- Table 127 Argentina Home Care Testing Market, by Product, 2018 - 2030 (USD Million)
- Table 128 Middle East & Africa Home Care Testing Market, by Country, 2018 - 2030 (USD Million)
- Table 129 Middle East & Africa Home Care Testing Market, by Age, 2018 - 2030 (USD Million)
- Table 130 Middle East & Africa Home Care Testing Market, by Sample, 2018 - 2030 (USD Million)
- Table 131 Middle East & Africa Home Care Testing Market, by Test Type, 2018 - 2030 (USD Million)
- Table 132 Middle East & Africa Home Care Testing Market, by Distribution Channel, 2018 - 2030 (USD Million)
- Table 133 Middle East & Africa Home Care Testing Market, by Product, 2018 - 2030 (USD Million)
- Table 134 South Africa Home Care Testing Market, by Age, 2018 - 2030 (USD Million)
- Table 135 South Africa Home Care Testing Market, by Sample, 2018 - 2030 (USD Million)
- Table 136 South Africa Home Care Testing Market, by Test Type, 2018 - 2030 (USD Million)
- Table 137 South Africa Home Care Testing Market, by Distribution Channel, 2018 - 2030 (USD Million)
- Table 138 South Africa Home Care Testing Market, by Product, 2018 - 2030 (USD Million)
- Table 139 Saudi Arabia Home Care Testing Market, by Age, 2018 - 2030 (USD Million)
- Table 140 Saudi Arabia Home Care Testing Market, by Sample, 2018 - 2030 (USD Million)
- Table 141 Saudi Arabia Home Care Testing Market, by Test Type, 2018 - 2030 (USD Million)
- Table 142 Saudi Arabia Home Care Testing Market, by Distribution Channel, 2018 - 2030 (USD Million)
- Table 143 Saudi Arabia Home Care Testing Market, by Product, 2018 - 2030 (USD Million)
- Table 144 UAE Home Care Testing Market, by Age, 2018 - 2030 (USD Million)
- Table 145 UAE Home Care Testing Market, by Sample, 2018 - 2030 (USD Million)
- Table 146 UAE Home Care Testing Market, by Test Type, 2018 - 2030 (USD Million)
- Table 147 UAE Home Care Testing Market, by Distribution Channel, 2018 - 2030 (USD Million)
- Table 148 UAE Home Care Testing Market, by Product, 2018 - 2030 (USD Million)
- Table 149 Kuwait Home Care Testing Market, by Age, 2018 - 2030 (USD Million)
- Table 150 Kuwait Home Care Testing Market, by Sample, 2018 - 2030 (USD Million)
- Table 151 Kuwait Home Care Testing Market, by Test Type, 2018 - 2030 (USD Million)
- Table 152 Kuwait Home Care Testing Market, by Distribution Channel, 2018 - 2030 (USD Million)
- Table 153 Kuwait Home Care Testing Market, by Product, 2018 - 2030 (USD Million)
List of Figures
- Fig. 1 Market research process
- Fig. 2 Data triangulation techniques
- Fig. 3 Primary research pattern
- Fig. 4 Market research approaches
- Fig. 5 Value-chain-based sizing & forecasting
- Fig. 6 QFD modeling for market share assessment
- Fig. 7 Market formulation & validation
- Fig. 8 Market snapshot
- Fig. 9 Segment snapshot
- Fig. 10 Competitive landscape snapshot
- Fig. 11 Home care testing market driver analysis
- Fig. 12 Home care testing market restraint analysis
- Fig. 13 Home care testing market: Porter's analysis
- Fig. 14 Home care testing market: PESTLE analysis
- Fig. 15 Home care testing market: Age outlook and key takeaways
- Fig. 16 Home care testing market: Age market share analysis, 2024 - 2030
- Fig. 17 Global Pediatric market, 2018 - 2030 (USD Million)
- Fig. 18 Global Adult market, 2018 - 2030 (USD Million)
- Fig. 19 Global Geriatric market, 2018 - 2030 (USD Million)
- Fig. 20 Home care testing market: Sample outlook and key takeaways
- Fig. 21 Home care testing market: Sample market share analysis, 2024 - 2030
- Fig. 22 Global Urine market, 2018 - 2030 (USD Million)
- Fig. 23 Global Saliva market, 2018 - 2030 (USD Million)
- Fig. 24 Global Blood market, 2018 - 2030 (USD Million)
- Fig. 25 Global Others market, 2018 - 2030 (USD Million)
- Fig. 26 Home care testing market: Test type outlook and key takeaways
- Fig. 27 Home care testing market: Test type market share analysis, 2024 - 2030
- Fig. 28 Global HIV Test Kit market, 2018 - 2030 (USD Million)
- Fig. 29 Global Diabetes and Glucose Tests market, 2018 - 2030 (USD Million)
- Fig. 30 Global Cholesterol and Triglycerides Tests market, 2018 - 2030 (USD Million)
- Fig. 31 Global Pregnancy Tests market, 2018 - 2030 (USD Million)
- Fig. 32 Global Infectious Diseases Tests market, 2018 - 2030 (USD Million)
- Fig. 33 Global Urinary Tract Infection Tests market, 2018 - 2030 (USD Million)
- Fig. 34 Global Others market, 2018 - 2030 (USD Million)
- Fig. 35 Home care testing market: Distribution channel outlook and key takeaways
- Fig. 36 Home care testing market: Distribution channel market share analysis, 2024 - 2030
- Fig. 37 Global Retail Pharmacies market, 2018 - 2030 (USD Million)
- Fig. 38 Global Supermarket/Hypermarket market, 2018 - 2030 (USD Million)
- Fig. 39 Global Online Pharmacies market, 2018 - 2030 (USD Million)
- Fig. 40 Home care testing market: Product outlook and key takeaways
- Fig. 41 Home care testing market: Product market share analysis, 2024 - 2030
- Fig. 42 Global Strip market, 2018 - 2030 (USD Million)
- Fig. 43 Global Cassette market, 2018 - 2030 (USD Million)
- Fig. 44 Global Test Pane market, 2018 - 2030 (USD Million)
- Fig. 45 Global Midstream market, 2018 - 2030 (USD Million)
- Fig. 46 Global Dip Card market, 2018 - 2030 (USD Million)
- Fig. 47 Global Others market, 2018 - 2030 (USD Million)
- Fig. 48 Regional marketplace key takeaways
- Fig. 49 North America home care testing market estimates and forecast, 2018 - 2030 (USD Million)
- Fig. 50 U.S. home care testing market estimates and forecast, 2018 - 2030 (USD Million)
- Fig. 51 U.S. key country dynamics
- Fig. 52 Canada home care testing market, 2018 - 2030 (USD Million)
- Fig. 53 Canada key country dynamics
- Fig. 54 Mexico home care testing market, 2018 - 2030 (USD Million)
- Fig. 55 Mexico key country dynamics
- Fig. 56 Europe home care testing market estimates and forecast, 2018 - 2030 (USD Million)
- Fig. 57 UK home care testing market estimates and forecast, 2018 - 2030 (USD Million)
- Fig. 58 UK key country dynamics
- Fig. 59 Germany home care testing market estimates and forecast, 2018 - 2030 (USD Million)
- Fig. 60 Germany key country dynamics
- Fig. 61 France home care testing market estimates and forecast, 2018 - 2030 (USD Million)
- Fig. 62 France key country dynamics
- Fig. 63 Italy home care testing market estimates and forecast, 2018 - 2030 (USD Million)
- Fig. 64 Italy key country dynamics
- Fig. 65 Spain home care testing market estimates and forecast, 2018 - 2030 (USD Million)
- Fig. 66 Spain key country dynamics
- Fig. 67 Denmark home care testing market estimates and forecast, 2018 - 2030 (USD Million)
- Fig. 68 Denmark key country dynamics
- Fig. 69 Sweden home care testing market estimates and forecast, 2018 - 2030 (USD Million)
- Fig. 70 Sweden key country dynamics
- Fig. 71 Norway home care testing market estimates and forecast, 2018 - 2030 (USD Million)
- Fig. 72 Norway key country dynamics
- Fig. 73 Asia-Pacific home care testing market estimates and forecast, 2018 - 2030 (USD Million)
- Fig. 74 Japan home care testing market estimates and forecast, 2018 - 2030 (USD Million)
- Fig. 75 Japan key country dynamics
- Fig. 76 China home care testing market estimates and forecast, 2018 - 2030 (USD Million)
- Fig. 77 China key country dynamics
- Fig. 78 India home care testing market estimates and forecast, 2018 - 2030 (USD Million)
- Fig. 79 India key country dynamics
- Fig. 80 Australia home care testing market estimates and forecast, 2018 - 2030 (USD Million)
- Fig. 81 Australia key country dynamics
- Fig. 82 Thailand home care testing market estimates and forecast, 2018 - 2030 (USD Million)
- Fig. 83 Thailand key country dynamics
- Fig. 84 South Korea home care testing market estimates and forecast, 2018 - 2030 (USD Million)
- Fig. 85 South Korea key country dynamics
- Fig. 86 Latin America home care testing market estimates and forecast, 2018 - 2030 (USD Million)
- Fig. 87 Brazil home care testing market estimates and forecast, 2018 - 2030 (USD Million)
- Fig. 88 Brazil key country dynamics
- Fig. 89 Argentina home care testing market estimates and forecast, 2018 - 2030 (USD Million)
- Fig. 90 Argentina key country dynamics
- Fig. 91 MEA home care testing market estimates and forecast, 2018 - 2030 (USD Million)
- Fig. 92 South Africa home care testing market estimates and forecast, 2018 - 2030 (USD Million)
- Fig. 93 South Africa key country dynamics
- Fig. 94 Saudi Arabia home care testing market estimates and forecast, 2018 - 2030 (USD Million)
- Fig. 95 Saudi Arabia key country dynamics
- Fig. 96 UAE home care testing market estimates and forecast, 2018 - 2030 (USD Million)
- Fig. 97 UAE key country dynamics
- Fig. 98 Kuwait home care testing market estimates and forecast, 2018 - 2030 (USD Million)
- Fig. 99 Kuwait key country dynamics
- Fig. 100 Key company categorization
- Fig. 101 Company market share analysis
- Fig. 102 Company market position analysis
- Fig. 103 Market participant categorization
- Fig. 104 Strategy framework
Home Care Testing Market Growth & Trends:
The global home care testing market size is estimated to reach USD 17.95 billion by 2030, registering to grow at a CAGR of 9.36% from 2025 to 2030 according to a new report by Grand View Research, Inc. The growth of the market is attributed to factors, such as increasing demand for convenient and accessible healthcare solutions, growing focus on preventative healthcare and wellness, and technological advancements.An increase in technological advancements is another major factor contributing to the market growth. There have been significant advances in diagnostic technologies, such as digital imaging, molecular diagnostics, and lab-on-a-chip systems, which have enabled the development of innovative and effective at-home testing devices. In March 2023, Cue Health, a healthcare technology company, expanded its Cue Care platform with the launch of a suite of at-home diagnostic tests.
The tests are designed to provide individuals with quick and accurate results, allowing them to take control of their health and wellness. The new tests include a range of options, such as tests for COVID-19, influenza, and Respiratory Syncytial Virus (RSV).Furthermore, home care testing has helped to reduce healthcare costs. By enabling patients to conduct their own tests at home, healthcare providers can save on the cost of labor and infrastructure needed to perform testing in a healthcare setting. This can help make healthcare more affordable and accessible for patients, particularly those with chronic conditions requiring frequent testing. In addition, home care testing has increased accessibility for patients in rural or remote areas who may not have easy access to healthcare facilities.
By enabling patients to conduct tests at home, healthcare providers reach patients who might have difficulty accessing healthcare services.The pandemic has highlighted the importance of regular monitoring and early detection of diseases, which has boosted the demand for home care testing kits. Companies have been developing new technologies and solutions to address the growing demand for quick and accurate testing solutions. This has led to the development of a range of new home care testing products, including rapid antigen tests, antibody tests, and PCR tests, which have all been used to help diagnose and monitor COVID-19. In March 2023, Lucira Health received FDA authorization for its over-the-counter (OTC) flu and COVID-19 test. The test enables individuals to test themselves for COVID-19 and the flu at home, without the need for a healthcare provider.
Home Care Testing Market Report Highlights:
- Based on age, the geriatric segment captured the highest market share in 2024 due to the presence of the geriatric population coupled with a highincidence of chronic diseases.
- Based on sample, the urine sample segment dominated the market in 2024. Advances in technology have led to more accurate and reliable urine sample testing, allowing for earlier detection and treatment of health conditions.
- Based on test type, the infectious disease segment is expected to dominate the market in 2024. The growth of the segment is attributed to factors, such as increasing cases of infectious diseases globally and a high number of product approvals.
- Based on distribution channel, the retail pharmacies segment is expected to dominate the market in 2024.These are easily accessible to consumers, with many located in convenient locations, such as shopping centers and grocery stores.
- Based on product, the strip segment dominated the market in 2024. The strip tests are relatively inexpensive & easy to use and can be performed at home without the need for specialized equipment.
- North America dominated the market and accounted for the largest revenue share of 33.71% in 2024 owing to the presence geriatric population and well-developed healthcare infrastructure.
Table of Contents
Chapter 1. Methodology and Scope
- 1.1. Market Segmentation & Scope
- 1.2. Market Definitions
- 1.2.1. Age Segment
- 1.2.2. Sample Segment
- 1.2.3. Test Type Segment
- 1.2.4. Distribution Channel Segment
- 1.2.5. Product Segment
- 1.3. Information analysis
- 1.3.1. Market formulation & data visualization
- 1.4. Data validation & publishing
- 1.5. Information Procurement
- 1.5.1. Primary Research
- 1.6. Information or Data Analysis
- 1.7. Market Formulation & Validation
- 1.8. Market Model
- 1.9. Total Market: CAGR Calculation
- 1.10. Objectives
- 1.10.1. Objective 1
- 1.10.2. Objective 2
Chapter 2. Executive Summary
- 2.1. Market Outlook
- 2.2. Segment Snapshot
- 2.3. Competitive Insights Landscape
Chapter 3. Global Home Care Testing Market Variables, Trends & Scope
- 3.1. Market Lineage Outlook
- 3.1.1. Parent market outlook
- 3.1.2. Related/ancillary market outlook.
- 3.2. Market Dynamics
- 3.2.1. Market Driver Analysis
- 3.2.1.1. Growing prevalence of chronic diseases
- 3.2.1.2. Technological advancements in diagnostic testing
- 3.2.1.3. Increasing demand for self-monitoring and preventive healthcare
- 3.2.2. Market Restraint Analysis
- 3.2.2.1. Lack of reimbursement
- 3.2.2.2. Limited accuracy and reliability of some tests
- 3.2.1. Market Driver Analysis
- 3.3. Global Home Testing Market Analysis Tools
- 3.3.1. Industry Analysis - Porter's
- 3.3.2. PESTEL Analysis
- 3.3.3. COVID-19 Impact Analysis
Chapter 4. Global Home Care Testing Market: Age Estimates & Trend Analysis
- 4.1. Segment Dashboard
- 4.2. Global Home Care Testing Market Age Movement Analysis
- 4.3. Global Home Care Testing Market Size & Trend Analysis, by Age, 2018 to 2030 (USD Million)
- 4.4. Pediatric
- 4.4.1. Pediatric market estimates and forecast, 2018 - 2030 (USD Million)
- 4.5. Adult
- 4.5.1. Adult market estimates and forecast, 2018 - 2030 (USD Million)
- 4.6. Geriatric
- 4.6.1. Geriatric market estimates and forecast, 2018 - 2030 (USD Million)
Chapter 5. Global Home Care Testing Market: Sample Estimates & Trend Analysis
- 5.1. Segment Dashboard
- 5.2. Global Home Care Testing Market Sample Movement Analysis
- 5.3. Global Home Care Testing Market Size & Trend Analysis, by Sample, 2018 to 2030 (USD Million)
- 5.4. Urine
- 5.4.1. Urine market estimates and forecasts, 2018 to 2030 (USD Million)
- 5.5. Saliva
- 5.5.1. Saliva market estimates and forecasts, 2018 to 2030 (USD Million)
- 5.6. Blood
- 5.6.1. Blood market estimates and forecasts, 2018 to 2030 (USD Million)
- 5.7. Others
- 5.7.1. Others market estimates and forecasts, 2018 to 2030 (USD Million)
Chapter 6. Global Home Care Testing Market: Test Type Estimates & Trend Analysis
- 6.1. Segment Dashboard
- 6.2. Global Home Care Testing Market Test Type Movement Analysis
- 6.3. Global Home Care Testing Market Size & Trend Analysis, by Test Type, 2018 to 2030 (USD Million)
- 6.4. HIV Test Kit
- 6.4.1. HIV test kit market estimates and forecast, 2018 - 2030 (USD Million)
- 6.5. Diabetes and Glucose Tests
- 6.5.1. Diabetes and glucose tests market estimates and forecast, 2018 - 2030 (USD Million)
- 6.6. Cholesterol and Triglycerides Tests
- 6.6.1. Cholesterol and triglycerides tests market estimates and forecast, 2018 - 2030 (USD Million)
- 6.7. Pregnancy Tests
- 6.7.1. Pregnancy tests market estimates and forecast, 2018 - 2030 (USD Million)
- 6.8. Infectious Diseases Tests
- 6.8.1. Infectious diseases tests market estimates and forecast, 2018 - 2030 (USD Million)
- 6.9. Urinary Tract Infection Tests
- 6.9.1. Urinary tract infection tests market estimates and forecast, 2018 - 2030 (USD Million)
- 6.10. Others
- 6.10.1. Others market estimates and forecast, 2018 - 2030 (USD Million)
Chapter 7. Global Home Care Testing Market: Distribution Channel Estimates & Trend Analysis
- 7.1. Segment Dashboard
- 7.2. Global Home Care Testing Market Distribution Channel Movement Analysis
- 7.3. Global Home Care Testing Market Size & Trend Analysis, by Distribution Channel, 2018 to 2030 (USD Million)
- 7.4. Retail Pharmacies
- 7.4.1. Retail pharmacies market estimates and forecast, 2018 - 2030 (USD Million)
- 7.5. Supermarket/Hypermarket
- 7.5.1. Supermarket/Hypermarket market estimates and forecast, 2018 - 2030 (USD Million)
- 7.6. Online Pharmacies
- 7.6.1. Online pharmacies market estimates and forecast, 2018 - 2030 (USD Million)
Chapter 8. Global Home Care Testing Market: Product Estimates & Trend Analysis
- 8.1. Segment Dashboard
- 8.2. Global Home Care Testing Market Product Movement Analysis
- 8.3. Global Home Care Testing Market Size & Trend Analysis, by product, 2018 to 2030 (USD Million)
- 8.4. Strip
- 8.4.1. Strip market estimates and forecast, 2018 - 2030 (USD Million)
- 8.5. Cassette
- 8.5.1. Cassette market estimates and forecast, 2018 - 2030 (USD Million)
- 8.6. Panel
- 8.6.1. Panel market estimates and forecast, 2018 - 2030 (USD Million)
- 8.7. Midstream
- 8.7.1. Midstream market estimates and forecast, 2018 - 2030 (USD Million)
- 8.8. Dip Card
- 8.8.1. Dip card market estimates and forecast, 2018 - 2030 (USD Million)
- 8.9. Others
- 8.9.1. Others market estimates and forecast, 2018 - 2030 (USD Million)
Chapter 9. Home Care Testing Market: Regional Estimates & Trend Analysis
- 9.1. Regional Dashboard
- 9.2. Market Size & Forecasts Trend Analysis, 2018 to 2030:
- 9.3. North America
- 9.3.1. U.S.
- 9.3.1.1. Key country dynamics
- 9.3.1.2. Regulatory framework/ reimbursement structure
- 9.3.1.3. Competitive scenario
- 9.3.1.4. U.S. market estimates and forecasts, 2018 to 2030 (USD Million)
- 9.3.2. Canada
- 9.3.2.1. Key country dynamics
- 9.3.2.2. Regulatory framework/ reimbursement structure
- 9.3.2.3. Competitive scenario
- 9.3.2.4. Canada market estimates and forecasts, 2018 to 2030 (USD Million)
- 9.3.3. Mexico
- 9.3.3.1. Key country dynamics
- 9.3.3.2. Regulatory framework/ reimbursement structure
- 9.3.3.3. Competitive scenario
- 9.3.3.4. Mexico market estimates and forecasts, 2018 to 2030 (USD Million)
- 9.3.1. U.S.
- 9.4. Europe
- 9.4.1. UK
- 9.4.1.1. Key country dynamics
- 9.4.1.2. Regulatory framework/ reimbursement structure
- 9.4.1.3. Competitive scenario
- 9.4.1.4. UK market estimates and forecasts, 2018 to 2030 (USD Million)
- 9.4.2. Germany
- 9.4.2.1. Key country dynamics
- 9.4.2.2. Regulatory framework/ reimbursement structure
- 9.4.2.3. Competitive scenario
- 9.4.2.4. Germany market estimates and forecasts, 2018 to 2030 (USD Million)
- 9.4.3. France
- 9.4.3.1. Key country dynamics
- 9.4.3.2. Regulatory framework/ reimbursement structure
- 9.4.3.3. Competitive scenario
- 9.4.3.4. France market estimates and forecasts, 2018 to 2030 (USD Million)
- 9.4.4. Italy
- 9.4.4.1. Key country dynamics
- 9.4.4.2. Regulatory framework/ reimbursement structure
- 9.4.4.3. Competitive scenario
- 9.4.4.4. Italy market estimates and forecasts, 2018 to 2030 (USD Million)
- 9.4.5. Spain
- 9.4.5.1. Key country dynamics
- 9.4.5.2. Regulatory framework/ reimbursement structure
- 9.4.5.3. Competitive scenario
- 9.4.5.4. Spain market estimates and forecasts, 2018 to 2030 (USD Million)
- 9.4.6. Norway
- 9.4.6.1. Key country dynamics
- 9.4.6.2. Regulatory framework/ reimbursement structure
- 9.4.6.3. Competitive scenario
- 9.4.6.4. Norway market estimates and forecasts, 2018 to 2030 (USD Million)
- 9.4.7. Sweden
- 9.4.7.1. Key country dynamics
- 9.4.7.2. Regulatory framework/ reimbursement structure
- 9.4.7.3. Competitive scenario
- 9.4.7.4. Sweden market estimates and forecasts, 2018 to 2030 (USD Million)
- 9.4.8. Denmark
- 9.4.8.1. Key country dynamics
- 9.4.8.2. Regulatory framework/ reimbursement structure
- 9.4.8.3. Competitive scenario
- 9.4.8.4. Denmark market estimates and forecasts, 2018 to 2030 (USD Million)
- 9.4.1. UK
- 9.5. Asia Pacific
- 9.5.1. Japan
- 9.5.1.1. Key country dynamics
- 9.5.1.2. Regulatory framework/ reimbursement structure
- 9.5.1.3. Competitive scenario
- 9.5.1.4. Japan market estimates and forecasts, 2018 to 2030 (USD Million)
- 9.5.2. China
- 9.5.2.1. Key country dynamics
- 9.5.2.2. Regulatory framework/ reimbursement structure
- 9.5.2.3. Competitive scenario
- 9.5.2.4. China market estimates and forecasts, 2018 to 2030 (USD Million)
- 9.5.3. India
- 9.5.3.1. Key country dynamics
- 9.5.3.2. Regulatory framework/ reimbursement structure
- 9.5.3.3. Competitive scenario
- 9.5.3.4. India market estimates and forecasts, 2018 to 2030 (USD Million)
- 9.5.4. Australia
- 9.5.4.1. Key country dynamics
- 9.5.4.2. Regulatory framework/ reimbursement structure
- 9.5.4.3. Competitive scenario
- 9.5.4.4. Australia market estimates and forecasts, 2018 to 2030 (USD Million)
- 9.5.5. South Korea
- 9.5.5.1. Key country dynamics
- 9.5.5.2. Regulatory framework/ reimbursement structure
- 9.5.5.3. Competitive scenario
- 9.5.5.4. South Korea market estimates and forecasts, 2018 to 2030 (USD Million)
- 9.5.6. Thailand
- 9.5.6.1. Key country dynamics
- 9.5.6.2. Regulatory framework/ reimbursement structure
- 9.5.6.3. Competitive scenario
- 9.5.6.4. Thailand market estimates and forecasts, 2018 to 2030 (USD Million)
- 9.5.1. Japan
- 9.6. Latin America
- 9.6.1. Brazil
- 9.6.1.1. Key country dynamics
- 9.6.1.2. Regulatory framework/ reimbursement structure
- 9.6.1.3. Competitive scenario
- 9.6.1.4. Brazil market estimates and forecasts, 2018 to 2030 (USD Million)
- 9.6.2. Argentina
- 9.6.2.1. Key country dynamics
- 9.6.2.2. Regulatory framework/ reimbursement structure
- 9.6.2.3. Competitive scenario
- 9.6.2.4. Argentina market estimates and forecasts, 2018 to 2030 (USD Million)
- 9.6.1. Brazil
- 9.7. MEA
- 9.7.1. South Africa
- 9.7.1.1. Key country dynamics
- 9.7.1.2. Regulatory framework/ reimbursement structure
- 9.7.1.3. Competitive scenario
- 9.7.1.4. South Africa market estimates and forecasts, 2018 to 2030 (USD Million)
- 9.7.2. Saudi Arabia
- 9.7.2.1. Key country dynamics
- 9.7.2.2. Regulatory framework/ reimbursement structure
- 9.7.2.3. Competitive scenario
- 9.7.2.4. Saudi Arabia market estimates and forecasts, 2018 to 2030 (USD Million)
- 9.7.3. UAE
- 9.7.3.1. Key country dynamics
- 9.7.3.2. Regulatory framework/ reimbursement structure
- 9.7.3.3. Competitive scenario
- 9.7.3.4. UAE market estimates and forecasts, 2018 to 2030 (USD Million)
- 9.7.4. Kuwait
- 9.7.4.1. Key country dynamics
- 9.7.4.2. Regulatory framework/ reimbursement structure
- 9.7.4.3. Competitive scenario
- 9.7.4.4. Kuwait market estimates and forecasts, 2018 to 2030 (USD Million)
- 9.7.1. South Africa
Chapter 10. Competitive Landscape
- 10.1. Company/Competition Categorization
- 10.2. Strategy Mapping
- 10.3. Company Market Position Analysis, 2024
- 10.4. List of Key Certification Providers/Scheme Owners
- 10.5. Company Profiles/Listing
- 10.5.1. Abbott
- 10.5.1.1. Company overview
- 10.5.1.2. Financial performance
- 10.5.1.3. Product benchmarking
- 10.5.1.4. Strategic initiatives
- 10.5.2. BD
- 10.5.2.1. Company overview
- 10.5.2.2. Financial performance
- 10.5.2.3. Product benchmarking
- 10.5.2.4. Strategic initiatives
- 10.5.3. Quidel Corporation
- 10.5.3.1. Company overview
- 10.5.3.2. Financial performance
- 10.5.3.3. Product benchmarking
- 10.5.3.4. Strategic initiatives
- 10.5.4. BioSure
- 10.5.4.1. Company overview
- 10.5.4.2. Financial performance
- 10.5.4.3. Product benchmarking
- 10.5.4.4. Strategic initiatives
- 10.5.5. F. Hoffmann-La Roche Ltd.
- 10.5.5.1. Company overview
- 10.5.5.2. Financial performance
- 10.5.5.3. Product benchmarking
- 10.5.5.4. Strategic initiatives
- 10.5.6. Nova Biomedical
- 10.5.6.1. Company overview
- 10.5.6.2. Financial performance
- 10.5.6.3. Product benchmarking
- 10.5.6.4. Strategic initiatives
- 10.5.7. Siemens Healthcare GmbH
- 10.5.7.1. Company overview
- 10.5.7.2. Financial performance
- 10.5.7.3. Product benchmarking
- 10.5.7.4. Strategic initiatives
- 10.5.8. ACON Laboratories, Inc.
- 10.5.8.1. Company overview
- 10.5.8.2. Financial performance
- 10.5.8.3. Product benchmarking
- 10.5.8.4. Strategic initiatives
- 10.5.9. OraSure Technologies, Inc.
- 10.5.9.1. Company overview
- 10.5.9.2. Financial performance
- 10.5.9.3. Product benchmarking
- 10.5.9.4. Strategic initiatives
- 10.5.10. Chembio Diagnostics, Inc.
- 10.5.10.1. Company overview
- 10.5.10.2. Financial performance
- 10.5.10.3. Product benchmarking
- 10.5.10.4. Strategic initiatives
- 10.5.1. Abbott

