|
|
市場調査レポート
商品コード
1609602
ジルコニアベース歯科材料の市場規模、シェア、動向分析レポート:製品別、用途別、地域別、セグメント予測、2025年~2030年Zirconia Based Dental Materials Market Size, Share & Trends Analysis Report, By Product (Zirconia Disc, Zirconia Blocks), By Application (Dental Crowns, Dental Bridges), By Region, And Segment Forecasts, 2025 - 2030 |
||||||
|
|||||||
カスタマイズ可能
|
|||||||

| ジルコニアベース歯科材料の市場規模、シェア、動向分析レポート:製品別、用途別、地域別、セグメント予測、2025年~2030年 |
|
出版日: 2024年11月05日
発行: Grand View Research
ページ情報: 英文 140 Pages
納期: 2~10営業日
|

全表示
- 概要
- 図表
- 目次
ジルコニアベース歯科材料市場の成長と動向:
Grand View Research, Inc.の新しいレポートによると、世界のジルコニアベース歯科材料の市場規模は、2025年から2030年にかけて8.5%のCAGRを記録し、2030年までに6億3,960万米ドルに達すると予測されています。
市場成長を促進する要因は、歯科疾患の有病率の上昇、技術の進歩、政府の取り組みです。審美歯科への関心の高まりは、市場拡大に寄与する主要因です。米国歯科医師会(ADA)によると、アメリカ人は2023年に歯科サービスに1,400億米ドル以上を費やすと予測されています。ジルコニアは、半透明性や歯との自然な色合わせといった優れた審美性により、歯科医や患者の間で人気を博しています。このような嗜好の高まりは、個人の選択、ソーシャルメディアの影響、魅力の重要な要素として理想的な笑顔を強調する有名人文化によって後押しされています。
さらに、技術の進歩が市場の成長を後押ししています。例えば、2024年3月、Amann Girrbach社は98mmの製品レンジを発売し、一部のジルコニア、焼結金属、ワックス材料を含む71mmシリーズの廃止につながった。同社は、この移行を支援するため、残りの71mm製品に大幅な割引を提供しています。さらに、Ceramill Motion 1には手頃な価格のアップグレードが、Mikro 4X、Ceramill Motion 2、Mikro 5Xには98mmブランクホルダに対応する適応オプションが用意されています。
さらに、2024年2月、ヒュージデンタルUSAは、単冠から完全なアーチブリッジまで、幅広い歯科用途に合わせた最先端のジルコニアブロックを発表しました。この先進的なブロックは、8層の重ね合わせ構造と15層のグラデーションシステムによる革新的なデザインで、非常に自然な審美性を実現します。43%から57%の透光性レベルと700MPaから1200MPaの強度を提供し、耐久性と見た目の美しさの両方を保証します。
ジルコニアベース歯科材料市場レポートハイライト:
- ジルコニアディスクセグメントは、歯科疾患の有病率の増加と技術の進歩により、2024年には62.2%以上の最大シェアを占めました。ジルコニアディスクは、ジルコニアベース歯科材料の大きなカテゴリの主要コンポーネントであり、主にクラウン、ブリッジ、インプラントアバットメントのような歯科修復物の製造に使用されます。
- 歯冠セグメントは2024年に45.7%以上の最大シェアを占めました。ジルコニアベースの歯冠の成長は、審美歯科に対する需要の増加によって牽引されています。患者は歯の外観をより意識するようになり、機能性と見た目の美しさを提供するソリューションを求めるようになっています。
- 北米は2024年に38.3%のシェアで市場を独占したが、これは歯科疾患の有病率の増加と高齢化社会における歯科処置の需要の高まりによるものです。
目次
第1章 調査手法と範囲
第2章 エグゼクティブサマリー
第3章 ジルコニアベース歯科材料の世界市場の変数、動向、範囲
- 市場系統の見通し
- 親市場の見通し
- 関連/付随市場の見通し
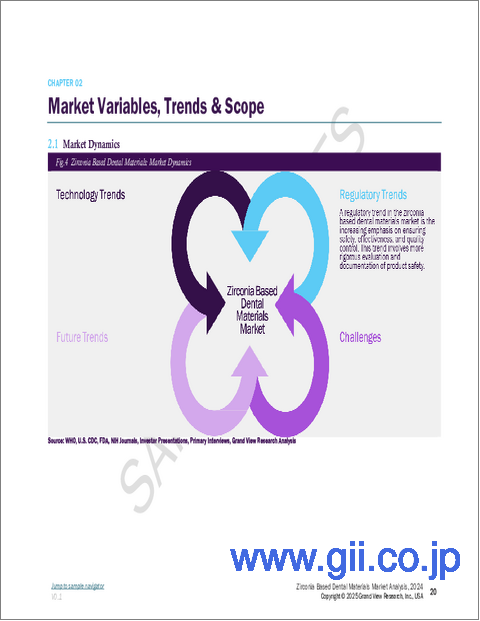
- 市場力学
- 市場牽引要因分析
- 市場抑制要因分析
- ジルコニアベース歯科材料市場分析ツール
- 業界分析- ポーターのファイブフォース分析
- PESTEL分析
第4章 ジルコニアベース歯科材料市場:製品の推定・動向分析
- ジルコニアベース歯科材料市場:製品ダッシュボード
- ジルコニアベース歯科材料市場:製品変動分析
- ジルコニアベース歯科材料市場規模と予測および動向分析、製品別、2018~2030年
- ジルコニアディスク
- ジルコニアブロック
第5章 ジルコニアベース歯科材料市場:用途の推定・動向分析
- ジルコニアベース歯科材料市場:用途ダッシュボード
- ジルコニアベース歯科材料市場:用途変動分析
- ジルコニアベース歯科材料市場規模と予測および動向分析、用途別、2018~2030年
- デンタルクラウン
- デンタルブリッジ
- 義歯
第6章 ジルコニアベース歯科材料市場:製品、用途、地域別の地域別推定・動向分析
- 世界のジルコニアベース歯科材料市場:地域別ダッシュボード
- 市場規模と予測動向分析、2018年から2030年
- 北米
- 米国
- カナダ
- メキシコ
- 欧州
- 英国
- ドイツ
- フランス
- イタリア
- スペイン
- スウェーデン
- ノルウェー
- デンマーク
- アジア太平洋
- 中国
- 日本
- インド
- オーストラリア
- タイ
- 韓国
- ラテンアメリカ
- ブラジル
- アルゼンチン
- 中東・アフリカ
- サウジアラビア
- 南アフリカ
- アラブ首長国連邦
- クウェート
第7章 競合情勢
- 主要メーカーによる最近の動向と影響分析
- 企業/競合の分類
- ベンダー情勢
- 主要販売代理店およびチャネルパートナーのリスト
- Key customers
- Key company market share analysis, 2024
- Ivoclar Vivadent
- Kuraray Noritake Dental, Inc.(Kuraray America, Inc.)
- Argen
- Dentsply Sirona
- B&D Dental Technology
- Henry Schein, Inc.
- VITA North America(VITA Zahnfabrik)
- Dental Direkt
- Pritidenta
- GC Corporation
List of Tables
- Table 1. List of secondary sources
- Table 2. List of abbreviation
- Table 3. Global zirconia based dental materials market, by product, 2018 - 2030 (USD Million)
- Table 4. Global zirconia based dental materials market, by application, 2018 - 2030 (USD Million)
- Table 5. Global zirconia based dental materials market, by region, 2018 - 2030 (USD Million)
- Table 6. North America zirconia based dental materials market, by country, 2018 - 2030 (USD Million)
- Table 7. North America zirconia based dental materials market, by product, 2018 - 2030 (USD Million)
- Table 8. North America zirconia based dental materials market, by application, 2018 - 2030 (USD Million)
- Table 9. U.S. zirconia based dental materials market, by product, 2018 - 2030 (USD Million)
- Table 10. U.S. zirconia based dental materials market, by application, 2018 - 2030 (USD Million)
- Table 11. Canada zirconia based dental materials market, by product, 2018 - 2030 (USD Million)
- Table 12. Canada zirconia based dental materials market, by application, 2018 - 2030 (USD Million)
- Table 13. Mexico zirconia based dental materials market, by product, 2018 - 2030 (USD Million)
- Table 14. Mexico zirconia based dental materials market, by application, 2018 - 2030 (USD Million)
- Table 15. Europe zirconia based dental materials market, by country, 2018 - 2030 (USD Million)
- Table 16. Europe zirconia based dental materials market, by product, 2018 - 2030 (USD Million)
- Table 17. Europe Zirconia Based Dental Materials market, by application, 2018 - 2030 (USD Million)
- Table 18. UK zirconia based dental materials market, by product, 2018 - 2030 (USD Million)
- Table 19. UK zirconia based dental materials market, by application, 2018 - 2030 (USD Million)
- Table 20. Germany zirconia based dental materials market, by product, 2018 - 2030 (USD Million)
- Table 21. Germany zirconia based dental materials market, by application, 2018 - 2030 (USD Million)
- Table 22. France zirconia based dental materials market, by product, 2018 - 2030 (USD Million)
- Table 23. France zirconia based dental materials market, by application, 2018 - 2030 (USD Million)
- Table 24. Italy zirconia based dental materials market, by product, 2018 - 2030 (USD Million)
- Table 25. Italy zirconia based dental materials market, by application, 2018 - 2030 (USD Million)
- Table 26. Spain zirconia based dental materials market, by product, 2018 - 2030 (USD Million)
- Table 27. Spain zirconia based dental materials market, by application, 2018 - 2030 (USD Million)
- Table 28. Denmark zirconia based dental materials market, by product, 2018 - 2030 (USD Million)
- Table 29. Denmark zirconia based dental materials market, by application, 2018 - 2030 (USD Million)
- Table 30. Sweden zirconia based dental materials market, by product, 2018 - 2030 (USD Million)
- Table 31. Sweden zirconia based dental materials market, by application, 2018 - 2030 (USD Million)
- Table 32. Norway zirconia based dental materials market, by product, 2018 - 2030 (USD Million)
- Table 33. Norway zirconia based dental materials market, by application, 2018 - 2030 (USD Million)
- Table 34. Asia Pacific zirconia based dental materials market, by country, 2018 - 2030 (USD Million)
- Table 35. Asia Pacific zirconia based dental materials market, by product, 2018 - 2030 (USD Million)
- Table 36. Asia Pacific zirconia based dental materials market, by application, 2018 - 2030 (USD Million)
- Table 37. Japan zirconia based dental materials market, by product, 2018 - 2030 (USD Million)
- Table 38. Japan zirconia based dental materials market, by application, 2018 - 2030 (USD Million)
- Table 39. China zirconia based dental materials market, by product, 2018 - 2030 (USD Million)
- Table 40. China zirconia based dental materials market, by application, 2018 - 2030 (USD Million)
- Table 41. India zirconia based dental materials market, by product, 2018 - 2030 (USD Million)
- Table 42. India zirconia based dental materials market, by application, 2018 - 2030 (USD Million)
- Table 43. Australia zirconia based dental materials market, by country, 2018 - 2030 (USD Million)
- Table 44. Australia zirconia based dental materials market, by product, 2018 - 2030 (USD Million)
- Table 45. Australia zirconia based dental materials market, by application, 2018 - 2030 (USD Million)
- Table 46. Thailand zirconia based dental materials market, by product, 2018 - 2030 (USD Million)
- Table 47. Thailand zirconia based dental materials market, by application, 2018 - 2030 (USD Million)
- Table 48. South Korea zirconia based dental materials market, by product, 2018 - 2030 (USD Million)
- Table 49. South Korea zirconia based dental materials market, by application, 2018 - 2030 (USD Million)
- Table 50. Latin America zirconia based dental materials market, by country, 2018 - 2030 (USD Million)
- Table 51. Latin America zirconia based dental materials market, by product, 2018 - 2030 (USD Million)
- Table 52. Latin America zirconia based dental materials market, by application, 2018 - 2030 (USD Million)
- Table 53. Brazil zirconia based dental materials market, by product, 2018 - 2030 (USD Million)
- Table 54. Brazil zirconia based dental materials market, by application, 2018 - 2030 (USD Million)
- Table 55. Argentina zirconia based dental materials market, by product, 2018 - 2030 (USD Million)
- Table 56. Argentina zirconia based dental materials market, by application, 2018 - 2030 (USD Million)
- Table 57. MEA zirconia based dental materials market, by country, 2018 - 2030 (USD Million)
- Table 58. MEA zirconia based dental materials market, by product, 2018 - 2030 (USD Million)
- Table 59. MEA zirconia based dental materials market, by application, 2018 - 2030 (USD Million)
- Table 60. South Africa zirconia based dental materials market, by product, 2018 - 2030 (USD Million)
- Table 61. South Africa zirconia based dental materials market, by application, 2018 - 2030 (USD Million)
- Table 62. Saudi Arabia zirconia based dental materials market, by product, 2018 - 2030 (USD Million)
- Table 63. Saudi Arabia zirconia based dental materials market, by application, 2018 - 2030 (USD Million)
- Table 64. UAE zirconia based dental materials market, by product, 2018 - 2030 (USD Million)
- Table 65. UAE zirconia based dental materials market, by application, 2018 - 2030 (USD Million)
- Table 66. Kuwait zirconia based dental materials market, by product, 2018 - 2030 (USD Million)
- Table 67. Kuwait zirconia based dental materials market, by application, 2018 - 2030 (USD Million)
- Table 68. Participant's overview
- Table 69. Financial performance
- Table 70. Key companies undergoing expansions
- Table 71. Key companies undergoing acquisitions
- Table 72. Key companies undergoing collaborations
- Table 73. Key companies launching new product types
- Table 74. Key companies undergoing partnerships
- Table 75. Key companies undertaking other strategies
List of Figures
- Fig. 1 Zirconia based dental materials market segmentation
- Fig. 2 Market research process
- Fig. 3 Information procurement
- Fig. 4 Primary research pattern
- Fig. 5 Market research approaches
- Fig. 6 Value chain-based sizing & forecasting
- Fig. 7 QFD modeling for market share assessment
- Fig. 8 Market formulation & validation
- Fig. 9 Zirconia Based Dental Materials market outlook, 2024 (USD Million)
- Fig. 10 Market Trends & outlook
- Fig. 11 Market driver relevance analysis (Current & future impact)
- Fig. 12 Market restraint relevance analysis (Current & future impact)
- Fig. 13 Zirconia Based Dental Materials product market share analysis, 2024 - 2030 (USD Million)
- Fig. 14 Zirconia Based Dental Materials product market: Segment dashboard
- Fig. 15 Zirconia disc market, 2018 - 2030 (USD Million)
- Fig. 16 Zirconia blocks market, 2018 - 2030 (USD Million)
- Fig. 17 Zirconia Based Dental Materials application market share analysis, 2024 - 2030 (USD Million)
- Fig. 18 Zirconia Based Dental Materials application market: Segment dashboard
- Fig. 19 Dental crowns market, 2018 - 2030 (USD Million)
- Fig. 20 Dental bridges market, 2018 - 2030 (USD Million)
- Fig. 21 Dentures market, 2018 - 2030 (USD Million)
- Fig. 22 Regional marketplace: Key takeaways
- Fig. 23 North America zirconia based dental materials market, 2018 - 2030 (USD Million)
- Fig. 24 U.S. zirconia based dental materials market, 2018 - 2030 (USD Million)
- Fig. 25 Canada zirconia based dental materials market, 2018 - 2030 (USD Million)
- Fig. 26 Mexico zirconia based dental materials market, 2018 - 2030 (USD Million)
- Fig. 27 Europe zirconia based dental materials market, 2018 - 2030 (USD Million)
- Fig. 28 UK zirconia based dental materials market, 2018 - 2030 (USD Million)
- Fig. 29 Germany zirconia based dental materials market, 2018 - 2030 (USD Million)
- Fig. 30 France zirconia based dental materials market, 2018 - 2030 (USD Million)
- Fig. 31 Italy zirconia based dental materials market, 2018 - 2030 (USD Million)
- Fig. 32 Spain zirconia based dental materials market, 2018 - 2030 (USD Million)
- Fig. 33 Denmark zirconia based dental materials market, 2018 - 2030 (USD Million)
- Fig. 34 Sweden zirconia based dental materials market, 2018 - 2030 (USD Million)
- Fig. 35 Norway zirconia based dental materials market, 2018 - 2030 (USD Million)
- Fig. 36 Asia Pacific zirconia based dental materials market, 2018 - 2030 (USD Million)
- Fig. 37 Japan zirconia based dental materials market, 2018 - 2030 (USD Million)
- Fig. 38 China zirconia based dental materials market, 2018 - 2030 (USD Million)
- Fig. 39 India zirconia based dental materials market, 2018 - 2030 (USD Million)
- Fig. 40 Australia zirconia based dental materials market, 2018 - 2030 (USD Million)
- Fig. 41 South Africa zirconia based dental materials market, 2018 - 2030 (USD Million)
- Fig. 42 Thailand zirconia based dental materials market, 2018 - 2030 (USD Million)
- Fig. 43 Latin America zirconia based dental materials market, 2018 - 2030 (USD Million)
- Fig. 44 Brazil zirconia based dental materials market, 2018 - 2030 (USD Million)
- Fig. 45 Argentina zirconia based dental materials market, 2018 - 2030 (USD Million)
- Fig. 46 MEA zirconia based dental materials market, 2018 - 2030 (USD Million)
- Fig. 47 South Africa zirconia based dental materials market, 2018 - 2030 (USD Million)
- Fig. 48 Saudi Arabia zirconia based dental materials market, 2018 - 2030 (USD Million)
- Fig. 49 UAE zirconia based dental materials market, 2018 - 2030 (USD Million)
- Fig. 50 Kuwait zirconia based dental materials market, 2018 - 2030 (USD Million)
- Fig. 51 Strategy framework
Zirconia Based Dental Materials Market Growth & Trends:
The global zirconia based dental materials market size is expected to reach USD 639.6 million by 2030, registering a CAGR of 8.5% from 2025 to 2030, according to a new report by Grand View Research, Inc. The factors driving market growth are the rising prevalence of dental diseases, technological advancements, and government initiatives. The growing interest in aesthetic dentistry is a key factor contributing to the expansion of the market. According to the American Dental Association (ADA), Americans are projected to spend over USD 140 billion on dental services in 2023. Zirconia has gained popularity among dentists and patients due to its outstanding aesthetic qualities, such as translucency and natural color alignment with teeth. This increasing preference is fueled by individual choices, the influence of social media, and celebrity culture, which emphasizes an ideal smile as a key element of attractiveness.
Moreover, technological advancements drive the growth of the market. For instance, in March 2024, Amann Girrbach launched a 98 mm product range, leading to the discontinuation of its 71 mm series, which includes certain zirconia, sintered metal, and wax materials. The company offers substantial discounts on the remaining 71 mm items to support this transition. In addition, affordable upgrades are available for the Ceramill Motion 1 and adaptation options for the Mikro 4X, Ceramill Motion 2, and Mikro 5X milling machines to accommodate the 98 mm blank holder.
In addition, in February 2024, Huge Dental USA introduced a cutting-edge Zirconia block tailored for a wide range of dental applications, from single crowns to complete arch bridges. This advanced block incorporates an innovative design with an 8-layer superimposed structure and a 15-layer gradient system for highly natural aesthetics. It offers translucency levels between 43% and 57% and a strength ranging from 700 MPa to 1200 MPa, ensuring both durability and visual appeal.
Zirconia Based Dental Materials Market Report Highlights:
- The zirconia disc segment held the largest share of over 62.2% in 2024 due to the increasing prevalence of dental diseases and technological advancements. Zirconia discs are a key component of the larger category of zirconia-based dental materials, mainly used to manufacture dental restorations like crowns, bridges, and implant abutments
- The dental crowns segment held the largest share of over 45.7% in 2024. The growth of zirconia-based dental crowns is driven by increasing demand for aesthetic dentistry. Patients are becoming more aware of their dental appearance and seeking solutions that provide functionality and visual appeal
- North America dominated the market with a share of 38.3% in 2024, owing to an increased prevalence of dental diseases and the rising demand for dental procedures among the aging population
Table of Contents
Chapter 1. Methodology and Scope
- 1.1. Market Segmentation & Scope
- 1.2. Segment Definitions
- 1.2.1. Product
- 1.2.2. Application
- 1.2.3. Regional scope
- 1.2.4. Estimates and forecast timeline.
- 1.3. Research Methodology
- 1.4. Information Procurement
- 1.4.1. Purchased database
- 1.4.2. GVR's internal database
- 1.4.3. Secondary sources
- 1.4.4. Primary research
- 1.4.5. Details of primary research
- 1.5. Information or Data Analysis
- 1.5.1. Data analysis models
- 1.6. Market Formulation & Validation
- 1.7. Model Details
- 1.7.1. Commodity price analysis (Model 1)
- 1.7.2. Approach 1: Commodity flow approach
- 1.8. List of Secondary Sources
- 1.9. List of Primary Sources
- 1.10. Objectives
Chapter 2. Executive Summary
- 2.1. Market Outlook
- 2.2. Segment Outlook
- 2.2.1. Product Segment
- 2.2.2. Application Segment
- 2.2.3. Regional Outlook
- 2.3. Competitive Insights
Chapter 3. Global Zirconia Based Dental Materials Market Variables, Trends & Scope
- 3.1. Market Lineage Outlook
- 3.1.1. Parent market outlook
- 3.1.2. Related/ancillary market outlook
- 3.2. Market Dynamics
- 3.2.1. Market driver analysis
- 3.2.1.1. Rising prevalence of dental diseases
- 3.2.1.2. Increased government initiatives
- 3.2.1.3. Growing awareness of dental diseases
- 3.2.1.4. Technological advancements
- 3.2.2. Market restraint analysis
- 3.2.2.1. High Cost Of Zirconia Materials
- 3.2.2.2. Complexity In Handling And Processing
- 3.2.1. Market driver analysis
- 3.3. Zirconia Based Dental Materials Market Analysis Tools
- 3.3.1. Industry Analysis - Porter's
- 3.3.1.1. Supplier power
- 3.3.1.2. Buyer power
- 3.3.1.3. Substitution threat
- 3.3.1.4. Threat of new entrant
- 3.3.1.5. Competitive rivalry
- 3.3.2. PESTEL Analysis
- 3.3.2.1. Political landscape
- 3.3.2.2. Technological landscape
- 3.3.2.3. Economic landscape
- 3.3.1. Industry Analysis - Porter's
Chapter 4. Zirconia Based Dental Materials Market: Product Estimates & Trend Analysis
- 4.1. Zirconia Based Dental Materials Market: Product Dashboard
- 4.2. Zirconia Based Dental Materials Market: Product Movement Analysis
- 4.3. Zirconia Based Dental Materials Market Size & Forecasts and Trend Analysis, by Product, 2018 to 2030 (USD Million)
- 4.4. Zirconia Disc
- 4.4.1. Market estimates and forecast 2018 - 2030 (USD Million)
- 4.5. Zirconia Blocks
- 4.5.1. Market estimates and forecast 2018 - 2030 (USD Million)
Chapter 5. Zirconia Based Dental Materials Market: Application Estimates & Trend Analysis
- 5.1. Zirconia Based Dental Materials Market: Application Dashboard
- 5.2. Zirconia Based Dental Materials Market: Application Movement Analysis
- 5.3. Zirconia Based Dental Materials Market Size & Forecasts and Trend Analysis, by Application, 2018 to 2030 (USD Million)
- 5.4. Dental Crowns
- 5.4.1. Market estimates and forecast 2018 - 2030 (USD Million)
- 5.5. Dental Bridges
- 5.5.1. Market estimates and forecast 2018 - 2030 (USD Million)
- 5.6. Dentures
- 5.6.1. Market estimates and forecast 2018 - 2030 (USD Million)
Chapter 6. Zirconia Based Dental Materials Market: Regional Estimates & Trend Analysis by Product, Application, and Region
- 6.1. Global Zirconia Based Dental Materials Market: Regional Dashboard
- 6.2. Market Size & Forecasts Trend Analysis, 2018 to 2030
- 6.3. North America
- 6.3.1. Market Estimates and Forecasts 2018 - 2030 (USD Million)
- 6.3.2. U.S.
- 6.3.2.1. Key country dynamics
- 6.3.2.2. Regulatory framework/ reimbursement structure
- 6.3.2.3. Competitive scenario
- 6.3.2.4. U.S. market estimates and forecast, 2018 - 2030 (USD Million)
- 6.3.3. Canada
- 6.3.3.1. Key country dynamics
- 6.3.3.2. Regulatory framework/ reimbursement structure
- 6.3.3.3. Competitive scenario
- 6.3.3.4. Canada market estimates and forecast, 2018 - 2030 (USD Million)
- 6.3.4. Mexico
- 6.3.4.1. Key country dynamics
- 6.3.4.2. Regulatory framework/ reimbursement structure
- 6.3.4.3. Competitive scenario
- 6.3.4.4. Mexico market estimates and forecast, 2018 - 2030 (USD Million)
- 6.4. Europe
- 6.4.1. Market Estimates and Forecasts 2018 - 2030 (USD Million)
- 6.4.2. UK
- 6.4.2.1. Key country dynamics
- 6.4.2.2. Regulatory framework/ reimbursement structure
- 6.4.2.3. Competitive scenario
- 6.4.2.4. UK market estimates and forecast, 2018 - 2030 (USD Million)
- 6.4.3. Germany
- 6.4.3.1. Key country dynamics
- 6.4.3.2. Regulatory framework/ reimbursement structure
- 6.4.3.3. Competitive scenario
- 6.4.3.4. Germany market estimates and forecast, 2018 - 2030 (USD Million)
- 6.4.4. France
- 6.4.4.1. Key country dynamics
- 6.4.4.2. Regulatory framework/ reimbursement structure
- 6.4.4.3. Competitive scenario
- 6.4.4.4. France market estimates and forecast, 2018 - 2030 (USD Million)
- 6.4.5. Italy
- 6.4.5.1. Key country dynamics
- 6.4.5.2. Regulatory framework/ reimbursement structure
- 6.4.5.3. Competitive scenario
- 6.4.5.4. Italy market estimates and forecast, 2018 - 2030 (USD Million)
- 6.4.6. Spain
- 6.4.6.1. Key country dynamics
- 6.4.6.2. Regulatory framework/ reimbursement structure
- 6.4.6.3. Competitive scenario
- 6.4.6.4. Spain market estimates and forecast, 2018 - 2030 (USD Million)
- 6.4.7. Sweden
- 6.4.7.1. Key country dynamics
- 6.4.7.2. Regulatory framework/ reimbursement structure
- 6.4.7.3. Competitive scenario
- 6.4.7.4. Sweden market estimates and forecast, 2018 - 2030 (USD Million)
- 6.4.8. Norway
- 6.4.8.1. Key country dynamics
- 6.4.8.2. Regulatory framework/ reimbursement structure
- 6.4.8.3. Competitive scenario
- 6.4.8.4. Norway market estimates and forecast, 2018 - 2030 (USD Million)
- 6.4.9. Denmark
- 6.4.9.1. Key country dynamics
- 6.4.9.2. Regulatory framework/ reimbursement structure
- 6.4.9.3. Competitive scenario
- 6.4.9.4. Denmark market estimates and forecast, 2018 - 2030 (USD Million)
- 6.5. Asia Pacific
- 6.5.1. Market Estimates and Forecasts 2018 - 2030 (USD Million)
- 6.5.2. China
- 6.5.2.1. Key country dynamics
- 6.5.2.2. Regulatory framework/ reimbursement structure
- 6.5.2.3. Competitive scenario
- 6.5.2.4. China market estimates and forecast, 2018 - 2030 (USD Million)
- 6.5.3. Japan
- 6.5.3.1. Key country dynamics
- 6.5.3.2. Regulatory framework/ reimbursement structure
- 6.5.3.3. Competitive scenario
- 6.5.3.4. Japan market estimates and forecast, 2018 - 2030 (USD Million)
- 6.5.4. India
- 6.5.4.1. Key country dynamics
- 6.5.4.2. Regulatory framework/ reimbursement structure
- 6.5.4.3. Competitive scenario
- 6.5.4.4. India market estimates and forecast, 2018 - 2030 (USD Million)
- 6.5.5. Australia
- 6.5.5.1. Key country dynamics
- 6.5.5.2. Regulatory framework/ reimbursement structure
- 6.5.5.3. Competitive scenario
- 6.5.5.4. Australia market estimates and forecast, 2018 - 2030 (USD Million)
- 6.5.6. Thailand
- 6.5.6.1. Key country dynamics
- 6.5.6.2. Regulatory framework/ reimbursement structure
- 6.5.6.3. Competitive scenario
- 6.5.6.4. Thailand market estimates and forecast, 2018 - 2030 (USD Million)
- 6.5.7. South Korea
- 6.5.7.1. Key country dynamics
- 6.5.7.2. Regulatory framework/ reimbursement structure
- 6.5.7.3. Competitive scenario
- 6.5.7.4. South Korea market estimates and forecast, 2018 - 2030 (USD Million)
- 6.6. Latin America
- 6.6.1. Market Estimates and Forecasts 2018 - 2030 (USD Million)
- 6.6.2. Brazil
- 6.6.2.1. Key country dynamics
- 6.6.2.2. Regulatory framework/ reimbursement structure
- 6.6.2.3. Competitive scenario
- 6.6.2.4. Brazil market estimates and forecast, 2018 - 2030 (USD Million)
- 6.6.3. Argentina
- 6.6.3.1. Key country dynamics
- 6.6.3.2. Regulatory framework/ reimbursement structure
- 6.6.3.3. Competitive scenario
- 6.6.3.4. Argentina market estimates and forecast, 2018 - 2030 (USD Million)
- 6.7. MEA
- 6.7.1. Market Estimates and Forecasts 2018 - 2030 (USD Million)
- 6.7.2. Saudi Arabia
- 6.7.2.1. Key country dynamics
- 6.7.2.2. Regulatory framework/ reimbursement structure
- 6.7.2.3. Competitive scenario
- 6.7.2.4. Saudi Arabia market estimates and forecast, 2018 - 2030 (USD Million)
- 6.7.3. South Africa
- 6.7.3.1. Key country dynamics
- 6.7.3.2. Regulatory framework/ reimbursement structure
- 6.7.3.3. Competitive scenario
- 6.7.3.4. South Africa market estimates and forecast, 2018 - 2030 (USD Million)
- 6.7.4. UAE
- 6.7.4.1. Key country dynamics
- 6.7.4.2. Regulatory framework/ reimbursement structure
- 6.7.4.3. Competitive scenario
- 6.7.4.4. UAE market estimates and forecast, 2018 - 2030 (USD Million)
- 6.7.5. Kuwait
- 6.7.5.1. Key country dynamics
- 6.7.5.2. Regulatory framework/ reimbursement structure
- 6.7.5.3. Competitive scenario
- 6.7.5.4. Kuwait market estimates and forecast, 2018 - 2030 (USD Million)
Chapter 7. Competitive Landscape
- 7.1. Recent Developments & Impact Analysis, By Key Manufacturers
- 7.2. Company/Competition Categorization
- 7.3. Vendor Landscape
- 7.3.1. List of key distributors and channel partners
- 7.3.2. Key customers
- 7.3.3. Key company market share analysis, 2024
- 7.3.4. Ivoclar Vivadent
- 7.3.4.1. Company overview
- 7.3.4.2. Financial performance
- 7.3.4.3. Product benchmarking
- 7.3.4.4. Strategic initiatives
- 7.3.5. Kuraray Noritake Dental, Inc. (Kuraray America, Inc.)
- 7.3.5.1. Company overview
- 7.3.5.2. Financial performance
- 7.3.5.3. Product benchmarking
- 7.3.5.4. Strategic initiatives
- 7.3.6. Argen
- 7.3.6.1. Company overview
- 7.3.6.2. Financial performance
- 7.3.6.3. Product benchmarking
- 7.3.6.4. Strategic initiatives
- 7.3.7. Dentsply Sirona
- 7.3.7.1. Company overview
- 7.3.7.2. Financial performance
- 7.3.7.3. Product benchmarking
- 7.3.7.4. Strategic initiatives
- 7.3.8. B&D Dental Technology
- 7.3.8.1. Company overview
- 7.3.8.2. Financial performance
- 7.3.8.3. Product benchmarking
- 7.3.8.4. Strategic initiatives
- 7.3.9. Henry Schein, Inc.
- 7.3.9.1. Company overview
- 7.3.9.2. Financial performance
- 7.3.9.3. Product benchmarking
- 7.3.9.4. Strategic initiatives
- 7.3.10. VITA North America (VITA Zahnfabrik)
- 7.3.10.1. Company overview
- 7.3.10.2. Financial performance
- 7.3.10.3. Product benchmarking
- 7.3.10.4. Strategic initiatives
- 7.3.11. Dental Direkt
- 7.3.11.1. Company overview
- 7.3.11.2. Financial performance
- 7.3.11.3. Product benchmarking
- 7.3.11.4. Strategic initiatives
- 7.3.12. Pritidenta
- 7.3.12.1. Company overview
- 7.3.12.2. Financial performance
- 7.3.12.3. Product benchmarking
- 7.3.12.4. Strategic initiatives
- 7.3.13. GC Corporation
- 7.3.13.1. Company overview
- 7.3.13.2. Financial performance
- 7.3.13.3. Product benchmarking
- 7.3.13.4. Strategic initiatives
