デフォルト表紙
市場調査レポート
商品コード
1718299

歯科用複合材料市場:タイプ別、樹脂タイプ別、硬化タイプ別、用途別、エンドユーザー別、流通チャネル別-2025~2030年世界予測

Dental Composites Market by Type, Resin Type, Curing Type, Application, End User, Distribution Channel - Global Forecast 2025-2030


出版日
発行
360iResearch
ページ情報
英文 199 Pages
納期
即日から翌営業日
カスタマイズ可能
適宜更新あり
価格
価格表記: USDを日本円(税抜)に換算
本日の銀行送金レート: 1USD=148.33円
歯科用複合材料市場:タイプ別、樹脂タイプ別、硬化タイプ別、用途別、エンドユーザー別、流通チャネル別-2025~2030年世界予測
出版日: 2025年04月01日
発行: 360iResearch
ページ情報: 英文 199 Pages
納期: 即日から翌営業日
GIIご利用のメリット
  • 全表示
  • 概要
  • 図表
  • 目次
概要

歯科用複合材料市場は、2024年には8億5,404万米ドルとなり、2025年には9億673万米ドルに成長し、CAGRは6.19%、2030年には12億2,525万米ドルに達すると予測されています。

主要市場の統計
基準年 2024年 8億5,404万米ドル
推定年 2025年 9億673万米ドル
予測年 2030年 12億2,525万米ドル
CAGR(%) 6.19%

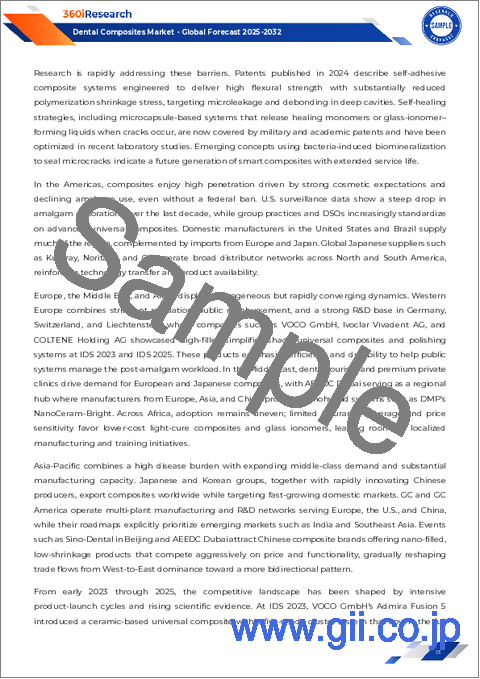
歯科用複合材料は、単純な修復材料から、科学、技術、審美性を融合させた洗練されたソリューションへと進化してきました。歯科市場が変貌を続ける中、高度で高性能な複合材料レジンの必要性はかつてないほど高まっています。本レポートでは、複合材料レジットの現状を変えつつある現在の動向、新たな技術、不可欠な市場力学を詳細に分析しています。化学配合、硬化技術、材料特性における最新の進歩は、歯科専門家に、より耐久性があり審美的に好ましい結果を提供する力を与えています。材料科学と消費者の期待の相互作用により、機能を回復させるだけでなく、全体的な患者体験を向上させる製品への道が開かれました。先進的な研究と臨床実践の融合により、歯科用複合材料産業は、産業標準と患者満足度を再定義する画期的な変化を遂げようとしています。

歯科修復における低侵襲処置と精密さがますます重視されるようになり、高品質の複合材料材料への需要がさらに高まっています。製造プロセスの進化は、規制への配慮とともに、技術革新が優位性を維持するための鍵となる競合環境をもたらしています。この包括的概要では、市場全体の変容を掘り下げ、歯科用複合材料材料の今後の方向性を示す重要な洞察とセグメンテーションデータを抽出しています。

情勢の変化:歯科用複合材料の将来を牽引

近年、歯科用複合材料市場は、修復治療への取り組み方を根本的に変える一連の変革的シフトを経験しています。先端ポリマー科学の統合と硬化技術の向上により、より効果的なだけでなく、特定の臨床用途に合わせた複合材料製品の開発が容易になりました。このような変化は、樹脂化学に対する理解の深まりと革新的な製造技術の採用によるものであり、これらすべてが複合材料の性能と寿命の向上に寄与しています。

市場力学は、技術的進歩によりメーカーが歯科用複合材料の組成と適用方法を最適化できるようになるにつれて進化しています。この技術革新の新しい波は、前歯部と臼歯部の修復における厳しい要求を満たす高性能の配合に重点が置かれていることを特徴としています。粘度が変化し、機械的特性が改善された複合材料レジンの開発により、処置の効率化が加速され、チェアタイムが短縮され、臨床結果が向上しました。さらに、光を利用した先進的硬化メカニズムにより、術後の合併症を最小限に抑えるために不可欠な、より均一な重合プロセスが保証されています。これらの要素が相まって、産業のベンチマークが再定義されるだけでなく、歯科医師が治療の予知性を高め、患者の満足度を向上させることを可能にしています。

研究主導のイノベーションを積極的に採用する産業の姿勢は、耐久性、審美性、マテリアルハンドリングのしやすさに対応する材料の急速な進化に表れています。材料科学と技術への投資の増加により、利害関係者は現在、急速な技術革新と消費者の期待の変化を特徴とする状況において、より有利な立場で競争に臨んでいます。

主要セグメントに関する洞察:多角的な詳細分析

歯科用複合材料市場のセグメンテーションを見ると、製品タイプ、樹脂タイプ、硬化方法、用途、エンドユーザー、流通チャネルが複雑に絡み合っていることがわかる。メーカーは、流動性バルクフィル、流動性複合材料、フルボディバルクフィル、マイクロフィル複合材料、マイクロハイブリッド複合材料、ナノフィル複合材料、ナノハイブリッド複合材料などの分類を含むタイプ別に市場を分析しています。この詳細な分類は、各サブカテゴリーが提供する特殊な機能性と審美的特性を強調し、あらゆる臨床シナリオに適切な複合材料が存在することを保証するものです。

樹脂タイプをさらに深く掘り下げると、ビスフェノールA-グリシジルメタクリレート(Bis-GMA)に明確な重点が置かれており、トリエチレングリコールジメタクリレート(TEGDMA)やウレタンジメタクリレート(UDMA)などの他の樹脂とともに、高粘度と低粘度の両方の配合が検討されています。樹脂化学の差別化により、流動性、強度、硬化挙動などの点でカスタマイズが可能になります。さらに、市場は硬化タイプに基づいて分析され、化学硬化型複合材料と光硬化型複合材料の両方が注目されます。各硬化プロセスは、作業時間と重合一貫性に関して独自の利点を記載しています。

用途による区分では、前歯部と臼歯部の修復を含む直接修復処置、インレー、オンレー、ベニアなどの間接修復法、総義歯と部分義歯を含む補綴用途を取り上げ、さらに視野を広げています。同様に重要なのは、エンドユーザー区分の考察であり、主に歯科学界や研究機関、歯科医院やクリニックに焦点を当て、これらの複合材料が適用される多様な環境を浮き彫りにしています。流通チャネルも同様に多様化しており、歯科販売代理店や卸売業者、直接販売モデル、さらにはeコマースやオンライン流通プラットフォームの役割などを通じて、市場を徹底的に分析しています。この多角的なセグメンテーションにより、歯科用複合材料の戦略的な展開には、材料組成から用途、流通に至るまで、様々な要素を総合的に考慮する必要があることが明らかになりました。

目次

第1章 序文

第2章 調査手法

第3章 エグゼクティブサマリー

第4章 市場概要

第5章 市場洞察

  • 市場力学
    • 促進要因
      • 虫歯の増加により、先進的治療の必要性が高まっている
      • 消費者の審美歯科への関心の高まりにより、審美性に優れた複合材料の需要が高まっている
    • 抑制要因
      • 歯科用複合ソリューションの高コストと原料の変動が採用率に影響
    • 機会
      • 歯科修復の性能を向上させる複合樹脂技術の進歩
      • 先進的歯科治療のための歯科サービスとインフラの拡大
    • 課題
      • 歯科用複合材料の耐久性と美観に関する懸念
  • 市場セグメンテーション分析
    • タイプ:修復歯科と審美歯科における流動性複合材料材の採用増加
    • 樹脂タイプ:歯科修復物の耐久性を確保するためにビスGMAの需要が増加
    • 硬化タイプ:深部修復のため光の浸透が制限される部位に化学硬化型複合材料材を使用
    • 用途:自然な前歯の外観を模倣する前歯修復の好まれ方が増えている
    • エンドユーザー:患者ケアを向上させるために歯科医院で複合技術の進歩が進む
    • 流通チャネル:歯科用複合材料のオンライン配信プラットフォームへの移行が増加
  • ポーターのファイブフォース分析
  • PESTEL分析
    • 政治
    • 経済
    • 社会
    • 技術
    • 法律
    • 環境

第6章 歯科用複合材料市場:タイプ別

  • イントロダクション
  • 流動性バルクフィル
  • 流動性複合材料
  • フルボディバルクフィル
  • マイクロフィル複合材
  • マイクロハイブリッド複合材
  • ナノフィル複合材
  • ナノハイブリッド複合材料

第7章 歯科用複合材料市場:樹脂タイプ別

  • イントロダクション
  • ビスフェノールA-グリシジルメタクリレート(ビス-GMA)
    • 高粘度ビスGMA
    • 低粘度ビスGMA
  • トリエチレングリコールジメタクリレート(TEGDMA)
  • ウレタンジメタクリレート(UDMA)

第8章 歯科用複合材料市場:硬化タイプ別

  • イントロダクション
  • 化学硬化型複合材料
  • 光硬化型複合材料

第9章 歯科用複合材料市場:用途別

  • イントロダクション
  • 直接修復
    • 前歯の修復
    • 臼歯修復
  • 間接修復
    • インレイ
    • オンレイ
    • ベニア
  • 義肢
    • 総義歯
    • 部分入れ歯

第10章 歯科用複合材料市場:エンドユーザー別

  • イントロダクション
  • 歯科大学・研究機関
  • 歯科医院クリニック

第11章 歯科用複合材料市場:流通チャネル別

  • イントロダクション
  • 歯科販売業者と卸売業者
  • 直接販売
  • eコマース/オンライン配信プラットフォーム

第12章 南北アメリカの歯科用複合材料市場

  • イントロダクション
  • アルゼンチン
  • ブラジル
  • カナダ
  • メキシコ
  • 米国

第13章 アジア太平洋の歯科用複合材料市場

  • イントロダクション
  • オーストラリア
  • 中国
  • インド
  • インドネシア
  • 日本
  • マレーシア
  • フィリピン
  • シンガポール
  • 韓国
  • 台湾
  • タイ
  • ベトナム

第14章 欧州・中東・アフリカの歯科用複合材料市場

  • イントロダクション
  • デンマーク
  • エジプト
  • フィンランド
  • フランス
  • ドイツ
  • イスラエル
  • イタリア
  • オランダ
  • ナイジェリア
  • ノルウェー
  • ポーランド
  • カタール
  • ロシア
  • サウジアラビア
  • 南アフリカ
  • スペイン
  • スウェーデン
  • スイス
  • トルコ
  • アラブ首長国連邦
  • 英国

第15章 競合情勢

  • 市場シェア分析、2024年
  • FPNVポジショニングマトリックス、2024年
  • 競合シナリオ分析
  • 戦略分析と提言

企業一覧

  • 3M Company
  • Bioloren S.r.l.
  • BISCO, Inc. by EACO Corp.
  • Coltene Group
  • Cosmedent, Inc.
  • Den-Mat Holdings, LLC
  • Dentsply Sirona Inc.
  • DMG Chemisch-Pharmazeutische Fabrik GmbH
  • FGM Dental Group.
  • GC Corporation
  • Ivoclar Vivadent AG
  • J. MORITA CORP
  • Kerr Corporation by Envista Holdings Corporation
  • Kettenbach SNC
  • Kulzer GmbH by Mitsui Chemicals, Inc
  • Kuraray Noritake Dental Inc.
  • Parkell, Inc. by Directa Dental Group
  • Pulpdent Corporation
  • Rident Denpro Pvt Ltd
  • SDI Limited
  • Septodont Holding
  • SHOFU Dental GmbH
  • Tokuyama Dental Corporation
  • Ultradent Products, Inc.
  • VOCO GmbH
図表

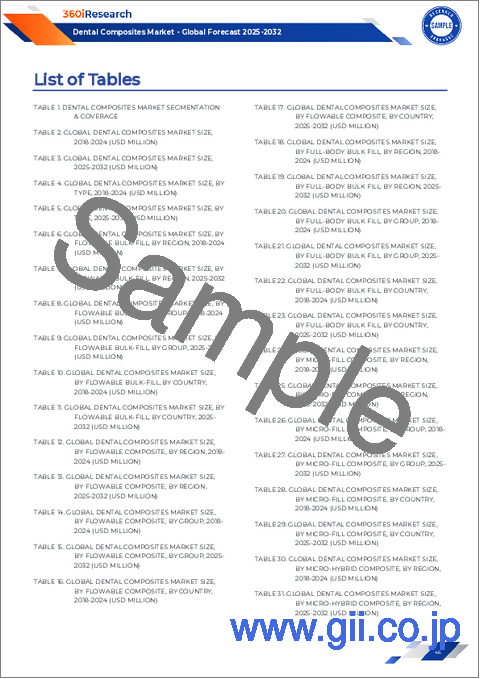
LIST OF FIGURES

  • FIGURE 1. DENTAL COMPOSITES MARKET MULTI-CURRENCY
  • FIGURE 2. DENTAL COMPOSITES MARKET MULTI-LANGUAGE
  • FIGURE 3. DENTAL COMPOSITES MARKET RESEARCH PROCESS
  • FIGURE 4. DENTAL COMPOSITES MARKET SIZE, 2024 VS 2030
  • FIGURE 5. GLOBAL DENTAL COMPOSITES MARKET SIZE, 2018-2030 (USD MILLION)
  • FIGURE 6. GLOBAL DENTAL COMPOSITES MARKET SIZE, BY REGION, 2024 VS 2025 VS 2030 (USD MILLION)
  • FIGURE 7. GLOBAL DENTAL COMPOSITES MARKET SIZE, BY COUNTRY, 2024 VS 2025 VS 2030 (USD MILLION)
  • FIGURE 8. GLOBAL DENTAL COMPOSITES MARKET SIZE, BY TYPE, 2024 VS 2030 (%)
  • FIGURE 9. GLOBAL DENTAL COMPOSITES MARKET SIZE, BY TYPE, 2024 VS 2025 VS 2030 (USD MILLION)
  • FIGURE 10. GLOBAL DENTAL COMPOSITES MARKET SIZE, BY RESIN TYPE, 2024 VS 2030 (%)
  • FIGURE 11. GLOBAL DENTAL COMPOSITES MARKET SIZE, BY RESIN TYPE, 2024 VS 2025 VS 2030 (USD MILLION)
  • FIGURE 12. GLOBAL DENTAL COMPOSITES MARKET SIZE, BY CURING TYPE, 2024 VS 2030 (%)
  • FIGURE 13. GLOBAL DENTAL COMPOSITES MARKET SIZE, BY CURING TYPE, 2024 VS 2025 VS 2030 (USD MILLION)
  • FIGURE 14. GLOBAL DENTAL COMPOSITES MARKET SIZE, BY APPLICATION, 2024 VS 2030 (%)
  • FIGURE 15. GLOBAL DENTAL COMPOSITES MARKET SIZE, BY APPLICATION, 2024 VS 2025 VS 2030 (USD MILLION)
  • FIGURE 16. GLOBAL DENTAL COMPOSITES MARKET SIZE, BY END USER, 2024 VS 2030 (%)
  • FIGURE 17. GLOBAL DENTAL COMPOSITES MARKET SIZE, BY END USER, 2024 VS 2025 VS 2030 (USD MILLION)
  • FIGURE 18. GLOBAL DENTAL COMPOSITES MARKET SIZE, BY DISTRIBUTION CHANNEL, 2024 VS 2030 (%)
  • FIGURE 19. GLOBAL DENTAL COMPOSITES MARKET SIZE, BY DISTRIBUTION CHANNEL, 2024 VS 2025 VS 2030 (USD MILLION)
  • FIGURE 20. AMERICAS DENTAL COMPOSITES MARKET SIZE, BY COUNTRY, 2024 VS 2030 (%)
  • FIGURE 21. AMERICAS DENTAL COMPOSITES MARKET SIZE, BY COUNTRY, 2024 VS 2025 VS 2030 (USD MILLION)
  • FIGURE 22. UNITED STATES DENTAL COMPOSITES MARKET SIZE, BY STATE, 2024 VS 2030 (%)
  • FIGURE 23. UNITED STATES DENTAL COMPOSITES MARKET SIZE, BY STATE, 2024 VS 2025 VS 2030 (USD MILLION)
  • FIGURE 24. ASIA-PACIFIC DENTAL COMPOSITES MARKET SIZE, BY COUNTRY, 2024 VS 2030 (%)
  • FIGURE 25. ASIA-PACIFIC DENTAL COMPOSITES MARKET SIZE, BY COUNTRY, 2024 VS 2025 VS 2030 (USD MILLION)
  • FIGURE 26. EUROPE, MIDDLE EAST & AFRICA DENTAL COMPOSITES MARKET SIZE, BY COUNTRY, 2024 VS 2030 (%)
  • FIGURE 27. EUROPE, MIDDLE EAST & AFRICA DENTAL COMPOSITES MARKET SIZE, BY COUNTRY, 2024 VS 2025 VS 2030 (USD MILLION)
  • FIGURE 28. DENTAL COMPOSITES MARKET SHARE, BY KEY PLAYER, 2024
  • FIGURE 29. DENTAL COMPOSITES MARKET, FPNV POSITIONING MATRIX, 2024

LIST OF TABLES

  • TABLE 1. DENTAL COMPOSITES MARKET SEGMENTATION & COVERAGE
  • TABLE 2. UNITED STATES DOLLAR EXCHANGE RATE, 2018-2024
  • TABLE 3. GLOBAL DENTAL COMPOSITES MARKET SIZE, 2018-2030 (USD MILLION)
  • TABLE 4. GLOBAL DENTAL COMPOSITES MARKET SIZE, BY REGION, 2018-2030 (USD MILLION)
  • TABLE 5. GLOBAL DENTAL COMPOSITES MARKET SIZE, BY COUNTRY, 2018-2030 (USD MILLION)
  • TABLE 6. DENTAL COMPOSITES MARKET DYNAMICS
  • TABLE 7. GLOBAL DENTAL COMPOSITES MARKET SIZE, BY TYPE, 2018-2030 (USD MILLION)
  • TABLE 8. GLOBAL DENTAL COMPOSITES MARKET SIZE, BY FLOWABLE BULK-FILL, BY REGION, 2018-2030 (USD MILLION)
  • TABLE 9. GLOBAL DENTAL COMPOSITES MARKET SIZE, BY FLOWABLE COMPOSITE, BY REGION, 2018-2030 (USD MILLION)
  • TABLE 10. GLOBAL DENTAL COMPOSITES MARKET SIZE, BY FULL-BODY BULK FILL, BY REGION, 2018-2030 (USD MILLION)
  • TABLE 11. GLOBAL DENTAL COMPOSITES MARKET SIZE, BY MICRO-FILL COMPOSITE, BY REGION, 2018-2030 (USD MILLION)
  • TABLE 12. GLOBAL DENTAL COMPOSITES MARKET SIZE, BY MICRO-HYBRID COMPOSITE, BY REGION, 2018-2030 (USD MILLION)
  • TABLE 13. GLOBAL DENTAL COMPOSITES MARKET SIZE, BY NANO-FILL COMPOSITE, BY REGION, 2018-2030 (USD MILLION)
  • TABLE 14. GLOBAL DENTAL COMPOSITES MARKET SIZE, BY NANO-HYBRID COMPOSITE, BY REGION, 2018-2030 (USD MILLION)
  • TABLE 15. GLOBAL DENTAL COMPOSITES MARKET SIZE, BY RESIN TYPE, 2018-2030 (USD MILLION)
  • TABLE 16. GLOBAL DENTAL COMPOSITES MARKET SIZE, BY BISPHENOL A-GLYCIDYL METHACRYLATE (BIS-GMA), BY REGION, 2018-2030 (USD MILLION)
  • TABLE 17. GLOBAL DENTAL COMPOSITES MARKET SIZE, BY HIGH VISCOSITY BIS-GMA, BY REGION, 2018-2030 (USD MILLION)
  • TABLE 18. GLOBAL DENTAL COMPOSITES MARKET SIZE, BY LOW VISCOSITY BIS-GMA, BY REGION, 2018-2030 (USD MILLION)
  • TABLE 19. GLOBAL DENTAL COMPOSITES MARKET SIZE, BY BISPHENOL A-GLYCIDYL METHACRYLATE (BIS-GMA), 2018-2030 (USD MILLION)
  • TABLE 20. GLOBAL DENTAL COMPOSITES MARKET SIZE, BY TRIETHYLENE GLYCOL DIMETHACRYLATE (TEGDMA), BY REGION, 2018-2030 (USD MILLION)
  • TABLE 21. GLOBAL DENTAL COMPOSITES MARKET SIZE, BY URETHANE DIMETHACRYLATE (UDMA), BY REGION, 2018-2030 (USD MILLION)
  • TABLE 22. GLOBAL DENTAL COMPOSITES MARKET SIZE, BY CURING TYPE, 2018-2030 (USD MILLION)
  • TABLE 23. GLOBAL DENTAL COMPOSITES MARKET SIZE, BY CHEMICAL-CURED COMPOSITES, BY REGION, 2018-2030 (USD MILLION)
  • TABLE 24. GLOBAL DENTAL COMPOSITES MARKET SIZE, BY LIGHT-CURED COMPOSITES, BY REGION, 2018-2030 (USD MILLION)
  • TABLE 25. GLOBAL DENTAL COMPOSITES MARKET SIZE, BY APPLICATION, 2018-2030 (USD MILLION)
  • TABLE 26. GLOBAL DENTAL COMPOSITES MARKET SIZE, BY DIRECT RESTORATIVE, BY REGION, 2018-2030 (USD MILLION)
  • TABLE 27. GLOBAL DENTAL COMPOSITES MARKET SIZE, BY ANTERIOR RESTORATIONS, BY REGION, 2018-2030 (USD MILLION)
  • TABLE 28. GLOBAL DENTAL COMPOSITES MARKET SIZE, BY POSTERIOR RESTORATIONS, BY REGION, 2018-2030 (USD MILLION)
  • TABLE 29. GLOBAL DENTAL COMPOSITES MARKET SIZE, BY DIRECT RESTORATIVE, 2018-2030 (USD MILLION)
  • TABLE 30. GLOBAL DENTAL COMPOSITES MARKET SIZE, BY INDIRECT RESTORATIVE, BY REGION, 2018-2030 (USD MILLION)
  • TABLE 31. GLOBAL DENTAL COMPOSITES MARKET SIZE, BY INLAYS, BY REGION, 2018-2030 (USD MILLION)
  • TABLE 32. GLOBAL DENTAL COMPOSITES MARKET SIZE, BY ONLAYS, BY REGION, 2018-2030 (USD MILLION)
  • TABLE 33. GLOBAL DENTAL COMPOSITES MARKET SIZE, BY VENEERS, BY REGION, 2018-2030 (USD MILLION)
  • TABLE 34. GLOBAL DENTAL COMPOSITES MARKET SIZE, BY INDIRECT RESTORATIVE, 2018-2030 (USD MILLION)
  • TABLE 35. GLOBAL DENTAL COMPOSITES MARKET SIZE, BY PROSTHETICS, BY REGION, 2018-2030 (USD MILLION)
  • TABLE 36. GLOBAL DENTAL COMPOSITES MARKET SIZE, BY COMPLETE DENTURES, BY REGION, 2018-2030 (USD MILLION)
  • TABLE 37. GLOBAL DENTAL COMPOSITES MARKET SIZE, BY PARTIAL DENTURES, BY REGION, 2018-2030 (USD MILLION)
  • TABLE 38. GLOBAL DENTAL COMPOSITES MARKET SIZE, BY PROSTHETICS, 2018-2030 (USD MILLION)
  • TABLE 39. GLOBAL DENTAL COMPOSITES MARKET SIZE, BY END USER, 2018-2030 (USD MILLION)
  • TABLE 40. GLOBAL DENTAL COMPOSITES MARKET SIZE, BY DENTAL ACADEMICS & RESEARCH INSTITUTIONS, BY REGION, 2018-2030 (USD MILLION)
  • TABLE 41. GLOBAL DENTAL COMPOSITES MARKET SIZE, BY DENTAL CLINICS & PRACTICES, BY REGION, 2018-2030 (USD MILLION)
  • TABLE 42. GLOBAL DENTAL COMPOSITES MARKET SIZE, BY DISTRIBUTION CHANNEL, 2018-2030 (USD MILLION)
  • TABLE 43. GLOBAL DENTAL COMPOSITES MARKET SIZE, BY DENTAL DISTRIBUTORS & WHOLESALERS, BY REGION, 2018-2030 (USD MILLION)
  • TABLE 44. GLOBAL DENTAL COMPOSITES MARKET SIZE, BY DIRECT SALES, BY REGION, 2018-2030 (USD MILLION)
  • TABLE 45. GLOBAL DENTAL COMPOSITES MARKET SIZE, BY E-COMMERCE/ONLINE DISTRIBUTION PLATFORMS, BY REGION, 2018-2030 (USD MILLION)
  • TABLE 46. AMERICAS DENTAL COMPOSITES MARKET SIZE, BY TYPE, 2018-2030 (USD MILLION)
  • TABLE 47. AMERICAS DENTAL COMPOSITES MARKET SIZE, BY RESIN TYPE, 2018-2030 (USD MILLION)
  • TABLE 48. AMERICAS DENTAL COMPOSITES MARKET SIZE, BY BISPHENOL A-GLYCIDYL METHACRYLATE (BIS-GMA), 2018-2030 (USD MILLION)
  • TABLE 49. AMERICAS DENTAL COMPOSITES MARKET SIZE, BY CURING TYPE, 2018-2030 (USD MILLION)
  • TABLE 50. AMERICAS DENTAL COMPOSITES MARKET SIZE, BY APPLICATION, 2018-2030 (USD MILLION)
  • TABLE 51. AMERICAS DENTAL COMPOSITES MARKET SIZE, BY DIRECT RESTORATIVE, 2018-2030 (USD MILLION)
  • TABLE 52. AMERICAS DENTAL COMPOSITES MARKET SIZE, BY INDIRECT RESTORATIVE, 2018-2030 (USD MILLION)
  • TABLE 53. AMERICAS DENTAL COMPOSITES MARKET SIZE, BY PROSTHETICS, 2018-2030 (USD MILLION)
  • TABLE 54. AMERICAS DENTAL COMPOSITES MARKET SIZE, BY END USER, 2018-2030 (USD MILLION)
  • TABLE 55. AMERICAS DENTAL COMPOSITES MARKET SIZE, BY DISTRIBUTION CHANNEL, 2018-2030 (USD MILLION)
  • TABLE 56. AMERICAS DENTAL COMPOSITES MARKET SIZE, BY COUNTRY, 2018-2030 (USD MILLION)
  • TABLE 57. ARGENTINA DENTAL COMPOSITES MARKET SIZE, BY TYPE, 2018-2030 (USD MILLION)
  • TABLE 58. ARGENTINA DENTAL COMPOSITES MARKET SIZE, BY RESIN TYPE, 2018-2030 (USD MILLION)
  • TABLE 59. ARGENTINA DENTAL COMPOSITES MARKET SIZE, BY BISPHENOL A-GLYCIDYL METHACRYLATE (BIS-GMA), 2018-2030 (USD MILLION)
  • TABLE 60. ARGENTINA DENTAL COMPOSITES MARKET SIZE, BY CURING TYPE, 2018-2030 (USD MILLION)
  • TABLE 61. ARGENTINA DENTAL COMPOSITES MARKET SIZE, BY APPLICATION, 2018-2030 (USD MILLION)
  • TABLE 62. ARGENTINA DENTAL COMPOSITES MARKET SIZE, BY DIRECT RESTORATIVE, 2018-2030 (USD MILLION)
  • TABLE 63. ARGENTINA DENTAL COMPOSITES MARKET SIZE, BY INDIRECT RESTORATIVE, 2018-2030 (USD MILLION)
  • TABLE 64. ARGENTINA DENTAL COMPOSITES MARKET SIZE, BY PROSTHETICS, 2018-2030 (USD MILLION)
  • TABLE 65. ARGENTINA DENTAL COMPOSITES MARKET SIZE, BY END USER, 2018-2030 (USD MILLION)
  • TABLE 66. ARGENTINA DENTAL COMPOSITES MARKET SIZE, BY DISTRIBUTION CHANNEL, 2018-2030 (USD MILLION)
  • TABLE 67. BRAZIL DENTAL COMPOSITES MARKET SIZE, BY TYPE, 2018-2030 (USD MILLION)
  • TABLE 68. BRAZIL DENTAL COMPOSITES MARKET SIZE, BY RESIN TYPE, 2018-2030 (USD MILLION)
  • TABLE 69. BRAZIL DENTAL COMPOSITES MARKET SIZE, BY BISPHENOL A-GLYCIDYL METHACRYLATE (BIS-GMA), 2018-2030 (USD MILLION)
  • TABLE 70. BRAZIL DENTAL COMPOSITES MARKET SIZE, BY CURING TYPE, 2018-2030 (USD MILLION)
  • TABLE 71. BRAZIL DENTAL COMPOSITES MARKET SIZE, BY APPLICATION, 2018-2030 (USD MILLION)
  • TABLE 72. BRAZIL DENTAL COMPOSITES MARKET SIZE, BY DIRECT RESTORATIVE, 2018-2030 (USD MILLION)
  • TABLE 73. BRAZIL DENTAL COMPOSITES MARKET SIZE, BY INDIRECT RESTORATIVE, 2018-2030 (USD MILLION)
  • TABLE 74. BRAZIL DENTAL COMPOSITES MARKET SIZE, BY PROSTHETICS, 2018-2030 (USD MILLION)
  • TABLE 75. BRAZIL DENTAL COMPOSITES MARKET SIZE, BY END USER, 2018-2030 (USD MILLION)
  • TABLE 76. BRAZIL DENTAL COMPOSITES MARKET SIZE, BY DISTRIBUTION CHANNEL, 2018-2030 (USD MILLION)
  • TABLE 77. CANADA DENTAL COMPOSITES MARKET SIZE, BY TYPE, 2018-2030 (USD MILLION)
  • TABLE 78. CANADA DENTAL COMPOSITES MARKET SIZE, BY RESIN TYPE, 2018-2030 (USD MILLION)
  • TABLE 79. CANADA DENTAL COMPOSITES MARKET SIZE, BY BISPHENOL A-GLYCIDYL METHACRYLATE (BIS-GMA), 2018-2030 (USD MILLION)
  • TABLE 80. CANADA DENTAL COMPOSITES MARKET SIZE, BY CURING TYPE, 2018-2030 (USD MILLION)
  • TABLE 81. CANADA DENTAL COMPOSITES MARKET SIZE, BY APPLICATION, 2018-2030 (USD MILLION)
  • TABLE 82. CANADA DENTAL COMPOSITES MARKET SIZE, BY DIRECT RESTORATIVE, 2018-2030 (USD MILLION)
  • TABLE 83. CANADA DENTAL COMPOSITES MARKET SIZE, BY INDIRECT RESTORATIVE, 2018-2030 (USD MILLION)
  • TABLE 84. CANADA DENTAL COMPOSITES MARKET SIZE, BY PROSTHETICS, 2018-2030 (USD MILLION)
  • TABLE 85. CANADA DENTAL COMPOSITES MARKET SIZE, BY END USER, 2018-2030 (USD MILLION)
  • TABLE 86. CANADA DENTAL COMPOSITES MARKET SIZE, BY DISTRIBUTION CHANNEL, 2018-2030 (USD MILLION)
  • TABLE 87. MEXICO DENTAL COMPOSITES MARKET SIZE, BY TYPE, 2018-2030 (USD MILLION)
  • TABLE 88. MEXICO DENTAL COMPOSITES MARKET SIZE, BY RESIN TYPE, 2018-2030 (USD MILLION)
  • TABLE 89. MEXICO DENTAL COMPOSITES MARKET SIZE, BY BISPHENOL A-GLYCIDYL METHACRYLATE (BIS-GMA), 2018-2030 (USD MILLION)
  • TABLE 90. MEXICO DENTAL COMPOSITES MARKET SIZE, BY CURING TYPE, 2018-2030 (USD MILLION)
  • TABLE 91. MEXICO DENTAL COMPOSITES MARKET SIZE, BY APPLICATION, 2018-2030 (USD MILLION)
  • TABLE 92. MEXICO DENTAL COMPOSITES MARKET SIZE, BY DIRECT RESTORATIVE, 2018-2030 (USD MILLION)
  • TABLE 93. MEXICO DENTAL COMPOSITES MARKET SIZE, BY INDIRECT RESTORATIVE, 2018-2030 (USD MILLION)
  • TABLE 94. MEXICO DENTAL COMPOSITES MARKET SIZE, BY PROSTHETICS, 2018-2030 (USD MILLION)
  • TABLE 95. MEXICO DENTAL COMPOSITES MARKET SIZE, BY END USER, 2018-2030 (USD MILLION)
  • TABLE 96. MEXICO DENTAL COMPOSITES MARKET SIZE, BY DISTRIBUTION CHANNEL, 2018-2030 (USD MILLION)
  • TABLE 97. UNITED STATES DENTAL COMPOSITES MARKET SIZE, BY TYPE, 2018-2030 (USD MILLION)
  • TABLE 98. UNITED STATES DENTAL COMPOSITES MARKET SIZE, BY RESIN TYPE, 2018-2030 (USD MILLION)
  • TABLE 99. UNITED STATES DENTAL COMPOSITES MARKET SIZE, BY BISPHENOL A-GLYCIDYL METHACRYLATE (BIS-GMA), 2018-2030 (USD MILLION)
  • TABLE 100. UNITED STATES DENTAL COMPOSITES MARKET SIZE, BY CURING TYPE, 2018-2030 (USD MILLION)
  • TABLE 101. UNITED STATES DENTAL COMPOSITES MARKET SIZE, BY APPLICATION, 2018-2030 (USD MILLION)
  • TABLE 102. UNITED STATES DENTAL COMPOSITES MARKET SIZE, BY DIRECT RESTORATIVE, 2018-2030 (USD MILLION)
  • TABLE 103. UNITED STATES DENTAL COMPOSITES MARKET SIZE, BY INDIRECT RESTORATIVE, 2018-2030 (USD MILLION)
  • TABLE 104. UNITED STATES DENTAL COMPOSITES MARKET SIZE, BY PROSTHETICS, 2018-2030 (USD MILLION)
  • TABLE 105. UNITED STATES DENTAL COMPOSITES MARKET SIZE, BY END USER, 2018-2030 (USD MILLION)
  • TABLE 106. UNITED STATES DENTAL COMPOSITES MARKET SIZE, BY DISTRIBUTION CHANNEL, 2018-2030 (USD MILLION)
  • TABLE 107. UNITED STATES DENTAL COMPOSITES MARKET SIZE, BY STATE, 2018-2030 (USD MILLION)
  • TABLE 108. ASIA-PACIFIC DENTAL COMPOSITES MARKET SIZE, BY TYPE, 2018-2030 (USD MILLION)
  • TABLE 109. ASIA-PACIFIC DENTAL COMPOSITES MARKET SIZE, BY RESIN TYPE, 2018-2030 (USD MILLION)
  • TABLE 110. ASIA-PACIFIC DENTAL COMPOSITES MARKET SIZE, BY BISPHENOL A-GLYCIDYL METHACRYLATE (BIS-GMA), 2018-2030 (USD MILLION)
  • TABLE 111. ASIA-PACIFIC DENTAL COMPOSITES MARKET SIZE, BY CURING TYPE, 2018-2030 (USD MILLION)
  • TABLE 112. ASIA-PACIFIC DENTAL COMPOSITES MARKET SIZE, BY APPLICATION, 2018-2030 (USD MILLION)
  • TABLE 113. ASIA-PACIFIC DENTAL COMPOSITES MARKET SIZE, BY DIRECT RESTORATIVE, 2018-2030 (USD MILLION)
  • TABLE 114. ASIA-PACIFIC DENTAL COMPOSITES MARKET SIZE, BY INDIRECT RESTORATIVE, 2018-2030 (USD MILLION)
  • TABLE 115. ASIA-PACIFIC DENTAL COMPOSITES MARKET SIZE, BY PROSTHETICS, 2018-2030 (USD MILLION)
  • TABLE 116. ASIA-PACIFIC DENTAL COMPOSITES MARKET SIZE, BY END USER, 2018-2030 (USD MILLION)
  • TABLE 117. ASIA-PACIFIC DENTAL COMPOSITES MARKET SIZE, BY DISTRIBUTION CHANNEL, 2018-2030 (USD MILLION)
  • TABLE 118. ASIA-PACIFIC DENTAL COMPOSITES MARKET SIZE, BY COUNTRY, 2018-2030 (USD MILLION)
  • TABLE 119. AUSTRALIA DENTAL COMPOSITES MARKET SIZE, BY TYPE, 2018-2030 (USD MILLION)
  • TABLE 120. AUSTRALIA DENTAL COMPOSITES MARKET SIZE, BY RESIN TYPE, 2018-2030 (USD MILLION)
  • TABLE 121. AUSTRALIA DENTAL COMPOSITES MARKET SIZE, BY BISPHENOL A-GLYCIDYL METHACRYLATE (BIS-GMA), 2018-2030 (USD MILLION)
  • TABLE 122. AUSTRALIA DENTAL COMPOSITES MARKET SIZE, BY CURING TYPE, 2018-2030 (USD MILLION)
  • TABLE 123. AUSTRALIA DENTAL COMPOSITES MARKET SIZE, BY APPLICATION, 2018-2030 (USD MILLION)
  • TABLE 124. AUSTRALIA DENTAL COMPOSITES MARKET SIZE, BY DIRECT RESTORATIVE, 2018-2030 (USD MILLION)
  • TABLE 125. AUSTRALIA DENTAL COMPOSITES MARKET SIZE, BY INDIRECT RESTORATIVE, 2018-2030 (USD MILLION)
  • TABLE 126. AUSTRALIA DENTAL COMPOSITES MARKET SIZE, BY PROSTHETICS, 2018-2030 (USD MILLION)
  • TABLE 127. AUSTRALIA DENTAL COMPOSITES MARKET SIZE, BY END USER, 2018-2030 (USD MILLION)
  • TABLE 128. AUSTRALIA DENTAL COMPOSITES MARKET SIZE, BY DISTRIBUTION CHANNEL, 2018-2030 (USD MILLION)
  • TABLE 129. CHINA DENTAL COMPOSITES MARKET SIZE, BY TYPE, 2018-2030 (USD MILLION)
  • TABLE 130. CHINA DENTAL COMPOSITES MARKET SIZE, BY RESIN TYPE, 2018-2030 (USD MILLION)
  • TABLE 131. CHINA DENTAL COMPOSITES MARKET SIZE, BY BISPHENOL A-GLYCIDYL METHACRYLATE (BIS-GMA), 2018-2030 (USD MILLION)
  • TABLE 132. CHINA DENTAL COMPOSITES MARKET SIZE, BY CURING TYPE, 2018-2030 (USD MILLION)
  • TABLE 133. CHINA DENTAL COMPOSITES MARKET SIZE, BY APPLICATION, 2018-2030 (USD MILLION)
  • TABLE 134. CHINA DENTAL COMPOSITES MARKET SIZE, BY DIRECT RESTORATIVE, 2018-2030 (USD MILLION)
  • TABLE 135. CHINA DENTAL COMPOSITES MARKET SIZE, BY INDIRECT RESTORATIVE, 2018-2030 (USD MILLION)
  • TABLE 136. CHINA DENTAL COMPOSITES MARKET SIZE, BY PROSTHETICS, 2018-2030 (USD MILLION)
  • TABLE 137. CHINA DENTAL COMPOSITES MARKET SIZE, BY END USER, 2018-2030 (USD MILLION)
  • TABLE 138. CHINA DENTAL COMPOSITES MARKET SIZE, BY DISTRIBUTION CHANNEL, 2018-2030 (USD MILLION)
  • TABLE 139. INDIA DENTAL COMPOSITES MARKET SIZE, BY TYPE, 2018-2030 (USD MILLION)
  • TABLE 140. INDIA DENTAL COMPOSITES MARKET SIZE, BY RESIN TYPE, 2018-2030 (USD MILLION)
  • TABLE 141. INDIA DENTAL COMPOSITES MARKET SIZE, BY BISPHENOL A-GLYCIDYL METHACRYLATE (BIS-GMA), 2018-2030 (USD MILLION)
  • TABLE 142. INDIA DENTAL COMPOSITES MARKET SIZE, BY CURING TYPE, 2018-2030 (USD MILLION)
  • TABLE 143. INDIA DENTAL COMPOSITES MARKET SIZE, BY APPLICATION, 2018-2030 (USD MILLION)
  • TABLE 144. INDIA DENTAL COMPOSITES MARKET SIZE, BY DIRECT RESTORATIVE, 2018-2030 (USD MILLION)
  • TABLE 145. INDIA DENTAL COMPOSITES MARKET SIZE, BY INDIRECT RESTORATIVE, 2018-2030 (USD MILLION)
  • TABLE 146. INDIA DENTAL COMPOSITES MARKET SIZE, BY PROSTHETICS, 2018-2030 (USD MILLION)
  • TABLE 147. INDIA DENTAL COMPOSITES MARKET SIZE, BY END USER, 2018-2030 (USD MILLION)
  • TABLE 148. INDIA DENTAL COMPOSITES MARKET SIZE, BY DISTRIBUTION CHANNEL, 2018-2030 (USD MILLION)
  • TABLE 149. INDONESIA DENTAL COMPOSITES MARKET SIZE, BY TYPE, 2018-2030 (USD MILLION)
  • TABLE 150. INDONESIA DENTAL COMPOSITES MARKET SIZE, BY RESIN TYPE, 2018-2030 (USD MILLION)
  • TABLE 151. INDONESIA DENTAL COMPOSITES MARKET SIZE, BY BISPHENOL A-GLYCIDYL METHACRYLATE (BIS-GMA), 2018-2030 (USD MILLION)
  • TABLE 152. INDONESIA DENTAL COMPOSITES MARKET SIZE, BY CURING TYPE, 2018-2030 (USD MILLION)
  • TABLE 153. INDONESIA DENTAL COMPOSITES MARKET SIZE, BY APPLICATION, 2018-2030 (USD MILLION)
  • TABLE 154. INDONESIA DENTAL COMPOSITES MARKET SIZE, BY DIRECT RESTORATIVE, 2018-2030 (USD MILLION)
  • TABLE 155. INDONESIA DENTAL COMPOSITES MARKET SIZE, BY INDIRECT RESTORATIVE, 2018-2030 (USD MILLION)
  • TABLE 156. INDONESIA DENTAL COMPOSITES MARKET SIZE, BY PROSTHETICS, 2018-2030 (USD MILLION)
  • TABLE 157. INDONESIA DENTAL COMPOSITES MARKET SIZE, BY END USER, 2018-2030 (USD MILLION)
  • TABLE 158. INDONESIA DENTAL COMPOSITES MARKET SIZE, BY DISTRIBUTION CHANNEL, 2018-2030 (USD MILLION)
  • TABLE 159. JAPAN DENTAL COMPOSITES MARKET SIZE, BY TYPE, 2018-2030 (USD MILLION)
  • TABLE 160. JAPAN DENTAL COMPOSITES MARKET SIZE, BY RESIN TYPE, 2018-2030 (USD MILLION)
  • TABLE 161. JAPAN DENTAL COMPOSITES MARKET SIZE, BY BISPHENOL A-GLYCIDYL METHACRYLATE (BIS-GMA), 2018-2030 (USD MILLION)
  • TABLE 162. JAPAN DENTAL COMPOSITES MARKET SIZE, BY CURING TYPE, 2018-2030 (USD MILLION)
  • TABLE 163. JAPAN DENTAL COMPOSITES MARKET SIZE, BY APPLICATION, 2018-2030 (USD MILLION)
  • TABLE 164. JAPAN DENTAL COMPOSITES MARKET SIZE, BY DIRECT RESTORATIVE, 2018-2030 (USD MILLION)
  • TABLE 165. JAPAN DENTAL COMPOSITES MARKET SIZE, BY INDIRECT RESTORATIVE, 2018-2030 (USD MILLION)
  • TABLE 166. JAPAN DENTAL COMPOSITES MARKET SIZE, BY PROSTHETICS, 2018-2030 (USD MILLION)
  • TABLE 167. JAPAN DENTAL COMPOSITES MARKET SIZE, BY END USER, 2018-2030 (USD MILLION)
  • TABLE 168. JAPAN DENTAL COMPOSITES MARKET SIZE, BY DISTRIBUTION CHANNEL, 2018-2030 (USD MILLION)
  • TABLE 169. MALAYSIA DENTAL COMPOSITES MARKET SIZE, BY TYPE, 2018-2030 (USD MILLION)
  • TABLE 170. MALAYSIA DENTAL COMPOSITES MARKET SIZE, BY RESIN TYPE, 2018-2030 (USD MILLION)
  • TABLE 171. MALAYSIA DENTAL COMPOSITES MARKET SIZE, BY BISPHENOL A-GLYCIDYL METHACRYLATE (BIS-GMA), 2018-2030 (USD MILLION)
  • TABLE 172. MALAYSIA DENTAL COMPOSITES MARKET SIZE, BY CURING TYPE, 2018-2030 (USD MILLION)
  • TABLE 173. MALAYSIA DENTAL COMPOSITES MARKET SIZE, BY APPLICATION, 2018-2030 (USD MILLION)
  • TABLE 174. MALAYSIA DENTAL COMPOSITES MARKET SIZE, BY DIRECT RESTORATIVE, 2018-2030 (USD MILLION)
  • TABLE 175. MALAYSIA DENTAL COMPOSITES MARKET SIZE, BY INDIRECT RESTORATIVE, 2018-2030 (USD MILLION)
  • TABLE 176. MALAYSIA DENTAL COMPOSITES MARKET SIZE, BY PROSTHETICS, 2018-2030 (USD MILLION)
  • TABLE 177. MALAYSIA DENTAL COMPOSITES MARKET SIZE, BY END USER, 2018-2030 (USD MILLION)
  • TABLE 178. MALAYSIA DENTAL COMPOSITES MARKET SIZE, BY DISTRIBUTION CHANNEL, 2018-2030 (USD MILLION)
  • TABLE 179. PHILIPPINES DENTAL COMPOSITES MARKET SIZE, BY TYPE, 2018-2030 (USD MILLION)
  • TABLE 180. PHILIPPINES DENTAL COMPOSITES MARKET SIZE, BY RESIN TYPE, 2018-2030 (USD MILLION)
  • TABLE 181. PHILIPPINES DENTAL COMPOSITES MARKET SIZE, BY BISPHENOL A-GLYCIDYL METHACRYLATE (BIS-GMA), 2018-2030 (USD MILLION)
  • TABLE 182. PHILIPPINES DENTAL COMPOSITES MARKET SIZE, BY CURING TYPE, 2018-2030 (USD MILLION)
  • TABLE 183. PHILIPPINES DENTAL COMPOSITES MARKET SIZE, BY APPLICATION, 2018-2030 (USD MILLION)
  • TABLE 184. PHILIPPINES DENTAL COMPOSITES MARKET SIZE, BY DIRECT RESTORATIVE, 2018-2030 (USD MILLION)
  • TABLE 185. PHILIPPINES DENTAL COMPOSITES MARKET SIZE, BY INDIRECT RESTORATIVE, 2018-2030 (USD MILLION)
  • TABLE 186. PHILIPPINES DENTAL COMPOSITES MARKET SIZE, BY PROSTHETICS, 2018-2030 (USD MILLION)
  • TABLE 187. PHILIPPINES DENTAL COMPOSITES MARKET SIZE, BY END USER, 2018-2030 (USD MILLION)
  • TABLE 188. PHILIPPINES DENTAL COMPOSITES MARKET SIZE, BY DISTRIBUTION CHANNEL, 2018-2030 (USD MILLION)
  • TABLE 189. SINGAPORE DENTAL COMPOSITES MARKET SIZE, BY TYPE, 2018-2030 (USD MILLION)
  • TABLE 190. SINGAPORE DENTAL COMPOSITES MARKET SIZE, BY RESIN TYPE, 2018-2030 (USD MILLION)
  • TABLE 191. SINGAPORE DENTAL COMPOSITES MARKET SIZE, BY BISPHENOL A-GLYCIDYL METHACRYLATE (BIS-GMA), 2018-2030 (USD MILLION)
  • TABLE 192. SINGAPORE DENTAL COMPOSITES MARKET SIZE, BY CURING TYPE, 2018-2030 (USD MILLION)
  • TABLE 193. SINGAPORE DENTAL COMPOSITES MARKET SIZE, BY APPLICATION, 2018-2030 (USD MILLION)
  • TABLE 194. SINGAPORE DENTAL COMPOSITES MARKET SIZE, BY DIRECT RESTORATIVE, 2018-2030 (USD MILLION)
  • TABLE 195. SINGAPORE DENTAL COMPOSITES MARKET SIZE, BY INDIRECT RESTORATIVE, 2018-2030 (USD MILLION)
  • TABLE 196. SINGAPORE DENTAL COMPOSITES MARKET SIZE, BY PROSTHETICS, 2018-2030 (USD MILLION)
  • TABLE 197. SINGAPORE DENTAL COMPOSITES MARKET SIZE, BY END USER, 2018-2030 (USD MILLION)
  • TABLE 198. SINGAPORE DENTAL COMPOSITES MARKET SIZE, BY DISTRIBUTION CHANNEL, 2018-2030 (USD MILLION)
  • TABLE 199. SOUTH KOREA DENTAL COMPOSITES MARKET SIZE, BY TYPE, 2018-2030 (USD MILLION)
  • TABLE 200. SOUTH KOREA DENTAL COMPOSITES MARKET SIZE, BY RESIN TYPE, 2018-2030 (USD MILLION)
  • TABLE 201. SOUTH KOREA DENTAL COMPOSITES MARKET SIZE, BY BISPHENOL A-GLYCIDYL METHACRYLATE (BIS-GMA), 2018-2030 (USD MILLION)
  • TABLE 202. SOUTH KOREA DENTAL COMPOSITES MARKET SIZE, BY CURING TYPE, 2018-2030 (USD MILLION)
  • TABLE 203. SOUTH KOREA DENTAL COMPOSITES MARKET SIZE, BY APPLICATION, 2018-2030 (USD MILLION)
  • TABLE 204. SOUTH KOREA DENTAL COMPOSITES MARKET SIZE, BY DIRECT RESTORATIVE, 2018-2030 (USD MILLION)
  • TABLE 205. SOUTH KOREA DENTAL COMPOSITES MARKET SIZE, BY INDIRECT RESTORATIVE, 2018-2030 (USD MILLION)
  • TABLE 206. SOUTH KOREA DENTAL COMPOSITES MARKET SIZE, BY PROSTHETICS, 2018-2030 (USD MILLION)
  • TABLE 207. SOUTH KOREA DENTAL COMPOSITES MARKET SIZE, BY END USER, 2018-2030 (USD MILLION)
  • TABLE 208. SOUTH KOREA DENTAL COMPOSITES MARKET SIZE, BY DISTRIBUTION CHANNEL, 2018-2030 (USD MILLION)
  • TABLE 209. TAIWAN DENTAL COMPOSITES MARKET SIZE, BY TYPE, 2018-2030 (USD MILLION)
  • TABLE 210. TAIWAN DENTAL COMPOSITES MARKET SIZE, BY RESIN TYPE, 2018-2030 (USD MILLION)
  • TABLE 211. TAIWAN DENTAL COMPOSITES MARKET SIZE, BY BISPHENOL A-GLYCIDYL METHACRYLATE (BIS-GMA), 2018-2030 (USD MILLION)
  • TABLE 212. TAIWAN DENTAL COMPOSITES MARKET SIZE, BY CURING TYPE, 2018-2030 (USD MILLION)
  • TABLE 213. TAIWAN DENTAL COMPOSITES MARKET SIZE, BY APPLICATION, 2018-2030 (USD MILLION)
  • TABLE 214. TAIWAN DENTAL COMPOSITES MARKET SIZE, BY DIRECT RESTORATIVE, 2018-2030 (USD MILLION)
  • TABLE 215. TAIWAN DENTAL COMPOSITES MARKET SIZE, BY INDIRECT RESTORATIVE, 2018-2030 (USD MILLION)
  • TABLE 216. TAIWAN DENTAL COMPOSITES MARKET SIZE, BY PROSTHETICS, 2018-2030 (USD MILLION)
  • TABLE 217. TAIWAN DENTAL COMPOSITES MARKET SIZE, BY END USER, 2018-2030 (USD MILLION)
  • TABLE 218. TAIWAN DENTAL COMPOSITES MARKET SIZE, BY DISTRIBUTION CHANNEL, 2018-2030 (USD MILLION)
  • TABLE 219. THAILAND DENTAL COMPOSITES MARKET SIZE, BY TYPE, 2018-2030 (USD MILLION)
  • TABLE 220. THAILAND DENTAL COMPOSITES MARKET SIZE, BY RESIN TYPE, 2018-2030 (USD MILLION)
  • TABLE 221. THAILAND DENTAL COMPOSITES MARKET SIZE, BY BISPHENOL A-GLYCIDYL METHACRYLATE (BIS-GMA), 2018-2030 (USD MILLION)
  • TABLE 222. THAILAND DENTAL COMPOSITES MARKET SIZE, BY CURING TYPE, 2018-2030 (USD MILLION)
  • TABLE 223. THAILAND DENTAL COMPOSITES MARKET SIZE, BY APPLICATION, 2018-2030 (USD MILLION)
  • TABLE 224. THAILAND DENTAL COMPOSITES MARKET SIZE, BY DIRECT RESTORATIVE, 2018-2030 (USD MILLION)
  • TABLE 225. THAILAND DENTAL COMPOSITES MARKET SIZE, BY INDIRECT RESTORATIVE, 2018-2030 (USD MILLION)
  • TABLE 226. THAILAND DENTAL COMPOSITES MARKET SIZE, BY PROSTHETICS, 2018-2030 (USD MILLION)
  • TABLE 227. THAILAND DENTAL COMPOSITES MARKET SIZE, BY END USER, 2018-2030 (USD MILLION)
  • TABLE 228. THAILAND DENTAL COMPOSITES MARKET SIZE, BY DISTRIBUTION CHANNEL, 2018-2030 (USD MILLION)
  • TABLE 229. VIETNAM DENTAL COMPOSITES MARKET SIZE, BY TYPE, 2018-2030 (USD MILLION)
  • TABLE 230. VIETNAM DENTAL COMPOSITES MARKET SIZE, BY RESIN TYPE, 2018-2030 (USD MILLION)
  • TABLE 231. VIETNAM DENTAL COMPOSITES MARKET SIZE, BY BISPHENOL A-GLYCIDYL METHACRYLATE (BIS-GMA), 2018-2030 (USD MILLION)
  • TABLE 232. VIETNAM DENTAL COMPOSITES MARKET SIZE, BY CURING TYPE, 2018-2030 (USD MILLION)
  • TABLE 233. VIETNAM DENTAL COMPOSITES MARKET SIZE, BY APPLICATION, 2018-2030 (USD MILLION)
  • TABLE 234. VIETNAM DENTAL COMPOSITES MARKET SIZE, BY DIRECT RESTORATIVE, 2018-2030 (USD MILLION)
  • TABLE 235. VIETNAM DENTAL COMPOSITES MARKET SIZE, BY INDIRECT RESTORATIVE, 2018-2030 (USD MILLION)
  • TABLE 236. VIETNAM DENTAL COMPOSITES MARKET SIZE, BY PROSTHETICS, 2018-2030 (USD MILLION)
  • TABLE 237. VIETNAM DENTAL COMPOSITES MARKET SIZE, BY END USER, 2018-2030 (USD MILLION)
  • TABLE 238. VIETNAM DENTAL COMPOSITES MARKET SIZE, BY DISTRIBUTION CHANNEL, 2018-2030 (USD MILLION)
  • TABLE 239. EUROPE, MIDDLE EAST & AFRICA DENTAL COMPOSITES MARKET SIZE, BY TYPE, 2018-2030 (USD MILLION)
  • TABLE 240. EUROPE, MIDDLE EAST & AFRICA DENTAL COMPOSITES MARKET SIZE, BY RESIN TYPE, 2018-2030 (USD MILLION)
  • TABLE 241. EUROPE, MIDDLE EAST & AFRICA DENTAL COMPOSITES MARKET SIZE, BY BISPHENOL A-GLYCIDYL METHACRYLATE (BIS-GMA), 2018-2030 (USD MILLION)
  • TABLE 242. EUROPE, MIDDLE EAST & AFRICA DENTAL COMPOSITES MARKET SIZE, BY CURING TYPE, 2018-2030 (USD MILLION)
  • TABLE 243. EUROPE, MIDDLE EAST & AFRICA DENTAL COMPOSITES MARKET SIZE, BY APPLICATION, 2018-2030 (USD MILLION)
  • TABLE 244. EUROPE, MIDDLE EAST & AFRICA DENTAL COMPOSITES MARKET SIZE, BY DIRECT RESTORATIVE, 2018-2030 (USD MILLION)
  • TABLE 245. EUROPE, MIDDLE EAST & AFRICA DENTAL COMPOSITES MARKET SIZE, BY INDIRECT RESTORATIVE, 2018-2030 (USD MILLION)
  • TABLE 246. EUROPE, MIDDLE EAST & AFRICA DENTAL COMPOSITES MARKET SIZE, BY PROSTHETICS, 2018-2030 (USD MILLION)
  • TABLE 247. EUROPE, MIDDLE EAST & AFRICA DENTAL COMPOSITES MARKET SIZE, BY END USER, 2018-2030 (USD MILLION)
  • TABLE 248. EUROPE, MIDDLE EAST & AFRICA DENTAL COMPOSITES MARKET SIZE, BY DISTRIBUTION CHANNEL, 2018-2030 (USD MILLION)
  • TABLE 249. EUROPE, MIDDLE EAST & AFRICA DENTAL COMPOSITES MARKET SIZE, BY COUNTRY, 2018-2030 (USD MILLION)
  • TABLE 250. DENMARK DENTAL COMPOSITES MARKET SIZE, BY TYPE, 2018-2030 (USD MILLION)
  • TABLE 251. DENMARK DENTAL COMPOSITES MARKET SIZE, BY RESIN TYPE, 2018-2030 (USD MILLION)
  • TABLE 252. DENMARK DENTAL COMPOSITES MARKET SIZE, BY BISPHENOL A-GLYCIDYL METHACRYLATE (BIS-GMA), 2018-2030 (USD MILLION)
  • TABLE 253. DENMARK DENTAL COMPOSITES MARKET SIZE, BY CURING TYPE, 2018-2030 (USD MILLION)
  • TABLE 254. DENMARK DENTAL COMPOSITES MARKET SIZE, BY APPLICATION, 2018-2030 (USD MILLION)
  • TABLE 255. DENMARK DENTAL COMPOSITES MARKET SIZE, BY DIRECT RESTORATIVE, 2018-2030 (USD MILLION)
  • TABLE 256. DENMARK DENTAL COMPOSITES MARKET SIZE, BY INDIRECT RESTORATIVE, 2018-2030 (USD MILLION)
  • TABLE 257. DENMARK DENTAL COMPOSITES MARKET SIZE, BY PROSTHETICS, 2018-2030 (USD MILLION)
  • TABLE 258. DENMARK DENTAL COMPOSITES MARKET SIZE, BY END USER, 2018-2030 (USD MILLION)
  • TABLE 259. DENMARK DENTAL COMPOSITES MARKET SIZE, BY DISTRIBUTION CHANNEL, 2018-2030 (USD MILLION)
  • TABLE 260. EGYPT DENTAL COMPOSITES MARKET SIZE, BY TYPE, 2018-2030 (USD MILLION)
  • TABLE 261. EGYPT DENTAL COMPOSITES MARKET SIZE, BY RESIN TYPE, 2018-2030 (USD MILLION)
  • TABLE 262. EGYPT DENTAL COMPOSITES MARKET SIZE, BY BISPHENOL A-GLYCIDYL METHACRYLATE (BIS-GMA), 2018-2030 (USD MILLION)
  • TABLE 263. EGYPT DENTAL COMPOSITES MARKET SIZE, BY CURING TYPE, 2018-2030 (USD MILLION)
  • TABLE 264. EGYPT DENTAL COMPOSITES MARKET SIZE, BY APPLICATION, 2018-2030 (USD MILLION)
  • TABLE 265. EGYPT DENTAL COMPOSITES MARKET SIZE, BY DIRECT RESTORATIVE, 2018-2030 (USD MILLION)
  • TABLE 266. EGYPT DENTAL COMPOSITES MARKET SIZE, BY INDIRECT RESTORATIVE, 2018-2030 (USD MILLION)
  • TABLE 267. EGYPT DENTAL COMPOSITES MARKET SIZE, BY PROSTHETICS, 2018-2030 (USD MILLION)
  • TABLE 268. EGYPT DENTAL COMPOSITES MARKET SIZE, BY END USER, 2018-2030 (USD MILLION)
  • TABLE 269. EGYPT DENTAL COMPOSITES MARKET SIZE, BY DISTRIBUTION CHANNEL, 2018-2030 (USD MILLION)
  • TABLE 270. FINLAND DENTAL COMPOSITES MARKET SIZE, BY TYPE, 2018-2030 (USD MILLION)
  • TABLE 271. FINLAND DENTAL COMPOSITES MARKET SIZE, BY RESIN TYPE, 2018-2030 (USD MILLION)
  • TABLE 272. FINLAND DENTAL COMPOSITES MARKET SIZE, BY BISPHENOL A-GLYCIDYL METHACRYLATE (BIS-GMA), 2018-2030 (USD MILLION)
  • TABLE 273. FINLAND DENTAL COMPOSITES MARKET SIZE, BY CURING TYPE, 2018-2030 (USD MILLION)
  • TABLE 274. FINLAND DENTAL COMPOSITES MARKET SIZE, BY APPLICATION, 2018-2030 (USD MILLION)
  • TABLE 275. FINLAND DENTAL COMPOSITES MARKET SIZE, BY DIRECT RESTORATIVE, 2018-2030 (USD MILLION)
  • TABLE 276. FINLAND DENTAL COMPOSITES MARKET SIZE, BY INDIRECT RESTORATIVE, 2018-2030 (USD MILLION)
  • TABLE 277. FINLAND DENTAL COMPOSITES MARKET SIZE, BY PROSTHETICS, 2018-2030 (USD MILLION)
  • TABLE 278. FINLAND DENTAL COMPOSITES MARKET SIZE, BY END USER, 2018-2030 (USD MILLION)
  • TABLE 279. FINLAND DENTAL COMPOSITES MARKET SIZE, BY DISTRIBUTION CHANNEL, 2018-2030 (USD MILLION)
  • TABLE 280. FRANCE DENTAL COMPOSITES MARKET SIZE, BY TYPE, 2018-2030 (USD MILLION)
  • TABLE 281. FRANCE DENTAL COMPOSITES MARKET SIZE, BY RESIN TYPE, 2018-2030 (USD MILLION)
  • TABLE 282. FRANCE DENTAL COMPOSITES MARKET SIZE, BY BISPHENOL A-GLYCIDYL METHACRYLATE (BIS-GMA), 2018-2030 (USD MILLION)
  • TABLE 283. FRANCE DENTAL COMPOSITES MARKET SIZE, BY CURING TYPE, 2018-2030 (USD MILLION)
  • TABLE 284. FRANCE DENTAL COMPOSITES MARKET SIZE, BY APPLICATION, 2018-2030 (USD MILLION)
  • TABLE 285. FRANCE DENTAL COMPOSITES MARKET SIZE, BY DIRECT RESTORATIVE, 2018-2030 (USD MILLION)
  • TABLE 286. FRANCE DENTAL COMPOSITES MARKET SIZE, BY INDIRECT RESTORATIVE, 2018-2030 (USD MILLION)
  • TABLE 287. FRANCE DENTAL COMPOSITES MARKET SIZE, BY PROSTHETICS, 2018-2030 (USD MILLION)
  • TABLE 288. FRANCE DENTAL COMPOSITES MARKET SIZE, BY END USER, 2018-2030 (USD MILLION)
  • TABLE 289. FRANCE DENTAL COMPOSITES MARKET SIZE, BY DISTRIBUTION CHANNEL, 2018-2030 (USD MILLION)
  • TABLE 290. GERMANY DENTAL COMPOSITES MARKET SIZE, BY TYPE, 2018-2030 (USD MILLION)
  • TABLE 291. GERMANY DENTAL COMPOSITES MARKET SIZE, BY RESIN TYPE, 2018-2030 (USD MILLION)
  • TABLE 292. GERMANY DENTAL COMPOSITES MARKET SIZE, BY BISPHENOL A-GLYCIDYL METHACRYLATE (BIS-GMA), 2018-2030 (USD MILLION)
  • TABLE 293. GERMANY DENTAL COMPOSITES MARKET SIZE, BY CURING TYPE, 2018-2030 (USD MILLION)
  • TABLE 294. GERMANY DENTAL COMPOSITES MARKET SIZE, BY APPLICATION, 2018-2030 (USD MILLION)
  • TABLE 295. GERMANY DENTAL COMPOSITES MARKET SIZE, BY DIRECT RESTORATIVE, 2018-2030 (USD MILLION)
  • TABLE 296. GERMANY DENTAL COMPOSITES MARKET SIZE, BY INDIRECT RESTORATIVE, 2018-2030 (USD MILLION)
  • TABLE 297. GERMANY DENTAL COMPOSITES MARKET SIZE, BY PROSTHETICS, 2018-2030 (USD MILLION)
  • TABLE 298. GERMANY DENTAL COMPOSITES MARKET SIZE, BY END USER, 2018-2030 (USD MILLION)
  • TABLE 299. GERMANY DENTAL COMPOSITES MARKET SIZE, BY DISTRIBUTION CHANNEL, 2018-2030 (USD MILLION)
  • TABLE 300. ISRAEL DENTAL COMPOSITES MARKET SIZE, BY TYPE, 2018-2030 (USD MILLION)
  • TABLE 301. ISRAEL DENTAL COMPOSITES MARKET SIZE, BY RESIN TYPE, 2018-2030 (USD MILLION)
  • TABLE 302. ISRAEL DENTAL COMPOSITES MARKET SIZE, BY BISPHENOL A-GLYCIDYL METHACRYLATE (BIS-GMA), 2018-2030 (USD MILLION)
  • TABLE 303. ISRAEL DENTAL COMPOSITES MARKET SIZE, BY CURING TYPE, 2018-2030 (USD MILLION)
  • TABLE 304. ISRAEL DENTAL COMPOSITES MARKET SIZE, BY APPLICATION, 2018-2030 (USD MILLION)
  • TABLE 305. ISRAEL DENTAL COMPOSITES MARKET SIZE, BY DIRECT RESTORATIVE, 2018-2030 (USD MILLION)
  • TABLE 306. ISRAEL DENTAL COMPOSITES MARKET SIZE, BY INDIRECT RESTORATIVE, 2018-2030 (USD MILLION)
  • TABLE 307. ISRAEL DENTAL COMPOSITES MARKET SIZE, BY PROSTHETICS, 2018-2030 (USD MILLION)
  • TABLE 308. ISRAEL DENTAL COMPOSITES MARKET SIZE, BY END USER, 2018-2030 (USD MILLION)
  • TABLE 309. ISRAEL DENTAL COMPOSITES MARKET SIZE, BY DISTRIBUTION CHANNEL, 2018-2030 (USD MILLION)
  • TABLE 310. ITALY DENTAL COMPOSITES MARKET SIZE, BY TYPE, 2018-2030 (USD MILLION)
  • TABLE 311. ITALY DENTAL COMPOSITES MARKET SIZE, BY RESIN TYPE, 2018-2030 (USD MILLION)
  • TABLE 312. ITALY DENTAL COMPOSITES MARKET SIZE, BY BISPHENOL A-GLYCIDYL METHACRYLATE (BIS-GMA), 2018-2030 (USD MILLION)
  • TABLE 313. ITALY DENTAL COMPOSITES MARKET SIZE, BY CURING TYPE, 2018-2030 (USD MILLION)
  • TABLE 314. ITALY DENTAL COMPOSITES MARKET SIZE, BY APPLICATION, 2018-2030 (USD MILLION)
  • TABLE 315. ITALY DENTAL COMPOSITES MARKET SIZE, BY DIRECT RESTORATIVE, 2018-2030 (USD MILLION)
  • TABLE 316. ITALY DENTAL COMPOSITES MARKET SIZE, BY INDIRECT RESTORATIVE, 2018-2030 (USD MILLION)
  • TABLE 317. ITALY DENTAL COMPOSITES MARKET SIZE, BY PROSTHETICS, 2018-2030 (USD MILLION)
  • TABLE 318. ITALY DENTAL COMPOSITES MARKET SIZE, BY END USER, 2018-2030 (USD MILLION)
  • TABLE 319. ITALY DENTAL COMPOSITES MARKET SIZE, BY DISTRIBUTION CHANNEL, 2018-2030 (USD MILLION)
  • TABLE 320. NETHERLANDS DENTAL COMPOSITES MARKET SIZE, BY TYPE, 2018-2030 (USD MILLION)
  • TABLE 321. NETHERLANDS DENTAL COMPOSITES MARKET SIZE, BY RESIN TYPE, 2018-2030 (USD MILLION)
  • TABLE 322. NETHERLANDS DENTAL COMPOSITES MARKET SIZE, BY BISPHENOL A-GLYCIDYL METHACRYLATE (BIS-GMA), 2018-2030 (USD MILLION)
  • TABLE 323. NETHERLANDS DENTAL COMPOSITES MARKET SIZE, BY CURING TYPE, 2018-2030 (USD MILLION)
  • TABLE 324. NETHERLANDS DENTAL COMPOSITES MARKET SIZE, BY APPLICATION, 2018-2030 (USD MILLION)
  • TABLE 325. NETHERLANDS DENTAL COMPOSITES MARKET SIZE, BY DIRECT RESTORATIVE, 2018-2030 (USD MILLION)
  • TABLE 326. NETHERLANDS DENTAL COMPOSITES MARKET SIZE, BY INDIRECT RESTORATIVE, 2018-2030 (USD MILLION)
  • TABLE 327. NETHERLANDS DENTAL COMPOSITES MARKET SIZE, BY PROSTHETICS, 2018-2030 (USD MILLION)
  • TABLE 328. NETHERLANDS DENTAL COMPOSITES MARKET SIZE, BY END USER, 2018-2030 (USD MILLION)
  • TABLE 329. NETHERLANDS DENTAL COMPOSITES MARKET SIZE, BY DISTRIBUTION CHANNEL, 2018-2030 (USD MILLION)
  • TABLE 330. NIGERIA DENTAL COMPOSITES MARKET SIZE, BY TYPE, 2018-2030 (USD MILLION)
  • TABLE 331. NIGERIA DENTAL COMPOSITES MARKET SIZE, BY RESIN TYPE, 2018-2030 (USD MILLION)
  • TABLE 332. NIGERIA DENTAL COMPOSITES MARKET SIZE, BY BISPHENOL A-GLYCIDYL METHACRYLATE (BIS-GMA), 2018-2030 (USD MILLION)
  • TABLE 333. NIGERIA DENTAL COMPOSITES MARKET SIZE, BY CURING TYPE, 2018-2030 (USD MILLION)
  • TABLE 334. NIGERIA DENTAL COMPOSITES MARKET SIZE, BY APPLICATION, 2018-2030 (USD MILLION)
  • TABLE 335. NIGERIA DENTAL COMPOSITES MARKET SIZE, BY DIRECT RESTORATIVE, 2018-2030 (USD MILLION)
  • TABLE 336. NIGERIA DENTAL COMPOSITES MARKET SIZE, BY INDIRECT RESTORATIVE, 2018-2030 (USD MILLION)
  • TABLE 337. NIGERIA DENTAL COMPOSITES MARKET SIZE, BY PROSTHETICS, 2018-2030 (USD MILLION)
  • TABLE 338. NIGERIA DENTAL COMPOSITES MARKET SIZE, BY END USER, 2018-2030 (USD MILLION)
  • TABLE 339. NIGERIA DENTAL COMPOSITES MARKET SIZE, BY DISTRIBUTION CHANNEL, 2018-2030 (USD MILLION)
  • TABLE 340. NORWAY DENTAL COMPOSITES MARKET SIZE, BY TYPE, 2018-2030 (USD MILLION)
  • TABLE 341. NORWAY DENTAL COMPOSITE
目次
Product Code: MRR-81515600A186

The Dental Composites Market was valued at USD 854.04 million in 2024 and is projected to grow to USD 906.73 million in 2025, with a CAGR of 6.19%, reaching USD 1,225.25 million by 2030.

KEY MARKET STATISTICS
Base Year [2024] USD 854.04 million
Estimated Year [2025] USD 906.73 million
Forecast Year [2030] USD 1,225.25 million
CAGR (%) 6.19%

Dental composites have evolved from being simple restorative materials to sophisticated solutions that blend science, technology, and aesthetic appeal. As the dental market continues to transform, the need for advanced, high-performance composites has never been more critical. This report provides an in-depth analysis of current trends, emerging technologies, and integral market dynamics that are reshaping the composite landscape. Modern advancements in chemical formulations, curing techniques, and material properties are empowering dental professionals to deliver more durable and aesthetically pleasing outcomes. The interplay between material science and consumer expectations has paved the way for products that not only restore function but also enhance the overall patient experience. With progressive research and clinical practices converging, the dental composites industry is poised for groundbreaking changes that will redefine industry standards and patient satisfaction.

The increasing emphasis on minimally invasive procedures and precision in dental restorations has further strengthened the demand for high-quality composite materials. The evolution in manufacturing processes, along with regulatory considerations, has led to a competitive environment where innovation is key to maintaining a leading edge. This comprehensive summary delves into the transformational changes across the market, extracting crucial insights and segmentation data that outline the future course of dental composite materials.

Transformative Shifts in the Landscape: Driving the Future of Dental Composites

In recent years, the dental composites market has experienced a series of transformative shifts that are fundamentally changing the way restorative care is approached. The integration of advanced polymer science, coupled with improvements in curing technology, has facilitated the development of composite products that are not only more effective but also tailored for specific clinical applications. These shifts can be attributed to an increased understanding of resin chemistry and the adoption of innovative manufacturing techniques, all of which contribute to the enhanced performance and longevity of composite materials.

Market dynamics are evolving as technological advancements enable manufacturers to optimize the composition and application methods of dental composites. This new wave of innovation is characterized by an emphasis on high-performance formulations that meet the rigorous demands of both anterior and posterior restorations. The development of composites with variable viscosities and improved mechanical properties has accelerated procedural efficiency, reduced chair time, and elevated clinical outcomes. Additionally, sophisticated curing mechanisms using light-based technologies are ensuring a more uniform polymerization process, which is essential in minimizing post-operative complications. Together, these factors are not only redefining industry benchmarks but are also enabling dental practitioners to enhance treatment predictability and patient satisfaction.

The industry's proactive adoption of research-driven innovation is evident in the rapid evolution of materials that address durability, esthetics, and ease of handling. With increasing investments in material science and technology, stakeholders are now better positioned to compete in a landscape characterized by rapid innovation and shifting consumer expectations.

Key Segmentation Insights: Detailed Analysis Across Multiple Dimensions

The segmentation of the dental composites market reveals a complex canvas of product types, resin types, curing methods, applications, end users, and distribution channels. Manufacturers are dissecting the market by type, which includes classifications such as flowable bulk-fill, flowable composite, full-body bulk fill, micro-fill composite, micro-hybrid composite, nano-fill composite, and nano-hybrid composite. This detailed classification underscores the specialized functionalities and aesthetic properties that each sub-category offers, ensuring that there is an appropriate composite for every clinical scenario.

Delving deeper into resin type, there is a clear emphasis on Bisphenol A-Glycidyl Methacrylate (Bis-GMA), which is considered in terms of both high viscosity and low viscosity formulations, along with other resins such as Triethylene Glycol Dimethacrylate (TEGDMA) and Urethane Dimethacrylate (UDMA). The differentiation in resin chemistry allows for enhanced customization in terms of flowability, strength, and curing behavior. In addition, the market is analyzed based on curing type, giving prominence to both chemical-cured composites and light-cured composites; each curing process provides unique advantages with respect to working time and polymerization consistency.

The application-based segmentation further expands the horizon by addressing direct restorative procedures-which cover anterior and posterior restorations-indirect restorative methods such as inlays, onlays, and veneers, and prosthetic applications involving complete and partial dentures. Equally important is the consideration of end-user segmentation that primarily focuses on dental academics and research institutions, as well as dental clinics and practices, highlighting the diverse environments where these composites are applied. The distribution channels are equally diversified, with the market being thoroughly analyzed through dental distributors and wholesalers, direct sales models, and increasingly, the role of e-commerce and online distribution platforms. This multi-dimensional segmentation reveals that the strategic deployment of dental composites must consider a confluence of factors-from material composition to application and distribution-thus providing market players with a roadmap for targeted innovation and market expansion.

Based on Type, market is studied across Flowable Bulk-Fill, Flowable Composite, Full-Body Bulk Fill, Micro-Fill Composite, Micro-Hybrid composite, Nano-Fill Composite, and Nano-Hybrid Composite.

Based on Resin Type, market is studied across Bisphenol A-Glycidyl Methacrylate (Bis-GMA), Triethylene Glycol Dimethacrylate (TEGDMA), and Urethane Dimethacrylate (UDMA). The Bisphenol A-Glycidyl Methacrylate (Bis-GMA) is further studied across High Viscosity Bis-GMA and Low Viscosity Bis-GMA.

Based on Curing Type, market is studied across Chemical-Cured Composites and Light-Cured Composites.

Based on Application, market is studied across Direct Restorative, Indirect Restorative, and Prosthetics. The Direct Restorative is further studied across Anterior Restorations and Posterior Restorations. The Indirect Restorative is further studied across Inlays, Onlays, and Veneers. The Prosthetics is further studied across Complete Dentures and Partial Dentures.

Based on End User, market is studied across Dental Academics & Research Institutions and Dental Clinics & Practices.

Based on Distribution Channel, market is studied across Dental Distributors & Wholesalers, Direct Sales, and E-commerce/Online Distribution Platforms.

Key Regional Insights: Evaluating Global Market Variations

When examining the dental composites market, it is critical to consider the unique regional characteristics that shape product demand and regulatory landscapes. The Americas have shown robust market performance thanks to advanced healthcare infrastructure and a high demand for technologically superior restorative products. In Europe, the Middle East, and Africa, market dynamics are influenced by a blend of established clinical practices and rapidly emerging technological trends. Stakeholders in these regions benefit from regulatory reforms and an increasing emphasis on research and development, which facilitate the adoption of cutting-edge dental composites.

Moving towards the Asia-Pacific region, rapid urbanization, a growing middle class, and a surge in dental tourism have contributed to a steady increase in consumer demand. The diverse economic and cultural landscape in the Asia-Pacific has driven both innovation and competition, with significant investments in manufacturing, distribution, and local research. These regional insights collectively illustrate that while technological and economic factors might differ, the fundamental drive for quality, aesthetic, and durable dental composites remains a unifying element across global markets. A nuanced understanding of regional market trends is thus essential for companies seeking to capture new opportunities and foster sustainable growth in a competitive global environment.

Based on Region, market is studied across Americas, Asia-Pacific, and Europe, Middle East & Africa. The Americas is further studied across Argentina, Brazil, Canada, Mexico, and United States. The United States is further studied across California, Florida, Illinois, Michigan, New York, Ohio, Pennsylvania, and Texas. The Asia-Pacific is further studied across Australia, China, India, Indonesia, Japan, Malaysia, Philippines, Singapore, South Korea, Taiwan, Thailand, and Vietnam. The Europe, Middle East & Africa is further studied across Denmark, Egypt, Finland, France, Germany, Israel, Italy, Netherlands, Nigeria, Norway, Poland, Qatar, Russia, Saudi Arabia, South Africa, Spain, Sweden, Switzerland, Turkey, United Arab Emirates, and United Kingdom.

Key Companies Insights: Profiling Market Leaders and Innovators

The market for dental composites is characterized by a robust presence of established companies and innovative newcomers. Corporate giants such as 3M Company and Bioloren S.r.l. have contributed significantly to both research and development as well as effective market penetration strategies. Industry stalwarts like BISCO, Inc. by EACO Corp. and Coltene Group continue to influence the direction of product innovation, while Cosmedent, Inc. and Den-Mat Holdings, LLC have made notable strides through their emphasis on quality and sustainability in product development. Leading organizations such as Dentsply Sirona Inc. and DMG Chemisch-Pharmazeutische Fabrik GmbH have solidified their market presence by leveraging advanced production techniques and expansive distribution networks.

FGM Dental Group and GC Corporation add depth to the competitive landscape, with their focus on catering to niche markets in the restorative dental space. Ivoclar Vivadent AG and J. MORITA CORP have further pushed the envelope through continuous improvements in material technology and clinical efficacy. Kerr Corporation by Envista Holdings Corporation, Kettenbach SNC, and Kulzer GmbH by Mitsui Chemicals, Inc. are also pivotal in shaping market trends through innovative product lines and effective market strategies. Kuraray Noritake Dental Inc. and Parkell, Inc. by Directa Dental Group underscore the commitment to quality and clinical performance, while Pulpdent Corporation, Rident Denpro Pvt Ltd, and SDI Limited exemplify emerging innovation in the dental composites market. Septodont Holding, SHOFU Dental GmbH, Tokuyama Dental Corporation, Ultradent Products, Inc., and VOCO GmbH round out the competitive landscape by emphasizing the importance of research-driven product advancement and global outreach. Together, these companies drive the industry forward by blending technological innovation with robust market strategies, ensuring that dental professionals have access to the best possible restorative solutions.

The report delves into recent significant developments in the Dental Composites Market, highlighting leading vendors and their innovative profiles. These include 3M Company, Bioloren S.r.l., BISCO, Inc. by EACO Corp., Coltene Group, Cosmedent, Inc., Den-Mat Holdings, LLC, Dentsply Sirona Inc., DMG Chemisch-Pharmazeutische Fabrik GmbH, FGM Dental Group., GC Corporation, Ivoclar Vivadent AG, J. MORITA CORP, Kerr Corporation by Envista Holdings Corporation, Kettenbach SNC, Kulzer GmbH by Mitsui Chemicals, Inc, Kuraray Noritake Dental Inc., Parkell, Inc. by Directa Dental Group, Pulpdent Corporation, Rident Denpro Pvt Ltd, SDI Limited, Septodont Holding, SHOFU Dental GmbH, Tokuyama Dental Corporation, Ultradent Products, Inc., and VOCO GmbH. Actionable Recommendations: Strategic Guidelines for Market Leadership

To sustain competitive advantage in the rapidly evolving dental composites market, industry leaders must take proactive measures that address both current trends and future opportunities. Investing in research and development is paramount; companies should explore innovative material formulations and advanced curing systems that deliver superior performance and durability. It is imperative to align marketing strategies with the continuous evolution in customer expectations, thereby facilitating smoother integration of cutting-edge technology with everyday clinical practices.

Partnerships and collaborations between academia, research institutions, and industry players can catalyze the innovation cycle, leading to the acceleration of product development and commercialization. Moreover, optimizing supply chain operations by embracing digital technologies and e-commerce platforms can significantly enhance market reach and operational efficiency. Strategic geographic expansions, especially within rapidly growing regions, offer opportunities to diversify market risk and capitalize on emerging consumer trends. By tailoring product portfolios to regional demands and regulatory requirements, companies can ensure relevance and resilience.

Another key recommendation is to strengthen customer engagement through ongoing education programs and training initiatives geared toward dental practitioners. This not only builds brand loyalty but also ensures that end users are well-informed about the advantages and proper application of innovative composite materials. Additionally, incorporating sustainability into the product development cycle and manufacturing processes could provide a competitive edge as consumer preferences increasingly lean towards eco-friendly solutions. Overall, a future-focused approach that balances innovation, strategic partnerships, and market responsiveness will be critical for industry leaders aiming to maintain and enhance their market positioning.

Conclusion: Synthesizing Insights and Looking Forward

In summary, the dental composites market is undergoing a dynamic transformation driven by advancements in material science and evolving clinical demands. The comprehensive segmentation analysis, spanning product types and resin compositions to curing methods and application techniques, highlights the diverse and intricate nature of market trends. By understanding the global variations across key regions and appreciating the contributions of industry leaders, stakeholders can leverage these insights to foster innovation and drive sustainable growth.

The convergence of technology, research, and market demand has created an environment ripe for transformative change. Manufacturers and clinicians alike must remain agile and responsive to the evolving landscape to not only meet but exceed the expectations of modern dental care. As the market continues to evolve, the emphasis on durability, aesthetic appeal, and material performance will become increasingly critical. The data presented in this report serves as a strategic compass for navigating the complexities of an ever-changing industry. Ultimately, the power of informed decision-making will be the catalyst for enhanced patient outcomes, operational excellence, and long-term market success.

Table of Contents

1. Preface

  • 1.1. Objectives of the Study
  • 1.2. Market Segmentation & Coverage
  • 1.3. Years Considered for the Study
  • 1.4. Currency & Pricing
  • 1.5. Language
  • 1.6. Stakeholders

2. Research Methodology

  • 2.1. Define: Research Objective
  • 2.2. Determine: Research Design
  • 2.3. Prepare: Research Instrument
  • 2.4. Collect: Data Source
  • 2.5. Analyze: Data Interpretation
  • 2.6. Formulate: Data Verification
  • 2.7. Publish: Research Report
  • 2.8. Repeat: Report Update

3. Executive Summary

4. Market Overview

5. Market Insights

  • 5.1. Market Dynamics
    • 5.1.1. Drivers
      • 5.1.1.1. Rising prevalence of dental decay enhances the need for advanced dental composites
      • 5.1.1.2. Increasing consumer focus on cosmetic dentistry enhancing the demand for aesthetically pleasing composite materials
    • 5.1.2. Restraints
      • 5.1.2.1. High cost and raw material fluctuations of dental composite solutions affecting the adoption rate
    • 5.1.3. Opportunities
      • 5.1.3.1. Advancements in composite resin technology that enhance the performance of dental restorations
      • 5.1.3.2. Expanding dental services and infrastructure for advanced dental treatments
    • 5.1.4. Challenges
      • 5.1.4.1. Concerns associated with the durability and aesthetics of dental composites
  • 5.2. Market Segmentation Analysis
    • 5.2.1. Type: Rising adoption of flowable composites in restorative and cosmetic dentistry
    • 5.2.2. Resin Type: Increasing demand for Bis-GMA to ensure durability in dental restorations
    • 5.2.3. Curing Type: Utilization of chemical-cured composites in areas where light penetration is limited for deep restorations
    • 5.2.4. Application: Growing preference for anterior restorative to mimic natural front teeth appearance
    • 5.2.5. End User: Increasing advancements in composite technology in dental clinics to enhance patient care
    • 5.2.6. Distribution Channel: Rising shift towards online distribution platforms for dental composites
  • 5.3. Porter's Five Forces Analysis
    • 5.3.1. Threat of New Entrants
    • 5.3.2. Threat of Substitutes
    • 5.3.3. Bargaining Power of Customers
    • 5.3.4. Bargaining Power of Suppliers
    • 5.3.5. Industry Rivalry
  • 5.4. PESTLE Analysis
    • 5.4.1. Political
    • 5.4.2. Economic
    • 5.4.3. Social
    • 5.4.4. Technological
    • 5.4.5. Legal
    • 5.4.6. Environmental

6. Dental Composites Market, by Type

  • 6.1. Introduction
  • 6.2. Flowable Bulk-Fill
  • 6.3. Flowable Composite
  • 6.4. Full-Body Bulk Fill
  • 6.5. Micro-Fill Composite
  • 6.6. Micro-Hybrid composite
  • 6.7. Nano-Fill Composite
  • 6.8. Nano-Hybrid Composite

7. Dental Composites Market, by Resin Type

  • 7.1. Introduction
  • 7.2. Bisphenol A-Glycidyl Methacrylate (Bis-GMA)
    • 7.2.1. High Viscosity Bis-GMA
    • 7.2.2. Low Viscosity Bis-GMA
  • 7.3. Triethylene Glycol Dimethacrylate (TEGDMA)
  • 7.4. Urethane Dimethacrylate (UDMA)

8. Dental Composites Market, by Curing Type

  • 8.1. Introduction
  • 8.2. Chemical-Cured Composites
  • 8.3. Light-Cured Composites

9. Dental Composites Market, by Application

  • 9.1. Introduction
  • 9.2. Direct Restorative
    • 9.2.1. Anterior Restorations
    • 9.2.2. Posterior Restorations
  • 9.3. Indirect Restorative
    • 9.3.1. Inlays
    • 9.3.2. Onlays
    • 9.3.3. Veneers
  • 9.4. Prosthetics
    • 9.4.1. Complete Dentures
    • 9.4.2. Partial Dentures

10. Dental Composites Market, by End User

  • 10.1. Introduction
  • 10.2. Dental Academics & Research Institutions
  • 10.3. Dental Clinics & Practices

11. Dental Composites Market, by Distribution Channel

  • 11.1. Introduction
  • 11.2. Dental Distributors & Wholesalers
  • 11.3. Direct Sales
  • 11.4. E-commerce/Online Distribution Platforms

12. Americas Dental Composites Market

  • 12.1. Introduction
  • 12.2. Argentina
  • 12.3. Brazil
  • 12.4. Canada
  • 12.5. Mexico
  • 12.6. United States

13. Asia-Pacific Dental Composites Market

  • 13.1. Introduction
  • 13.2. Australia
  • 13.3. China
  • 13.4. India
  • 13.5. Indonesia
  • 13.6. Japan
  • 13.7. Malaysia
  • 13.8. Philippines
  • 13.9. Singapore
  • 13.10. South Korea
  • 13.11. Taiwan
  • 13.12. Thailand
  • 13.13. Vietnam

14. Europe, Middle East & Africa Dental Composites Market

  • 14.1. Introduction
  • 14.2. Denmark
  • 14.3. Egypt
  • 14.4. Finland
  • 14.5. France
  • 14.6. Germany
  • 14.7. Israel
  • 14.8. Italy
  • 14.9. Netherlands
  • 14.10. Nigeria
  • 14.11. Norway
  • 14.12. Poland
  • 14.13. Qatar
  • 14.14. Russia
  • 14.15. Saudi Arabia
  • 14.16. South Africa
  • 14.17. Spain
  • 14.18. Sweden
  • 14.19. Switzerland
  • 14.20. Turkey
  • 14.21. United Arab Emirates
  • 14.22. United Kingdom

15. Competitive Landscape

  • 15.1. Market Share Analysis, 2024
  • 15.2. FPNV Positioning Matrix, 2024
  • 15.3. Competitive Scenario Analysis
    • 15.3.1. Premier Dental unveils VeneerNow for anterior composite restorations
    • 15.3.2. ACTIVA BioACTIVE bulk flow a next-generation breakthrough in bulk-fill dental restoratives
    • 15.3.3. Parkell unveils Hyperfil Bulk-Fill composite for streamlined restorations
    • 15.3.4. Torch Dental, Bisco, and Young Specialties unite to enhance dental specialty product access
    • 15.3.5. DMG America introduces Ecosite One the universal shade composite
    • 15.3.6. FGM Dental Group amplifies global impact through strategic global expansion
    • 15.3.7. Ultradent unveils transcend universal composite for simplified restorations
  • 15.4. Strategy Analysis & Recommendation
    • 15.4.1. GC Corporation
    • 15.4.2. Ivoclar Vivadent AG
    • 15.4.3. Pulpdent Corporation
    • 15.4.4. Dentsply Sirona Inc.

Companies Mentioned

  • 1. 3M Company
  • 2. Bioloren S.r.l.
  • 3. BISCO, Inc. by EACO Corp.
  • 4. Coltene Group
  • 5. Cosmedent, Inc.
  • 6. Den-Mat Holdings, LLC
  • 7. Dentsply Sirona Inc.
  • 8. DMG Chemisch-Pharmazeutische Fabrik GmbH
  • 9. FGM Dental Group.
  • 10. GC Corporation
  • 11. Ivoclar Vivadent AG
  • 12. J. MORITA CORP
  • 13. Kerr Corporation by Envista Holdings Corporation
  • 14. Kettenbach SNC
  • 15. Kulzer GmbH by Mitsui Chemicals, Inc
  • 16. Kuraray Noritake Dental Inc.
  • 17. Parkell, Inc. by Directa Dental Group
  • 18. Pulpdent Corporation
  • 19. Rident Denpro Pvt Ltd
  • 20. SDI Limited
  • 21. Septodont Holding
  • 22. SHOFU Dental GmbH
  • 23. Tokuyama Dental Corporation
  • 24. Ultradent Products, Inc.
  • 25. VOCO GmbH