|
|
市場調査レポート
商品コード
1588437
延長保証の市場規模、シェア、動向分析レポート:範囲別、流通チャネル別、用途別、最終用途別、セグメント予測、2024年~2030年Extended Warranty Market Size, Share, & Trends Analysis Report By Coverage (Standard Protection Plan, Accidental Protection Plan), By Distribution Channel, By Application, By End Use, And Segment Forecasts, 2024 - 2030 |
||||||

|
|||||||
カスタマイズ可能
|
|||||||

| 延長保証の市場規模、シェア、動向分析レポート:範囲別、流通チャネル別、用途別、最終用途別、セグメント予測、2024年~2030年 |
|
出版日: 2024年10月01日
発行: Grand View Research
ページ情報: 英文 120 Pages
納期: 2~10営業日
|

全表示
- 概要
- 図表
- 目次
延長保証市場の規模と動向:
世界の延長保証市場規模は2023年に1,336億米ドルと推計され、家電・家庭用電化製品の販売急増により、2024年から2030年にかけてCAGR 10.8%で成長すると予測されています。
スマートフォン、ノートパソコン、スマートホームデバイス、キッチン家電の世界の普及に伴い、延長保証の需要が大幅に伸びています。これらの製品は消費者にとって大きな投資であることが多く、消費者は特に修理や交換の場合に、標準的なメーカー保証を超える補償の安心感を求めています。電子機器が高度化し、技術的な故障が発生しやすくなるにつれ、安心のために延長保証を購入する消費者が増えています。
延長保証の利点に関する消費者の意識は著しく高まっています。メーカー、小売業者、第三者プロバイダーは、こうしたプランが提供する経済的保護について消費者を啓蒙するため、マーケティング戦略を改善してきました。eコマース・プラットフォームの普及は、延長保証パッケージを製品に簡単にバンドルすることを容易にし、延長保証の普及をさらに促進しました。より多くの消費者が投資を保護する価値を認識するにつれて、延長保証の利用は着実に増加しています。
オンライン小売の台頭は、プロバイダーが消費者に直接保証を提供する機会を増やし、延長保証市場を支えています。eコマース・プラットフォームは、小売業者が製品を購入する際に延長保証をアップセルすることを可能にし、消費者がこれらのプランに加入することを便利にしています。延長保証商品に特化したオンライン比較ツールやプラットフォームも人気を博しており、消費者は補償オプションについてより多くの情報を得た上で決定することができます。
企業は延長保証を顧客維持のツールとして活用しています。延長保証を提供することで、顧客と製品やブランドとの間に継続的な関係が生まれ、顧客ロイヤリティの向上につながります。多くのメーカーや小売業者は、ワランティをロイヤリティ・プログラムにバンドルしたり、延長補償を購入した消費者に特典を提供したりしています。このような顧客維持の重視は、顧客維持が戦略的優位性をもたらす競争の激しい市場において特に重要です。
目次
第1章 調査手法と範囲
第2章 エグゼクティブサマリー
第3章 延長保証の変数、動向、範囲
- 市場イントロダクション/系統展望
- 業界バリューチェーン分析
- 市場力学
- 市場促進要因分析
- 市場抑制要因分析
- 業界の機会
- 延長保証分析ツール
- ポーターの分析
- PESTEL分析
第4章 延長保証市場: 範囲の推定・動向分析
- セグメントダッシュボード
- 延長保証:範囲の変動分析、2023年および2030年
- 標準保護プラン
- 偶発的な保護
第5章 延長保証市場:流通チャネルの推定・動向分析
- セグメントダッシュボード
- 延長保証:流通チャネル変動分析、2023年および2030年
- メーカー
- 小売業者
- その他
第6章 延長保証市場: 用途の推定・動向分析
- セグメントダッシュボード
- 延長保証:用途変動分析、2023年および2030年
- 自動車
- 家電
- 家電製品
- モバイルデバイスとPC
- その他
第7章 延長保証市場: 最終用途の推定・動向分析
- セグメントダッシュボード
- 延長保証:最終用途変動分析、2023年および2030年
- 個人
- ビジネス
第8章 延長保証市場:地域推定・動向分析
- 延長保証シェア、地域別、2023年および2030年
- 北米
- 範囲別、2018年-2030年
- 流通チャネル別、2018年-2030年
- 用途別、2018年-2030年
- 最終用途別、2018年-2030年
- 米国
- カナダ
- メキシコ
- 欧州
- 範囲別、2018年-2030年
- 流通チャネル別、2018年-2030年
- 用途別、2018年-2030年
- 最終用途別、2018年-2030年
- 英国
- ドイツ
- フランス
- アジア太平洋
- 範囲別、2018年-2030年
- 流通チャネル別、2018年-2030年
- 用途別、2018年-2030年
- 最終用途別、2018年-2030年
- 中国
- インド
- 日本
- オーストラリア
- 韓国
- ラテンアメリカ
- 範囲別、2018年-2030年
- 流通チャネル別、2018年-2030年
- 用途別、2018年-2030年
- 最終用途別、2018年-2030年
- ブラジル
- 中東・アフリカ
- 範囲別、2018年-2030年
- 流通チャネル別、2018年-2030年
- 用途別、2018年-2030年
- 最終用途別、2018年-2030年
- サウジアラビア
- アラブ首長国連邦
- 南アフリカ
第9章 競合情勢
- 主要市場参入企業による最近の動向と影響分析
- 企業分類
- 企業の市場シェア分析
- 企業ヒートマップ分析
- 戦略マッピング
- 拡大
- 合併と買収
- パートナーシップとコラボレーション
- 新製品の発売
- 研究開発
- 企業プロファイル
- American International Group, Inc.
- ASSURANT, INC
- Asurion
- AXA,
- CARCHEX, LLC
- Edel Assurance
- Endurance Warranty Services, LLC
- Liberty Mutual Insurance
- Likewize
- SquareTrade, Inc.
List of Tables
- Table 1 List of Abbreviation
- Table 2 Global extended warranty market, 2018 - 2030 (USD Billion)
- Table 3 Global extended warranty market, by region, 2018 - 2030 (USD Billion)
- Table 4 Global extended warranty market, by coverage, 2018 - 2030 (USD Billion)
- Table 5 Global extended warranty market, by distribution channel, 2018 - 2030 (USD Billion)
- Table 6 Global extended warranty market, by application, 2018 - 2030 (USD Billion)
- Table 7 Global continuous delivery market, by end use, 2018 - 2030 (USD Billion)
- Table 8 Global standard protection plan market by region, 2018 - 2030 (USD Billion)
- Table 9 Global accidental protection plan market by region, 2018 - 2030 (USD Billion)
- Table 10 Global manufacturers market by region, 2018 - 2030 (USD Billion)
- Table 11 Global retailers market by region, 2018 - 2030 (USD Billion)
- Table 12 Global others market by region, 2018 - 2030 (USD Billion)
- Table 13 Global automobiles market by region, 2018 - 2030 (USD Billion)
- Table 14 Global consumer electronics market by region, 2018 - 2030 (USD Billion)
- Table 15 Global home appliances market by region, 2018 - 2030 (USD Billion)
- Table 16 Global mobile devices and PCs market by region, 2018 - 2030 (USD Billion)
- Table 17 Global others market by region, 2018 - 2030 (USD Billion)
- Table 18 Global individuals market by region, 2018 - 2030 (USD Billion)
- Table 19 Global business market by region, 2018 - 2030 (USD Billion)
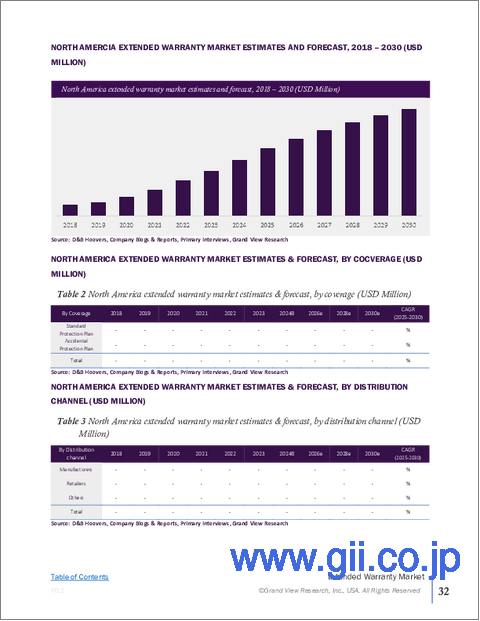
- Table 20 North America extended warranty market, by coverage 2018 - 2030 (USD Billion)
- Table 21 North America extended warranty market, by distribution channel 2018 - 2030 (USD Billion)
- Table 22 North America extended warranty market, by end use 2018 - 2030 (USD Billion)
- Table 23 North America continuous delivery market, by application 2018 - 2030 (USD Billion)
- Table 24 U.S. extended warranty market, by coverage 2018 - 2030 (USD Billion)
- Table 25 U.S. extended warranty market, by distribution channel 2018 - 2030 (USD Billion)
- Table 26 U.S. extended warranty market, by application 2018 - 2030 (USD Billion)
- Table 27 U.S. extended warranty market, by end use 2018 - 2030 (USD Billion)
- Table 28 Canada extended warranty market, by coverage 2018 - 2030 (USD Billion)
- Table 29 Canada extended warranty market, by distribution channel 2018 - 2030 (USD Billion)
- Table 30 Canada extended warranty market, by application 2018 - 2030 (USD Billion)
- Table 31 Canada extended warranty market, by end use 2018 - 2030 (USD Billion)
- Table 32 Mexico extended warranty market, by coverage 2018 - 2030 (USD Billion)
- Table 33 Mexico extended warranty market, by distribution channel 2018 - 2030 (USD Billion)
- Table 34 Mexico extended warranty market, by application 2018 - 2030 (USD Billion)
- Table 35 Mexico extended warranty market, by end use 2018 - 2030 (USD Billion)
- Table 36 Europe extended warranty market, by coverage 2018 - 2030 (USD Billion)
- Table 37 Europe extended warranty market, by distribution channel 2018 - 2030 (USD Billion)
- Table 38 Europe extended warranty market, by application 2018 - 2030 (USD Billion)
- Table 39 Europe extended warranty market, by end use 2018 - 2030 (USD Billion)
- Table 40 U.K. extended warranty market, by coverage 2018 - 2030 (USD Billion)
- Table 41 U.K. extended warranty market, by distribution channel 2018 - 2030 (USD Billion)
- Table 42 U.K. extended warranty market, by application 2018 - 2030 (USD Billion)
- Table 43 U.K. extended warranty market, by end use 2018 - 2030 (USD Billion)
- Table 44 Germany extended warranty market, by coverage 2018 - 2030 (USD Billion)
- Table 45 Germany extended warranty market, by distribution channel 2018 - 2030 (USD Billion)
- Table 46 Germany extended warranty market, by application 2018 - 2030 (USD Billion)
- Table 47 Germany extended warranty market, by end use 2018 - 2030 (USD Billion)
- Table 48 France extended warranty market, by coverage 2018 - 2030 (USD Billion)
- Table 49 France extended warranty market, by distribution channel 2018 - 2030 (USD Billion)
- Table 50 France extended warranty market, by application 2018 - 2030 (USD Billion)
- Table 51 France extended warranty market, by end use 2018 - 2030 (USD Billion)
- Table 52 Asia Pacific extended warranty market, by coverage 2018 - 2030 (USD Billion)
- Table 53 Asia Pacific extended warranty market, by distribution channel 2018 - 2030 (USD Billion)
- Table 54 Asia Pacific extended warranty market, by application 2018 - 2030 (USD Billion)
- Table 55 Asia Pacific extended warranty market, by end use 2018 - 2030 (USD Billion)
- Table 56 China extended warranty market, by coverage 2018 - 2030 (USD Billion)
- Table 57 China extended warranty market, by distribution channel 2018 - 2030 (USD Billion)
- Table 58 China extended warranty market, by application 2018 - 2030 (USD Billion)
- Table 59 China extended warranty market, by end use 2018 - 2030 (USD Billion)
- Table 60 India extended warranty market, by coverage 2018 - 2030 (USD Billion)
- Table 61 India extended warranty market, by distribution channel 2018 - 2030 (USD Billion)
- Table 62 India extended warranty market, by application 2018 - 2030 (USD Billion)
- Table 63 India extended warranty market, by end use 2018 - 2030 (USD Billion)
- Table 64 Japan extended warranty market, by coverage 2018 - 2030 (USD Billion)
- Table 65 Japan extended warranty market, by distribution channel 2018 - 2030 (USD Billion)
- Table 66 Japan extended warranty market, by application 2018 - 2030 (USD Billion)
- Table 67 Japan extended warranty market, by end use 2018 - 2030 (USD Billion)
- Table 68 Australia extended warranty market, by coverage 2018 - 2030 (USD Billion)
- Table 69 Australia extended warranty market, by distribution channel 2018 - 2030 (USD Billion)
- Table 70 Australia extended warranty market, by application 2018 - 2030 (USD Billion)
- Table 71 Australia extended warranty market, by end use 2018 - 2030 (USD Billion)
- Table 72 South Korea extended warranty market, by coverage 2018 - 2030 (USD Billion)
- Table 73 South Korea extended warranty market, by distribution channel 2018 - 2030 (USD Billion)
- Table 74 South Korea extended warranty market, by application 2018 - 2030 (USD Billion)
- Table 75 South Korea extended warranty market, by end use 2018 - 2030 (USD Billion)
- Table 76 Latin America extended warranty market, by coverage 2018 - 2030 (USD Billion)
- Table 77 Latin America extended warranty market, by distribution channel 2018 - 2030 (USD Billion)
- Table 78 Latin America extended warranty market, by application 2018 - 2030 (USD Billion)
- Table 79 Latin America extended warranty market, by end use 2018 - 2030 (USD Billion)
- Table 80 Brazil extended warranty market, by coverage 2018 - 2030 (USD Billion)
- Table 81 Brazil extended warranty market, by distribution channel 2018 - 2030 (USD Billion)
- Table 82 Brazil extended warranty market, by application 2018 - 2030 (USD Billion)
- Table 83 Brazil extended warranty market, by end use 2018 - 2030 (USD Billion)
- Table 84 Middle East & Africa extended warranty market, by coverage 2018 - 2030 (USD Billion)
- Table 85 Middle East & Africa Extended warranty Market, by distribution channel 2018 - 2030 (USD Billion)
- Table 86 Middle East & Africa cloud pos market, by application 2018 - 2030 (USD Billion)
- Table 87 Middle East & Africa cloud pos market, by end use 2018 - 2030 (USD Billion)
- Table 88 UAE extended warranty market, by coverage 2018 - 2030 (USD Billion)
- Table 89 UAE extended warranty market, by distribution channel 2018 - 2030 (USD Billion)
- Table 90 UAE extended warranty market, by application 2018 - 2030 (USD Billion)
- Table 91 UAE extended warranty market, by end use 2018 - 2030 (USD Billion)
- Table 92 Saudi Arabia extended warranty market, by coverage 2018 - 2030 (USD Billion)
- Table 93 Saudi Arabia extended warranty market, by distribution channel 2018 - 2030 (USD Billion)
- Table 94 Saudi Arabia extended warranty market, by application 2018 - 2030 (USD Billion)
- Table 95 Saudi Arabia extended warranty market, by end use 2018 - 2030 (USD Billion)
- Table 96 South Africa extended warranty market, by coverage 2018 - 2030 (USD Billion)
- Table 97 South Africa extended warranty market, by distribution channel 2018 - 2030 (USD Billion)
- Table 98 South Africa extended warranty market, by application 2018 - 2030 (USD Billion)
- Table 99 South Africa extended warranty market, by end use 2018 - 2030 (USD Billion)
List of Figures
- Fig. 1 Extended Warranty Market Segmentation
- Fig. 2 Market landscape
- Fig. 3 Information Procurement
- Fig. 4 Data Analysis Models
- Fig. 5 Market Formulation and Validation
- Fig. 6 Data Validating & Publishing
- Fig. 7 Market Snapshot
- Fig. 8 Segment Snapshot
- Fig. 9 Competitive Landscape Snapshot
- Fig. 10 Extended Warranty: Industry Value Chain Analysis
- Fig. 11 Extended Warranty: Market Dynamics
- Fig. 12 Extended Warranty: PORTER's Analysis
- Fig. 13 Extended Warranty: PESTEL Analysis
- Fig. 14 Extended Warranty Share by Coverage, 2023 & 2030 (USD Billion)
- Fig. 15 Extended Warranty, by Coverage: Market Share, 2023 & 2030
- Fig. 16 Standard Protection Plan Market Estimates and Forecasts, 2018 - 2030 (Revenue, USD Billion)
- Fig. 17 Accidental Protection Plan Market Estimates and Forecasts, 2018 - 2030 (Revenue, USD Billion)
- Fig. 18 Extended Warranty Share by Distribution Channel, 2023 & 2030 (USD Billion)
- Fig. 19 Extended Warranty, by Distribution Channel: Market Share, 2023 & 2030
- Fig. 20 Manufacturers Market Estimates and Forecasts, 2018 - 2030 (Revenue, USD Billion)
- Fig. 21 Retailers Market Estimates and Forecasts, 2018 - 2030 (Revenue, USD Billion)
- Fig. 22 Others Market Estimates and Forecasts, 2018 - 2030 (Revenue, USD Billion)
- Fig. 23 Extended Warranty Share by Application, 2023 & 2030 (USD Billion)
- Fig. 24 Extended Warranty, by Application: Market Share, 2023 & 2030
- Fig. 25 Automobiles Market Estimates and Forecasts, 2018 - 2030 (Revenue, USD Billion)
- Fig. 26 Consumer Electronics Market Estimates and Forecasts, 2018 - 2030 (Revenue, USD Billion)
- Fig. 27 Home Appliances Market Estimates and Forecasts, 2018 - 2030 (Revenue, USD Billion)
- Fig. 28 Mobile Devices and PCs Market Estimates and Forecasts, 2018 - 2030 (Revenue, USD Billion)
- Fig. 29 Others Market Estimates and Forecasts, 2018 - 2030 (Revenue, USD Billion)
- Fig. 30 Extended Warranty Share by End Use, 2023 & 2030 (USD Billion)
- Fig. 31 Extended Warranty, by End Use: Market Share, 2023 & 2030
- Fig. 32 Individuals Market Estimates and Forecasts, 2018 - 2030 (Revenue, USD Billion)
- Fig. 33 Business Market Estimates and Forecasts, 2018 - 2030 (Revenue, USD Billion)
- Fig. 34 Regional Market place: Key Takeaways
- Fig. 35 North America Extended Warranty Market Estimates and Forecasts, 2018 - 2030 (USD Billion)
- Fig. 36 U.S. Extended Warranty Market Estimates and Forecasts, 2018 - 2030 (USD Billion)
- Fig. 37 Canada Extended Warranty Market Estimates and Forecasts, 2018 - 2030 (USD Billion)
- Fig. 38 Mexico Extended Warranty Market Estimates and Forecasts, 2018 - 2030 (USD Billion)
- Fig. 39 Europe Extended Warranty Market Estimates and Forecasts, 2018 - 2030 (USD Billion)
- Fig. 40 U.K. Extended Warranty Market Estimates and Forecasts, 2018 - 2030) (USD Billion)
- Fig. 41 Germany Extended Warranty Market Estimates and Forecasts, (2018 - 2030) (USD Billion)
- Fig. 42 France Extended Warranty Market Estimates and Forecasts, (2018 - 2030) (USD Billion)
- Fig. 43 Asia Pacific Extended Warranty Market Estimates and Forecast, 2018 - 2030 (USD Billion)
- Fig. 44 China Extended Warranty Market Estimates and Forecasts, 2018 - 2030 (USD Billion)
- Fig. 45 India Extended Warranty Market Estimates and Forecasts, 2018 - 2030 (USD Billion)
- Fig. 46 Japan Extended Warranty Market Estimates and Forecasts, 2018 - 2030 (USD Billion)
- Fig. 47 Australia Extended Warranty Market Estimates and Forecasts, 2018 - 2030 (USD Billion)
- Fig. 48 South Korea Extended Warranty Market Estimates and Forecasts, 2018 - 2030 (USD Billion)
- Fig. 49 Latin America Extended Warranty Market Estimates and Forecasts, 2018 - 2030 (USD Billion)
- Fig. 50 Brazil Extended Warranty Market Estimates and Forecasts, 2018 - 2030 (USD Billion)
- Fig. 51 MEA Extended Warranty Market Estimates and Forecasts, 2018 - 2030 (USD Billion)
- Fig. 52 Saudi Arabia Extended Warranty Market Estimates and Forecasts, 2018 - 2030 (USD Billion)
- Fig. 53 UAE Extended Warranty Market Estimates and Forecasts, 2018 - 2030 (USD Billion)
- Fig. 54 South Africa Extended Warranty Market Estimates and Forecasts, 2018 - 2030 (USD Billion)
- Fig. 55 Key Company Categorization
- Fig. 56 Company Market Positioning
- Fig. 57 Key Company Market Share Analysis, 2023
- Fig. 58 Strategic Framework
Extended Warranty Market Size & Trends:
The global extended warranty market size was estimated at USD 133.6 billion in 2023 and is projected to grow at a CAGR of 10.8% from 2024 to 2030 owing to the surge in sales of consumer electronics and home appliances. With the increasing penetration of smartphones, laptops, smart home devices, and kitchen appliances globally, the demand for extended warranties has grown significantly. These products often represent a significant investment for consumers, who seek the reassurance of coverage beyond the standard manufacturer warranty, especially in the case of repairs or replacements. As electronic devices become more sophisticated and prone to technical malfunctions, customers are increasingly purchasing extended warranties for peace of mind.
There has been a significant rise in consumer awareness regarding the benefits of extended warranties. Manufacturers, retailers, and third-party providers have improved their marketing strategies to educate consumers about the financial protection offered by these plans. The proliferation of e-commerce platforms has also facilitated the easy bundling of extended warranty packages with products, further driving their adoption. As more consumers recognize the value of protecting their investments, extended warranty uptake has steadily increased.
The rise of online retail has supported the extended warranty market by creating more opportunities for providers to offer coverage directly to consumers. E-commerce platforms allow retailers to upsell extended warranties while purchasing of products, making it convenient for consumers to opt into these plans. Online comparison tools and platforms that specialize in extended warranty products have also gained popularity, enabling consumers to make more informed decisions about coverage options.
Companies are leveraging extended warranties as a tool for customer retention. Offering extended warranties creates an ongoing relationship between the customer and the product or brand, which can lead to increased customer loyalty. Many manufacturers and retailers bundle warranties with loyalty programs or offer perks to consumers who purchase extended coverage. This focus on retention is particularly important in highly competitive markets, where retaining customers can provide a strategic advantage.
Global Extended Warranty Market Report Segmentation
This report forecasts revenue growth at global, regional, and country levels and provides an analysis of the latest industry trends in each of the sub-segments from 2018 to 2030. For this study, Grand View Research has segmented the global extended warranty market report based on coverage, distribution channel, application, end use, and region.
- Coverage Outlook (Revenue, USD Billion, 2018 - 2030)
- Standard Protection Plan
- Accidental Protection Plan
- Distribution Channel Outlook (Revenue, USD Billion, 2018 - 2030)
- Manufacturers
- Retailers
- Others
- Application Outlook (Revenue, USD Billion, 2018 - 2030)
- Automobiles
- Consumer Electronics
- Home Appliances
- Mobile Devices and PCs
- Others
- End Use Outlook (Revenue, USD Billion, 2018 - 2030)
- Individuals
- Business
- Regional Outlook (Revenue, USD Billion, 2018 - 2030)
- North America
- U.S.
- Canada
- Mexico
- Europe
- Germany
- UK
- France
- Asia Pacific
- China
- India
- Japan
- South Korea
- Australia
- Latin America
- Brazil
- Middle East & Africa
- U.A.E
- Kingdom of Saudi Arabia
- South Africa
Table of Contents
Chapter 1. Methodology and Scope
- 1.1. Methodology segmentation & scope
- 1.2. Market Definitions
- 1.3. Research Methodology
- 1.3.1. Information Procurement
- 1.3.2. Information or Data Analysis
- 1.3.3. Market Formulation & Data Visualization
- 1.3.4. Data Validation & Publishing
- 1.4. Research Scope and Assumptions
- 1.4.1. List of Data Sources
Chapter 2. Executive Summary
- 2.1. Market Outlook
- 2.2. Segment Outlook
- 2.3. Competitive Insights
Chapter 3. Extended Warranty Variables, Trends & Scope
- 3.1. Market Introduction/Lineage Outlook
- 3.2. Industry Value Chain Analysis
- 3.3. Market Dynamics
- 3.3.1. Market Drivers Analysis
- 3.3.2. Market Restraints Analysis
- 3.3.3. Industry Opportunities
- 3.4. Extended Warranty Analysis Tools
- 3.4.1. Porter's Analysis
- 3.4.1.1. Bargaining power of the suppliers
- 3.4.1.2. Bargaining power of the buyers
- 3.4.1.3. Threats of substitution
- 3.4.1.4. Threats from new entrants
- 3.4.2. PESTEL Analysis
- 3.4.2.1. Political landscape
- 3.4.2.2. Economic and Social landscape
- 3.4.2.3. Technological landscape
- 3.4.2.4. Environmental landscape
- 3.4.2.5. Legal landscape
- 3.4.1. Porter's Analysis
Chapter 4. Extended Warranty Market: Coverage Estimates & Trend Analysis
- 4.1. Segment Dashboard
- 4.2. Extended Warranty: Coverage Movement Analysis, 2023 & 2030 (USD Billion)
- 4.3. Standard Protection Plan
- 4.3.1. Market Size Estimates and Forecasts, 2018 - 2030 (USD Billion)
- 4.4. Accidental Protection
- 4.4.1. Market Size Estimates and Forecasts, 2018 - 2030 (USD Billion)
Chapter 5. Extended Warranty Market: Distribution Channel Estimates & Trend Analysis
- 5.1. Segment Dashboard
- 5.2. Extended Warranty: Distribution Channel Movement Analysis, 2023 & 2030 (USD Billion)
- 5.3. Manufacturers
- 5.3.1. Market Size Estimates and Forecasts, 2018 - 2030 (USD Billion)
- 5.4. Retailers
- 5.4.1. Market Size Estimates and Forecasts, 2018 - 2030 (USD Billion)
- 5.5. Others
- 5.5.1. Market Size Estimates and Forecasts, 2018 - 2030 (USD Billion)
Chapter 6. Extended Warranty Market: Application Estimates & Trend Analysis
- 6.1. Segment Dashboard
- 6.2. Extended Warranty: Application Movement Analysis, 2023 & 2030 (USD Billion)
- 6.3. Automobiles
- 6.3.1. Market Size Estimates and Forecasts, 2018 - 2030 (USD Billion)
- 6.4. Consumer Electronics
- 6.4.1. Market Size Estimates and Forecasts, 2018 - 2030 (USD Billion)
- 6.5. Home Appliances
- 6.5.1. Market Size Estimates and Forecasts, 2018 - 2030 (USD Billion)
- 6.6. Mobile Devices and PCs
- 6.6.1. Market Size Estimates and Forecasts, 2018 - 2030 (USD Billion)
- 6.7. Others
- 6.7.1. Market Size Estimates and Forecasts, 2018 - 2030 (USD Billion)
Chapter 7. Extended Warranty Market: End Use Estimates & Trend Analysis
- 7.1. Segment Dashboard
- 7.2. Extended Warranty: End Use Movement Analysis, 2023 & 2030 (USD Billion)
- 7.3. Individuals
- 7.3.1. Market Size Estimates and Forecasts, 2018 - 2030 (USD Billion)
- 7.4. Business
- 7.4.1. Market Size Estimates and Forecasts, 2018 - 2030 (USD Billion)
Chapter 8. Extended Warranty Market: Regional Estimates & Trend Analysis
- 8.1. Extended Warranty Share, By Region, 2023 & 2030 (USD Billion)
- 8.2. North America
- 8.2.1. Market Estimates and Forecasts, 2018 - 2030 (USD Billion)
- 8.2.2. Market estimates and forecast by coverage, 2018 - 2030 (Revenue, USD Billion)
- 8.2.3. Market estimates and forecast by distribution channel, 2018 - 2030 (Revenue, USD Billion)
- 8.2.4. Market estimates and forecast by application, 2018 - 2030 (Revenue, USD Billion)
- 8.2.5. Market estimates and forecast by end use, 2018 - 2030 (Revenue, USD Billion)
- 8.2.6. U.S.
- 8.2.6.1. Market Estimates and Forecasts, 2018 - 2030 (USD Billion)
- 8.2.6.2. Market estimates and forecast by coverage, 2018 - 2030 (Revenue, USD Billion)
- 8.2.6.3. Market estimates and forecast by distribution channel, 2018 - 2030 (Revenue, USD Billion)
- 8.2.6.4. Market estimates and forecast by application, 2018 - 2030 (Revenue, USD Billion)
- 8.2.6.5. Market estimates and forecast by end use, 2018 - 2030 (Revenue, USD Billion)
- 8.2.7. Canada
- 8.2.7.1. Market Estimates and Forecasts, 2018 - 2030 (USD Billion)
- 8.2.7.2. Market estimates and forecast by coverage, 2018 - 2030 (Revenue, USD Billion)
- 8.2.7.3. Market estimates and forecast by distribution channel, 2018 - 2030 (Revenue, USD Billion)
- 8.2.7.4. Market estimates and forecast by application, 2018 - 2030 (Revenue, USD Billion)
- 8.2.7.5. Market estimates and forecast by end use, 2018 - 2030 (Revenue, USD Billion)
- 8.2.8. Mexico
- 8.2.8.1. Market Estimates and Forecasts, 2018 - 2030 (USD Billion)
- 8.2.8.2. Market estimates and forecast by coverage, 2018 - 2030 (Revenue, USD Billion)
- 8.2.8.3. Market estimates and forecast by distribution channel, 2018 - 2030 (Revenue, USD Billion)
- 8.2.8.4. Market estimates and forecast by application, 2018 - 2030 (Revenue, USD Billion)
- 8.2.8.5. Market estimates and forecast by end use, 2018 - 2030 (Revenue, USD Billion)
- 8.3. Europe
- 8.3.1. Market Estimates and Forecasts, 2018 - 2030 (USD Billion)
- 8.3.2. Market estimates and forecast by coverage, 2018 - 2030 (Revenue, USD Billion)
- 8.3.3. Market estimates and forecast by distribution channel, 2018 - 2030 (Revenue, USD Billion)
- 8.3.4. Market estimates and forecast by application, 2018 - 2030 (Revenue, USD Billion)
- 8.3.5. Market estimates and forecast by end use, 2018 - 2030 (Revenue, USD Billion)
- 8.3.6. U.K.
- 8.3.6.1. Market Estimates and Forecasts, 2018 - 2030 (USD Billion)
- 8.3.6.2. Market estimates and forecast by coverage, 2018 - 2030 (Revenue, USD Billion)
- 8.3.6.3. Market estimates and forecast by distribution channel, 2018 - 2030 (Revenue, USD Billion)
- 8.3.6.4. Market estimates and forecast by application, 2018 - 2030 (Revenue, USD Billion)
- 8.3.6.5. Market estimates and forecast by end use, 2018 - 2030 (Revenue, USD Billion)
- 8.3.7. Germany
- 8.3.7.1. Market Estimates and Forecasts, 2018 - 2030 (USD Billion)
- 8.3.7.2. Market estimates and forecast by coverage, 2018 - 2030 (Revenue, USD Billion)
- 8.3.7.3. Market estimates and forecast by distribution channel, 2018 - 2030 (Revenue, USD Billion)
- 8.3.7.4. Market estimates and forecast by application, 2018 - 2030 (Revenue, USD Billion)
- 8.3.7.5. Market estimates and forecast by end use, 2018 - 2030 (Revenue, USD Billion)
- 8.3.8. France
- 8.3.8.1. Market Estimates and Forecasts, 2018 - 2030 (USD Billion)
- 8.3.8.2. Market estimates and forecast by coverage, 2018 - 2030 (Revenue, USD Billion)
- 8.3.8.3. Market estimates and forecast by distribution channel, 2018 - 2030 (Revenue, USD Billion)
- 8.3.8.4. Market estimates and forecast by application, 2018 - 2030 (Revenue, USD Billion)
- 8.3.8.5. Market estimates and forecast by end use, 2018 - 2030 (Revenue, USD Billion)
- 8.4. Asia Pacific
- 8.4.1. Market Estimates and Forecasts, 2018 - 2030 (USD Billion)
- 8.4.2. Market estimates and forecast by coverage, 2018 - 2030 (Revenue, USD Billion)
- 8.4.3. Market estimates and forecast by distribution channel, 2018 - 2030 (Revenue, USD Billion)
- 8.4.4. Market estimates and forecast by application, 2018 - 2030 (Revenue, USD Billion)
- 8.4.5. Market estimates and forecast by end use, 2018 - 2030 (Revenue, USD Billion)
- 8.4.6. China
- 8.4.6.1. Market Estimates and Forecasts, 2018 - 2030 (USD Billion)
- 8.4.6.2. Market estimates and forecast by coverage, 2018 - 2030 (Revenue, USD Billion)
- 8.4.6.3. Market estimates and forecast by distribution channel, 2018 - 2030 (Revenue, USD Billion)
- 8.4.6.4. Market estimates and forecast by application, 2018 - 2030 (Revenue, USD Billion)
- 8.4.6.5. Market estimates and forecast by end use, 2018 - 2030 (Revenue, USD Billion)
- 8.4.7. India
- 8.4.7.1. Market Estimates and Forecasts, 2018 - 2030 (USD Billion)
- 8.4.7.2. Market estimates and forecast by coverage, 2018 - 2030 (Revenue, USD Billion)
- 8.4.7.3. Market estimates and forecast by distribution channel, 2018 - 2030 (Revenue, USD Billion)
- 8.4.7.4. Market estimates and forecast by application, 2018 - 2030 (Revenue, USD Billion)
- 8.4.7.5. Market estimates and forecast by end use, 2018 - 2030 (Revenue, USD Billion)
- 8.4.8. Japan
- 8.4.8.1. Market Estimates and Forecasts, 2018 - 2030 (USD Billion)
- 8.4.8.2. Market estimates and forecast by coverage, 2018 - 2030 (Revenue, USD Billion)
- 8.4.8.3. Market estimates and forecast by distribution channel, 2018 - 2030 (Revenue, USD Billion)
- 8.4.8.4. Market estimates and forecast by application, 2018 - 2030 (Revenue, USD Billion)
- 8.4.8.5. Market estimates and forecast by end use, 2018 - 2030 (Revenue, USD Billion)
- 8.4.9. Australia
- 8.4.9.1. Market Estimates and Forecasts, 2018 - 2030 (USD Billion)
- 8.4.9.2. Market estimates and forecast by coverage, 2018 - 2030 (Revenue, USD Billion)
- 8.4.9.3. Market estimates and forecast by distribution channel, 2018 - 2030 (Revenue, USD Billion)
- 8.4.9.4. Market estimates and forecast by application, 2018 - 2030 (Revenue, USD Billion)
- 8.4.9.5. Market estimates and forecast by end use, 2018 - 2030 (Revenue, USD Billion)
- 8.4.10. South Korea
- 8.4.10.1. Market Estimates and Forecasts, 2018 - 2030 (USD Billion)
- 8.4.10.2. Market estimates and forecast by coverage, 2018 - 2030 (Revenue, USD Billion)
- 8.4.10.3. Market estimates and forecast by distribution channel, 2018 - 2030 (Revenue, USD Billion)
- 8.4.10.4. Market estimates and forecast by application, 2018 - 2030 (Revenue, USD Billion)
- 8.4.10.5. Market estimates and forecast by end use, 2018 - 2030 (Revenue, USD Billion)
- 8.5. Latin America
- 8.5.1. Market Estimates and Forecasts, 2018 - 2030 (USD Billion)
- 8.5.2. Market estimates and forecast by coverage, 2018 - 2030 (Revenue, USD Billion)
- 8.5.3. Market estimates and forecast by distribution channel, 2018 - 2030 (Revenue, USD Billion)
- 8.5.4. Market estimates and forecast by application, 2018 - 2030 (Revenue, USD Billion)
- 8.5.5. Market estimates and forecast by end use, 2018 - 2030 (Revenue, USD Billion)
- 8.5.6. Brazil
- 8.5.6.1. Market Estimates and Forecasts, 2018 - 2030 (USD Billion)
- 8.5.6.2. Market estimates and forecast by coverage, 2018 - 2030 (Revenue, USD Billion)
- 8.5.6.3. Market estimates and forecast by distribution channel, 2018 - 2030 (Revenue, USD Billion)
- 8.5.6.4. Market estimates and forecast by application, 2018 - 2030 (Revenue, USD Billion)
- 8.5.6.5. Market estimates and forecast by end use, 2018 - 2030 (Revenue, USD Billion)
- 8.6. Middle East & Africa
- 8.6.1. Market Estimates and Forecasts, 2018 - 2030 (USD Billion)
- 8.6.2. Market estimates and forecast by coverage, 2018 - 2030 (Revenue, USD Billion)
- 8.6.3. Market estimates and forecast by distribution channel, 2018 - 2030 (Revenue, USD Billion)
- 8.6.4. Market estimates and forecast by application, 2018 - 2030 (Revenue, USD Billion)
- 8.6.5. Market estimates and forecast by end use, 2018 - 2030 (Revenue, USD Billion)
- 8.6.6. Saudi Arabia
- 8.6.6.1. Market Estimates and Forecasts, 2018 - 2030 (USD Billion)
- 8.6.6.2. Market estimates and forecast by coverage, 2018 - 2030 (Revenue, USD Billion)
- 8.6.6.3. Market estimates and forecast by distribution channel, 2018 - 2030 (Revenue, USD Billion)
- 8.6.6.4. Market estimates and forecast by application, 2018 - 2030 (Revenue, USD Billion)
- 8.6.6.5. Market estimates and forecast by end use, 2018 - 2030 (Revenue, USD Billion)
- 8.6.7. UAE
- 8.6.7.1. Market Estimates and Forecasts, 2018 - 2030 (USD Billion)
- 8.6.7.2. Market estimates and forecast by coverage, 2018 - 2030 (Revenue, USD Billion)
- 8.6.7.3. Market estimates and forecast by distribution channel, 2018 - 2030 (Revenue, USD Billion)
- 8.6.7.4. Market estimates and forecast by application, 2018 - 2030 (Revenue, USD Billion)
- 8.6.7.5. Market estimates and forecast by end use, 2018 - 2030 (Revenue, USD Billion)
- 8.6.8. South Africa
- 8.6.8.1. Market Estimates and Forecasts, 2018 - 2030 (USD Billion)
- 8.6.8.2. Market estimates and forecast by coverage, 2018 - 2030 (Revenue, USD Billion)
- 8.6.8.3. Market estimates and forecast by distribution channel, 2018 - 2030 (Revenue, USD Billion)
- 8.6.8.4. Market estimates and forecast by application, 2018 - 2030 (Revenue, USD Billion)
- 8.6.8.5. Market estimates and forecast by end use, 2018 - 2030 (Revenue, USD Billion)
Chapter 9. Competitive Landscape
- 9.1. Recent Developments & Impact Analysis by Key Market Participants
- 9.2. Company Categorization
- 9.3. Company Market Share Analysis
- 9.4. Company Heat Map Analysis
- 9.5. Strategy Mapping
- 9.5.1. Expansion
- 9.5.2. Mergers & Acquisition
- 9.5.3. Partnerships & Collaborations
- 9.5.4. New Product Launches
- 9.5.5. Research And Development
- 9.6. Company Profiles
- 9.6.1. American International Group, Inc.
- 9.6.1.1. Participant's Overview
- 9.6.1.2. Financial Performance
- 9.6.1.3. Product Benchmarking
- 9.6.1.4. Recent Developments
- 9.6.2. ASSURANT, INC
- 9.6.2.1. Participant's Overview
- 9.6.2.2. Financial Performance
- 9.6.2.3. Product Benchmarking
- 9.6.2.4. Recent Developments
- 9.6.3. Asurion
- 9.6.3.1. Participant's Overview
- 9.6.3.2. Financial Performance
- 9.6.3.3. Product Benchmarking
- 9.6.3.4. Recent Developments
- 9.6.4. AXA,
- 9.6.4.1. Participant's Overview
- 9.6.4.2. Financial Performance
- 9.6.4.3. Product Benchmarking
- 9.6.4.4. Recent Developments
- 9.6.5. CARCHEX, LLC
- 9.6.5.1. Participant's Overview
- 9.6.5.2. Financial Performance
- 9.6.5.3. Product Benchmarking
- 9.6.5.4. Recent Developments
- 9.6.6. Edel Assurance
- 9.6.6.1. Participant's Overview
- 9.6.6.2. Financial Performance
- 9.6.6.3. Product Benchmarking
- 9.6.6.4. Recent Developments
- 9.6.7. Endurance Warranty Services, LLC
- 9.6.7.1. Participant's Overview
- 9.6.7.2. Financial Performance
- 9.6.7.3. Product Benchmarking
- 9.6.7.4. Recent Developments
- 9.6.8. Liberty Mutual Insurance
- 9.6.8.1. Participant's Overview
- 9.6.8.2. Financial Performance
- 9.6.8.3. Product Benchmarking
- 9.6.8.4. Recent Developments
- 9.6.9. Likewize
- 9.6.9.1. Participant's Overview
- 9.6.9.2. Financial Performance
- 9.6.9.3. Product Benchmarking
- 9.6.9.4. Recent Developments
- 9.6.10. SquareTrade, Inc.
- 9.6.10.1. Participant's Overview
- 9.6.10.2. Financial Performance
- 9.6.10.3. Product Benchmarking
- 9.6.10.4. Recent Developments
- 9.6.1. American International Group, Inc.

