|
|
市場調査レポート
商品コード
1587840
自動車用金属プレスの市場規模、シェア、動向分析レポート:プロセス別、用途別、地域別、セグメント予測、2025~2030年Automotive Metal Stamping Market Size, Share & Trends Analysis Report By Process (Blanking, Embossing, Bending, Coining, Flanging), By Application (Passenger Cars), By Region, And Segment Forecasts, 2025 - 2030 |
||||||

|
|||||||
カスタマイズ可能
|
|||||||

| 自動車用金属プレスの市場規模、シェア、動向分析レポート:プロセス別、用途別、地域別、セグメント予測、2025~2030年 |
|
出版日: 2024年10月24日
発行: Grand View Research
ページ情報: 英文 100 Pages
納期: 2~10営業日
|

全表示
- 概要
- 図表
- 目次
自動車用金属プレス市場の成長と動向:
Grand View Research, Inc.の最新レポートによると、世界の自動車用金属プレス市場規模は2030年までに1,132億米ドルに達すると推定され、2025年から2030年にかけてCAGR 4.9%で成長する見込みです。
この産業は、自動車産業における需要の高まりと低い製造コストによって成長すると予測されています。自動車シャーシ、トランスミッション部品、内装・外装構造部品の生産における板金使用量の増加が、予測期間中の市場成長を促進すると予想されます。
チタン、鋳造アルミニウム、鋳鉄、鍛造鋼などの合金の使用が増加し、現在も自動車エンジンの不可欠な部分を形成しています。さらに、スタンピング時のひずみ分布を制御することで故障を大幅に減少させるハイブリッド電磁アシスト板金スタンピングマシンの使用を含む技術の進歩は、業界の成長にプラスの影響を与えると予想されます。
アジア太平洋とラテンアメリカの自動車製造部門は急速に発展しており、海外の大手OEMが現地の自動車需要を取り込むために生産工場を設立しています。これにより、これらの地域への技術移転が可能になり、今後8年間の業界成長が促進されます。
自動車用金属プレス市場レポートハイライト
- ブランキングセグメントが2024年に39.3%と最大のシェアを占めたのは、その広範な用途と製造工程にもたらす効率性のためです。ブランキングにより、正確で一貫した部品生産が可能になり、材料の無駄が減り、高品質な成果物が得られます。
- 乗用車セグメントは、先進経済諸国と新興経済諸国向けに世界中で生産される乗用車の膨大な量により、2024年に自動車用金属プレスの世界市場を独占しました。
- 北米は2024年に自動車用金属プレスの世界市場で27.7%の売上シェアを占めたが、これは同地域の自動車産業が堅調で、主要市場プレイヤーの存在感が強く、自動車技術の進歩が続いていることが特徴であるためです。
目次
第1章 調査手法と範囲
第2章 エグゼクティブサマリー
第3章 自動車用金属プレス市場の変数、動向、範囲
- 世界の自動車用金属プレス市場の見通し
- 業界バリューチェーン分析
- プロセスの概要
- 平均価格動向分析
- 需給ギャップ分析、2024年
- 規制の枠組み
- ポリシーとインセンティブプラン
- 標準とコンプライアンス
- 規制影響分析
- 市場力学
- 市場 促進要因分析
- 市場抑制要因分析
- 業界の課題
- ポーターのファイブフォース分析
- サプライヤーの力
- 買い手の力
- 代替の脅威
- 新規参入の脅威
- 競争企業間の敵対関係
- PESTEL分析
- 政治情勢
- 経済情勢
- 社会情勢
- 技術的情勢
- 環境情勢
- 法的な情勢
第4章 自動車用金属プレス市場:プロセス別展望の推定と予測
- 自動車用金属プレス市場:プロセス変動分析、2024年および2030年
- ブランク
- エンボス加工
- べディング
- コイニング
- フランジング
- その他
第5章 自動車用金属プレス市場:用途別展望の推定と予測
- 自動車用金属プレス市場:用途変動分析、2024年および2030年
- 乗用車
- 小型商用車
- 大型商用車
- レクリエーション用車両
第6章 自動車用金属プレス市場:地域別展望と予測
- 地域スナップショット
- 自動車用金属プレス市場:地域変動分析、2024年および2030年
- 北米
- 市場推計・予測、2018年-2030年
- プロセス別、2018年-2030年
- 用途別、2018年-2030年
- 米国
- カナダ
- メキシコ
- 欧州
- 市場推計・予測、2018年-2030年
- プロセス別、2018年-2030年
- 用途別、2018年-2030年
- ドイツ
- 英国
- イタリア
- アジア太平洋
- 市場推計・予測、2018年-2030年
- プロセス別、2018年-2030年
- 用途別、2018年-2030年
- 中国
- 日本
- インド
- ラテンアメリカ
- 市場推計・予測、2018年-2030年
- プロセス別、2018年-2030年
- 用途別、2018年-2030年
- ブラジル
- 中東・アフリカ
- 市場推計・予測、2018年-2030年
- プロセス別、2018年-2030年
- 用途別、2018年-2030年
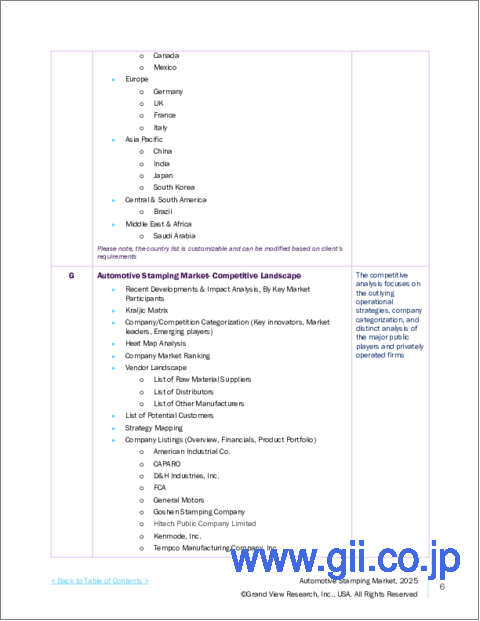
第7章 競合情勢
- 主要市場参入企業による最近の動向と影響分析
- ベンダー情勢
- 企業分類
- 主要販売代理店およびチャネルパートナーのリスト
- 潜在顧客/エンドユーザーのリスト
- 競争のダイナミクス
- 競合ベンチマーキング
- 戦略マッピング
- ヒートマップ分析
- 企業プロファイル
- Hitech Public Company Limited
- American Industrial Co.
- CAPARO
- D&H Industries, Inc.
- FCA
- Ford Motor Company
- General Motors
- Gestamp
- Goshen Stamping Company
- Kenmode, Inc.
- Nissan Motor Co., Ltd
- Tempco Manufacturing Company, Inc
List of Tables
- Table 1 List of abbreviations
- Table 2 Automotive metal stamping market estimates and forecasts, by process, 2018 - 2030 (USD Million)
- Table 3 Automotive metal stamping market estimates and forecasts, by application, 2018 - 2030 (USD Million)
- Table 4 Automotive metal stamping market estimates and forecasts, by region, 2018 - 2030 (USD Million)
- Table 5 North America automotive metal stamping market estimates and forecasts, by country, 2018 - 2030 (USD Million)
- Table 6 North America automotive metal stamping market estimates and forecasts, by process, 2018 - 2030 (USD Million)
- Table 7 North America automotive metal stamping market estimates and forecasts, by application, 2018 - 2030 (USD Million)
- Table 8 U.S. automotive metal stamping market estimates and forecasts, by process, 2018 - 2030 (USD Million)
- Table 9 U.S. automotive metal stamping market estimates and forecasts, by application, 2018 - 2030 (USD Million)
- Table 10 Canada automotive metal stamping market estimates and forecasts, by process, 2018 - 2030 (USD Million)
- Table 11 Canada automotive metal stamping market estimates and forecasts, by application, 2018 - 2030 (USD Million)
- Table 12 Mexico automotive metal stamping market estimates and forecasts, by process, 2018 - 2030 (USD Million)
- Table 13 Mexico automotive metal stamping market estimates and forecasts, by application, 2018 - 2030 (USD Million)
- Table 14 Europe automotive metal stamping market estimates and forecasts, by country, 2018 - 2030 (USD Million)
- Table 15 Europe automotive metal stamping market estimates and forecasts, by process, 2018 - 2030 (USD Million)
- Table 16 Europe automotive metal stamping market estimates and forecasts, by application, 2018 - 2030 (USD Million)
- Table 17 Germany automotive metal stamping market estimates and forecasts, by process, 2018 - 2030 (USD Million)
- Table 18 Germany automotive metal stamping market estimates and forecasts, by application, 2018 - 2030 (USD Million)
- Table 19 UK automotive metal stamping market estimates and forecasts, by process, 2018 - 2030 (USD Million)
- Table 20 UK automotive metal stamping market estimates and forecasts, by application, 2018 - 2030 (USD Million)
- Table 21 Italy automotive metal stamping market estimates and forecasts, by process, 2018 - 2030 (USD Million)
- Table 22 Italy automotive metal stamping market estimates and forecasts, by application, 2018 - 2030 (USD Million)
- Table 23 Asia Pacific automotive metal stamping market estimates and forecasts, by country, 2018 - 2030 (USD Million)
- Table 24 Asia Pacific automotive metal stamping market estimates and forecasts, by process, 2018 - 2030 (USD Million)
- Table 25 Asia Pacific automotive metal stamping market estimates and forecasts, by application, 2018 - 2030 (USD Million)
- Table 26 China automotive metal stamping market estimates and forecasts, by process, 2018 - 2030 (USD Million)
- Table 27 China automotive metal stamping market estimates and forecasts, by application, 2018 - 2030 (USD Million)
- Table 28 Japan automotive metal stamping market estimates and forecasts, by process, 2018 - 2030 (USD Million)
- Table 29 Japan automotive metal stamping market estimates and forecasts, by application, 2018 - 2030 (USD Million)
- Table 30 India automotive metal stamping market estimates and forecasts, by process, 2018 - 2030 (USD Million)
- Table 31 India automotive metal stamping market estimates and forecasts, by application, 2018 - 2030 (USD Million)
- Table 32 Latin America automotive metal stamping market estimates and forecasts, by country, 2018 - 2030 (USD Million)
- Table 33 Latin America automotive metal stamping market estimates and forecasts, by process, 2018 - 2030 (USD Million)
- Table 34 Latin America automotive metal stamping market estimates and forecasts, by application, 2018 - 2030 (USD Million)
- Table 35 Brazil automotive metal stamping market estimates and forecasts, by process, 2018 - 2030 (USD Million)
- Table 36 Brazil automotive metal stamping market estimates and forecasts, by application, 2018 - 2030 (USD Million)
- Table 37 Middle East & Africa automotive metal stamping market estimates and forecasts, by country, 2018 - 2030 (USD Million)
- Table 38 Middle East & Africa automotive metal stamping market estimates and forecasts, by process, 2018 - 2030 (USD Million)
- Table 39 Middle East & Africa automotive metal stamping market estimates and forecasts, by application, 2018 - 2030 (USD Million)
List of Figures
- Fig. 1 Market segmentation
- Fig. 2 Information procurement
- Fig. 3 Data analysis models
- Fig. 4 Market formulation and validation
- Fig. 5 Market snapshot
- Fig. 6 Segment outlook
- Fig. 7 Competitive outlook
- Fig. 8 Value chain analysis
- Fig. 9 Market dynamics
- Fig. 10 Porter's analysis
- Fig. 11 PESTEL analysis
- Fig. 12 Automotive metal stamping market, by process: Key takeaways
- Fig. 13 Automotive metal stamping market, by process: Market share, 2024 & 2030
- Fig. 14 Blanking market, 2018 - 2030 (USD Million)
- Fig. 15 Embossing market, 2018 - 2030 (USD Million)
- Fig. 16 Bending market, 2018 - 2030 (USD Million)
- Fig. 17 Coining market, 2018 - 2030 (USD Million)
- Fig. 18 Flanging market, 2018 - 2030 (USD Million)
- Fig. 19 Others market, 2018 - 2030 (USD Million)
- Fig. 20 Automotive metal stamping market, by application: Key takeaways
- Fig. 21 Automotive metal stamping market, by application: Market share, 2024 & 2030
- Fig. 22 Passenger cars market, 2018 - 2030 (USD Million)
- Fig. 23 Light commercial vehicles market, 2018 - 2030 (USD Million)
- Fig. 24 Heavy commercial vehicles market, 2018 - 2030 (USD Million)
- Fig. 25 Recreational vehicles market, 2018 - 2030 (USD Million)
- Fig. 26 Automotive metal stamping market, by region: Key takeaways
- Fig. 27 Automotive metal stamping market, by region: Market share, 2024 & 2030
- Fig. 28 North America market, 2018 - 2030 (USD Million)
- Fig. 29 U.S. market, 2018 - 2030 (USD Million)
- Fig. 30 Canada market, 2018 - 2030 (USD Million)
- Fig. 31 Mexico market, 2018 - 2030 (USD Million)
- Fig. 32 Europe market, 2018 - 2030 (USD Million)
- Fig. 33 Germany market, 2018 - 2030 (USD Million)
- Fig. 34 UK market, 2018 - 2030 (USD Million)
- Fig. 35 Italy market, 2018 - 2030 (USD Million)
- Fig. 36 Asia Pacific market, 2018 - 2030 (USD Million)
- Fig. 37 China market, 2018 - 2030 (USD Million)
- Fig. 38 India market, 2018 - 2030 (USD Million)
- Fig. 39 Japan market, 2018 - 2030 (USD Million)
- Fig. 40 Latin America market, 2018 - 2030 (USD Million)
- Fig. 41 Brazil market, 2018 - 2030 (USD Million)
- Fig. 42 MEA market, 2018 - 2030 (USD Million)
Automotive Metal Stamping Market Growth & Trends:
The global automotive metal stamping market size is estimated to reach USD 113.2 billion by 2030, registering to grow at a CAGR of 4.9% from 2025 to 2030 according to a new report by Grand View Research, Inc. The industry is anticipated to grow owing to the rising demand in automotive industry and low manufacturing cost. Increasing sheet metal usage in the production of automobile chassis, transmission components, interior & exterior structural components are expected to drive market growth over the forecast period.
Growing use of alloys such as titanium, cast aluminum, cast iron, and forged steel still form an integral part of automotive engines. Furthermore, technological advancements including the use of hybrid electromagnetically assisted sheet metal stamping machines which significantly reduces failures by controlling the strain distribution during stamping is expected to have a positive impact on industry growth.
The automotive manufacturing sector in Asia Pacific and Latin America is rapidly developing with major overseas OEMs establishing production plants to capture the local automobile demand. This has enabled technology transfer to these regions, thus promoting industry growth over the next eight years.
Automotive Metal Stamping Market Report Highlights:
- The blanking segment accounted for the largest share, 39.3%, in 2024 due to its widespread application and the efficiency it brings to the manufacturing process. Blanking allows for precise and consistent production of parts, reducing material waste and ensuring high-quality outcomes.
- The passenger cars segment dominated the global automotive metal stamping market in 2024 due to the sheer volume of passenger vehicles produced worldwide, catering to developed and emerging economies.
- North America accounted for a 27.7% revenue share of the global automotive metal stamping market in 2024 due to the robust automotive industry in the region, characterized by a strong presence of key market players and ongoing advancements in automotive technology.
Table of Contents
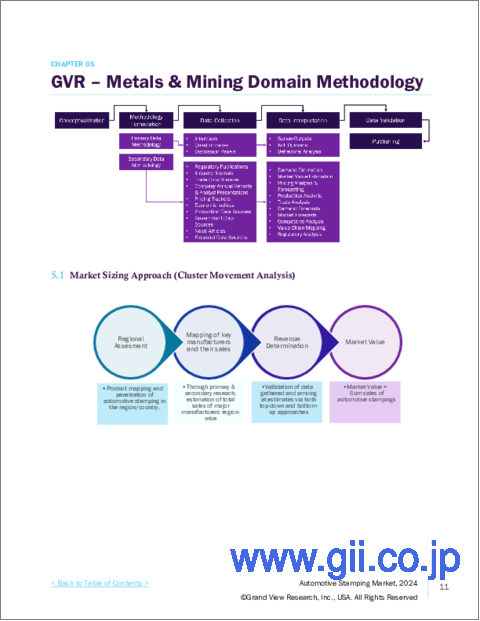
Chapter 1. Methodology and Scope
- 1.1. Market Segmentation & Scope
- 1.2. Market Definition
- 1.3. Information Procurement
- 1.3.1. Purchased Database
- 1.3.2. GVR's Internal Database
- 1.3.3. Secondary Sources & Third-Party Perspectives
- 1.3.4. Primary Research
- 1.4. Information Analysis
- 1.4.1. Data Analysis Models
- 1.5. Market Formulation & Data Visualization
- 1.6. Data Validation & Publishing
Chapter 2. Executive Summary
- 2.1. Market Insights
- 2.2. Segmental Outlook
- 2.3. Competitive Outlook
Chapter 3. Automotive Metal Stamping Market Variables, Trends & Scope
- 3.1. Global Automotive Metal Stamping Market Outlook
- 3.2. Industry Value Chain Analysis
- 3.3. Process Overview
- 3.4. Average Price Trend Analysis
- 3.5. Supply-Demand GAP Analysis, 2024
- 3.6. Regulatory Framework
- 3.6.1. Policies and Incentive Plans
- 3.6.2. Standards and Compliances
- 3.6.3. Regulatory Impact Analysis
- 3.7. Market Dynamics
- 3.7.1. Market Driver Analysis
- 3.7.2. Market Restraint Analysis
- 3.7.3. Industry Challenges
- 3.8. Porter's Five Forces Analysis
- 3.8.1. Supplier Power
- 3.8.2. Buyer Power
- 3.8.3. Substitution Threat
- 3.8.4. Threat from New Entrant
- 3.8.5. Competitive Rivalry
- 3.9. PESTEL Analysis
- 3.9.1. Political Landscape
- 3.9.2. Economic Landscape
- 3.9.3. Social Landscape
- 3.9.4. Technological Landscape
- 3.9.5. Environmental Landscape
- 3.9.6. Legal Landscape
Chapter 4. Automotive Metal Stamping Market: Process Outlook Estimates & Forecasts
- 4.1. Automotive Metal Stamping Market: Process Movement Analysis, 2024 & 2030
- 4.1.1. Blanking
- 4.1.1.1. Blanking Market estimates and forecast, 2018 - 2030 (USD Million)
- 4.1.2. Embossing
- 4.1.2.1. Embossing Market estimates and forecast, 2018 - 2030 (USD Million)
- 4.1.3. Bending
- 4.1.3.1. Bending Market estimates and forecast, 2018 - 2030 (USD Million)
- 4.1.4. Coining
- 4.1.4.1. Coining Market estimates and forecast, 2018 - 2030 (USD Million)
- 4.1.5. Flanging
- 4.1.5.1. Flanging Market estimates and forecast, 2018 - 2030 (USD Million)
- 4.1.6. Others
- 4.1.6.1. Others Market estimates and forecast, 2018 - 2030 (USD Million)
- 4.1.1. Blanking
Chapter 5. Automotive Metal Stamping Market: Application Outlook Estimates & Forecasts
- 5.1. Automotive Metal Stamping Market: Application Movement Analysis, 2024 & 2030
- 5.1.1. Passenger Cars
- 5.1.1.1. Passenger Cars Market estimates and forecast, 2018 - 2030 (USD Million)
- 5.1.2. Light Commercial Vehicles
- 5.1.2.1. Light Commercial Vehicles Market estimates and forecast, 2018 - 2030 (USD Million)
- 5.1.3. Heavy Commercial Vehicles
- 5.1.3.1. Heavy Commercial Vehicles Market estimates and forecast, 2018 - 2030 (USD Million)
- 5.1.4. Recreational Vehicles
- 5.1.4.1. Recreational Vehicles Market estimates and forecast, 2018 - 2030 (USD Million)
- 5.1.1. Passenger Cars
Chapter 6. Automotive metal stamping Market Regional Outlook Estimates & Forecasts
- 6.1. Regional Snapshot
- 6.2. Automotive Metal Stamping Market: Regional Movement Analysis, 2024 & 2030
- 6.3. North America
- 6.3.1. Market estimates and forecast, 2018 - 2030 (USD Million)
- 6.3.2. Market estimates and forecast, by process, 2018 - 2030 (USD Million)
- 6.3.3. Market estimates and forecast, by application, 2018 - 2030 (USD Million)
- 6.3.4. U.S.
- 6.3.4.1. Market estimates and forecast, by process, 2018 - 2030 (USD Million)
- 6.3.4.2. Market estimates and forecast, by application, 2018 - 2030 (USD Million)
- 6.3.5. Canada
- 6.3.5.1. Market estimates and forecast, by process, 2018 - 2030 (USD Million)
- 6.3.5.2. Market estimates and forecast, by application, 2018 - 2030 (USD Million)
- 6.3.6. Mexico
- 6.3.6.1. Market estimates and forecast, by process, 2018 - 2030 (USD Million)
- 6.3.6.2. Market estimates and forecast, by application, 2018 - 2030 (USD Million)
- 6.4. Europe
- 6.4.1. Market estimates and forecast, 2018 - 2030 (USD Million)
- 6.4.2. Market estimates and forecast, by process, 2018 - 2030 (USD Million)
- 6.4.3. Market estimates and forecast, by application, 2018 - 2030 (USD Million)
- 6.4.4. Germany
- 6.4.4.1. Market estimates and forecast, by process, 2018 - 2030 (USD Million)
- 6.4.4.2. Market estimates and forecast, by application, 2018 - 2030 (USD Million)
- 6.4.5. UK
- 6.4.5.1. Market estimates and forecast, by process, 2018 - 2030 (USD Million)
- 6.4.5.2. Market estimates and forecast, by application, 2018 - 2030 (USD Million)
- 6.4.6. Italy
- 6.4.6.1. Market estimates and forecast, by process, 2018 - 2030 (USD Million)
- 6.4.6.2. Market estimates and forecast, by application, 2018 - 2030 (USD Million)
- 6.5. Asia Pacific
- 6.5.1. Market estimates and forecast, 2018 - 2030 (USD Million)
- 6.5.2. Market estimates and forecast, by process, 2018 - 2030 (USD Million)
- 6.5.3. Market estimates and forecast, by application, 2018 - 2030 (USD Million)
- 6.5.4. China
- 6.5.4.1. Market estimates and forecast, by process, 2018 - 2030 (USD Million)
- 6.5.4.2. Market estimates and forecast, by application, 2018 - 2030 (USD Million)
- 6.5.5. Japan
- 6.5.5.1. Market estimates and forecast, by process, 2018 - 2030 (USD Million)
- 6.5.5.2. Market estimates and forecast, by application, 2018 - 2030 (USD Million)
- 6.5.6. India
- 6.5.6.1. Market estimates and forecast, by process, 2018 - 2030 (USD Million)
- 6.5.6.2. Market estimates and forecast, by application, 2018 - 2030 (USD Million)
- 6.6. Latin America
- 6.6.1. Market estimates and forecast, 2018 - 2030 (USD Million)
- 6.6.2. Market estimates and forecast, by process, 2018 - 2030 (USD Million)
- 6.6.3. Market estimates and forecast, by application, 2018 - 2030 (USD Million)
- 6.6.4. Brazil
- 6.6.4.1. Market estimates and forecast, by process, 2018 - 2030 (USD Million)
- 6.6.4.2. Market estimates and forecast, by application, 2018 - 2030 (USD Million)
- 6.7. Middle East & Africa
- 6.7.1. Market estimates and forecast, 2018 - 2030 (USD Million)
- 6.7.2. Market estimates and forecast, by process, 2018 - 2030 (USD Million)
- 6.7.3. Market estimates and forecast, by application, 2018 - 2030 (USD Million)
Chapter 7. Competitive Landscape
- 7.1. Recent Developments & Impact Analysis, By Key Market Participants
- 7.2. Vendor Landscape
- 7.2.1. Company categorization
- 7.2.2. List of Key Distributors and Channel Partners
- 7.2.3. List of Potential Customers/End Users
- 7.3. Competitive Dynamics
- 7.3.1. Competitive Benchmarking
- 7.3.2. Strategy Mapping
- 7.3.3. Heat Map Analysis
- 7.4. Company Profiles/Listing
- 7.4.1. Hitech Public Company Limited
- 7.4.1.1. Participant's overview
- 7.4.1.2. Financial performance
- 7.4.1.3. Process benchmarking
- 7.4.1.4. Strategic initiatives
- 7.4.2. American Industrial Co.
- 7.4.2.1. Participant's overview
- 7.4.2.2. Financial performance
- 7.4.2.3. Process benchmarking
- 7.4.2.4. Strategic initiatives
- 7.4.3. CAPARO
- 7.4.3.1. Participant's overview
- 7.4.3.2. Financial performance
- 7.4.3.3. Process benchmarking
- 7.4.3.4. Strategic initiatives
- 7.4.4. D&H Industries, Inc.
- 7.4.4.1. Participant's overview
- 7.4.4.2. Financial performance
- 7.4.4.3. Process benchmarking
- 7.4.4.4. Strategic initiatives
- 7.4.5. FCA
- 7.4.5.1. Participant's overview
- 7.4.5.2. Financial performance
- 7.4.5.3. Process benchmarking
- 7.4.5.4. Strategic initiatives
- 7.4.6. Ford Motor Company
- 7.4.6.1. Participant's overview
- 7.4.6.2. Financial performance
- 7.4.6.3. Process benchmarking
- 7.4.6.4. Strategic initiatives
- 7.4.7. General Motors
- 7.4.7.1. Participant's overview
- 7.4.7.2. Financial performance
- 7.4.7.3. Process benchmarking
- 7.4.7.4. Strategic initiatives
- 7.4.8. Gestamp
- 7.4.8.1. Participant's overview
- 7.4.8.2. Financial performance
- 7.4.8.3. Process benchmarking
- 7.4.8.4. Strategic initiatives
- 7.4.9. Goshen Stamping Company
- 7.4.9.1. Participant's overview
- 7.4.9.2. Financial performance
- 7.4.9.3. Process benchmarking
- 7.4.9.4. Strategic initiatives
- 7.4.10. Kenmode, Inc.
- 7.4.10.1. Participant's overview
- 7.4.10.2. Financial performance
- 7.4.10.3. Process benchmarking
- 7.4.10.4. Strategic initiatives
- 7.4.11. Nissan Motor Co., Ltd
- 7.4.11.1. Participant's overview
- 7.4.11.2. Financial performance
- 7.4.11.3. Process benchmarking
- 7.4.11.4. Strategic initiatives
- 7.4.12. Tempco Manufacturing Company, Inc
- 7.4.12.1. Participant's overview
- 7.4.12.2. Financial performance
- 7.4.12.3. Process benchmarking
- 7.4.12.4. Strategic initiatives
- 7.4.1. Hitech Public Company Limited
