|
|
市場調査レポート
商品コード
1587831
中枢神経系治療薬の市場規模、シェア、動向分析レポート:疾患別、薬剤クラス別、流通チャネル別、地域別、セグメント予測、2025年~2030年Central Nervous System Therapeutics Market Size, Share & Trends Analysis Report By Disease, By Drug Class (Anticonvulsants, CNS Stimulants), By Distribution Channel, By Region, And Segment Forecasts, 2025 - 2030 |
||||||

|
|||||||
カスタマイズ可能
|
|||||||

| 中枢神経系治療薬の市場規模、シェア、動向分析レポート:疾患別、薬剤クラス別、流通チャネル別、地域別、セグメント予測、2025年~2030年 |
|
出版日: 2024年10月21日
発行: Grand View Research
ページ情報: 英文 100 Pages
納期: 2~10営業日
|

全表示
- 概要
- 図表
- 目次
中枢神経系治療薬市場の成長と動向:
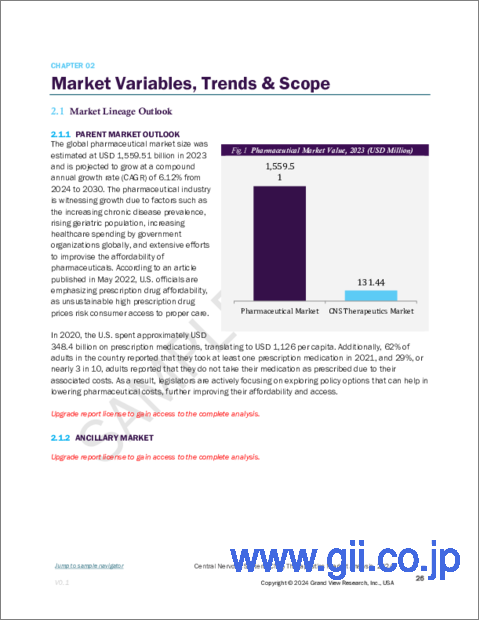
Grand View Research, Inc.の最新レポートによると、中枢神経系治療薬の世界市場規模は2030年までに2億5,460万米ドルに達し、2025年から2030年までのCAGRは10.4%を記録すると予測されています。
高いアンメットメディカルニーズと疾病負担軽減のための政府の取り組みが、予測期間中の中枢神経系(CNS)治療薬市場を牽引しています。WHOによると、うつ病や不安症による世界経済の損失は年間1兆米ドル以上であり、世界のメンタルヘルス患者の増加により、2030年には経済損失が16兆米ドル増加すると予測されています。
同市場は将来の成長機会を強く秘めており、主要企業は新製品開拓、提携、地理的拡大、M&A、新製品承認など、さまざまなマーケティング戦略を採用し、自社の地位を強化しています。2020年2月、バイオジェン社は、アルツハイマー病やその他の神経疾患の治療法を開発するため、サンガモ社のジンクフィンガープラットフォームへの投資を発表しました。同様に、同社は幅広い神経疾患に適用可能な医薬品候補の開発でイオニス・ファーマシューティカルと合意しています。
Biogen、H. Lundbeck A/S、Eli Lilly and Companyなどの大手製薬会社による強力なパイプライン製品の存在は、予測期間中の市場成長を加速させると予想されます。その他の製薬企業も新規治療法の開発に積極的に取り組んでおり、中枢神経系疾患の治療に有効な治療薬を開発するために多額の投資を行っています。
後期開発薬の多くは、アルツハイマー病、多発性硬化症、パーキンソン病、筋萎縮性側索硬化症などの神経変性疾患の治療薬です。aducanumab、brexpiprozole、evobrutinib、solanezumabなどの新薬候補は、神経変性疾患のさまざまな適応症の治療薬として、今後5~8年で商品化される可能性のある薬剤の一部です。神経変性疾患以外では、片頭痛、統合失調症、てんかんが、パイプラインに潜在的な新薬候補がある主な中枢神経系疾患の適応症です。
がん分野は、予測期間中に最も速い成長率を示すと予想されます。有病率の増加、高い死亡率、効果的な治療に対する需要の高まりが、中枢神経系治療薬市場の成長を促進すると予想されます。米国国立がん研究所の推計によると、2020年の米国における中枢神経系がんの新規患者数は23,890人であるのに対し、死亡者数は18,020人です。
製薬会社は市場での地位を強化するため、製品開拓、合併・買収、提携などの戦略を採用しています。例えば、バイオジェンはイオニス・ファーマシューティカルズ、アタランタ・セラピューティクス、サンガモ・セラピューティクスと、中枢神経系のさまざまな疾患に対する新規治療薬を開発する契約を締結しています。同様に、2020年1月、CNSファーマシューティカルズは、MDアンダーソンがんセンターとライセンス契約を締結し、脳腫瘍の治療の可能性を探るため、血液脳関門を通過するよう設計されたDNA結合剤WP1244の研究を行っています。
中枢神経系治療薬市場レポート・ハイライト
- 神経変性疾患は、アルツハイマー病、パーキンソン病、多発性硬化症などの有病率の増加により、予測期間中のCAGRが11.5%で最も速い成長が予測されます。
- 中枢神経系がん分野は、予測期間中に最も速い成長率を示すと予想されます。効果的な治療に対する需要の増加が、このセグメントを牽引すると予想されます。
- アジア太平洋地域では、治療率の向上と医療インフラの整備により、今後数年間で最も急速な成長が見込まれます。
- 北米は、同地域における認知度の高さと、より良い償還シナリオにより、2024年にはシェアの大半を占めました。
目次
第1章 調査手法と範囲
第2章 エグゼクティブサマリー
第3章 中枢神経系治療薬市場の変数、動向、範囲
- 市場系統の見通し
- 市場力学
- 市場 促進要因分析
- 市場抑制要因分析
- ビジネス環境分析
- 業界分析- ポーターのファイブフォース分析
- PESTLE分析
第4章 中枢神経系治療薬市場:疾患のビジネス分析
- 疾病市場シェア、2024年および2030年
- 疾患セグメントダッシュボード
- 市場規模と予測および動向分析、疾患別、2018~2030年
- 神経血管疾患
- 中枢神経系外傷
- メンタルヘルス
- 神経変性疾患
- 感染症
- 中枢神経系がん
- その他
第5章 中枢神経系治療薬市場:薬物クラスのビジネス分析
- 薬物クラス市場シェア、2024年および2030年
- 薬物クラスセグメントダッシュボード
- 市場規模と予測および動向分析、薬剤クラス別、2018~2030年
- 麻酔薬
- 抗けいれん薬
- 制吐剤
- 中枢神経刺激薬
- 鎮痛剤
- その他
第6章 中枢神経系治療薬市場:流通チャネルのビジネス分析
- 流通チャネル市場シェア、2024年および2030年
- 流通チャネルセグメントダッシュボード
- 市場規模と予測および動向分析、流通チャネル別、2018~2030年
- 病院薬局
- 小売薬局
- その他
第7章 中枢神経系治療薬市場:疾患、薬剤クラス、流通チャネル別の地域の推定・動向分析
- 地域別市場シェア分析、2024年および2030年
- 地域市場ダッシュボード
- 市場規模、予測動向分析、2018年から2030年:
- 北米
- 国別、2018年-2030年
- 米国
- カナダ
- メキシコ
- 欧州
- 国別、2018年-2030年
- 英国
- ドイツ
- フランス
- イタリア
- スペイン
- ノルウェー
- デンマーク
- スウェーデン
- アジア太平洋
- 国別、2018年-2030年
- 日本
- 中国
- インド
- 韓国
- オーストラリア
- タイ
- ラテンアメリカ
- 国別、2018年-2030年
- ブラジル
- アルゼンチン
- 中東・アフリカ
- 国別、2018年-2030年
- 南アフリカ
- サウジアラビア
- アラブ首長国連邦
- クウェート
第8章 競合情勢
- 参入企業概要
- 企業の市況分析
- 企業分類
- 戦略マッピング
- 企業プロファイル
- Biogen
- Otsuka Pharmaceutical Co., Ltd.
- Eli Lilly and Company
- Merck &Co., Inc.
- Astra Zeneca
- Takeda Pharmaceutical Company Limited
- Novartis AG
- Teva Pharmaceutical Industries Ltd
- Johnson &Johnson Services, Inc.
- Pfizer Inc.
List of Tables
- Table 1. List of secondary sources
- Table 2. List of abbreviations
- Table 3. Global central nervous system therapeutics market, by region, 2018 - 2030 (USD Million)
- Table 4. Global central nervous system therapeutics market, by disease, 2018 - 2030 (USD Million)
- Table 5. Global central nervous system therapeutics market, by drug class, 2018 - 2030 (USD Million)
- Table 6. Global central nervous system therapeutics market, by distribution channel, 2018 - 2030 (USD Million)
- Table 7. North America central nervous system therapeutics market, by country, 2018 - 2030 (USD Million)
- Table 8. North America central nervous system therapeutics market, by disease, 2018 - 2030 (USD Million)
- Table 9. North America central nervous system therapeutics market, by drug class, 2018 - 2030 (USD Million)
- Table 10. North America central nervous system therapeutics market, by distribution channel, 2018 - 2030 (USD Million)
- Table 11. U.S. central nervous system therapeutics market, by disease, 2018 - 2030 (USD Million)
- Table 12. U.S. central nervous system therapeutics market, by drug class, 2018 - 2030 (USD Million)
- Table 13. U.S. Central nervous system therapeutics market, by distribution channel, 2018 - 2030 (USD Million)
- Table 14. Canada central nervous system therapeutics market, by disease, 2018 - 2030 (USD Million)
- Table 15. Canada central nervous system therapeutics market, by drug class, 2018 - 2030 (USD Million)
- Table 16. Canada central nervous system therapeutics market, by distribution channel, 2018 - 2030 (USD Million)
- Table 17. Mexico central nervous system therapeutics market, by disease, 2018 - 2030 (USD Million)
- Table 18. Mexico central nervous system therapeutics market, by drug class, 2018 - 2030 (USD Million)
- Table 19. Mexico central nervous system therapeutics market, by distribution channel, 2018 - 2030 (USD Million)
- Table 20. Europe central nervous system therapeutics market, by country, 2018 - 2030 (USD Million)
- Table 21. Europe central nervous system therapeutics market, by disease, 2018 - 2030 (USD Million)
- Table 22. Europe central nervous system therapeutics market, by drug class, 2018 - 2030 (USD Million)
- Table 23. Europe central nervous system therapeutics market, by distribution channel, 2018 - 2030 (USD Million)
- Table 24. UK central nervous system therapeutics market, by disease, 2018 - 2030 (USD Million)
- Table 25. UK central nervous system therapeutics market, by drug class, 2018 - 2030 (USD Million)
- Table 26. UK Central nervous system therapeutics market, by distribution channel, 2018 - 2030 (USD Million)
- Table 27. Germany central nervous system therapeutics market, by disease, 2018 - 2030 (USD Million)
- Table 28. Germany central nervous system therapeutics market, by drug class, 2018 - 2030 (USD Million)
- Table 29. Germany central nervous system therapeutics market, by distribution channel, 2018 - 2030 (USD Million)
- Table 30. France central nervous system therapeutics market, by disease, 2018 - 2030 (USD Million)
- Table 31. France central nervous system therapeutics market, by drug class, 2018 - 2030 (USD Million)
- Table 32. France Central nervous system therapeutics market, by distribution channel, 2018 - 2030 (USD Million)
- Table 33. Italy central nervous system therapeutics market, by disease, 2018 - 2030 (USD Million)
- Table 34. Italy central nervous system therapeutics market, by drug class, 2018 - 2030 (USD Million)
- Table 35. Italy central nervous system therapeutics market, by distribution channel, 2018 - 2030 (USD Million)
- Table 36. Spain central nervous system therapeutics market, by disease, 2018 - 2030 (USD Million)
- Table 37. Spain central nervous system therapeutics market, by drug class, 2018 - 2030 (USD Million)
- Table 38. Spain central nervous system therapeutics market, by distribution channel, 2018 - 2030 (USD Million)
- Table 39. Norway central nervous system therapeutics market, by disease, 2018 - 2030 (USD Million)
- Table 40. Norway central nervous system therapeutics market, by drug class, 2018 - 2030 (USD Million)
- Table 41. Norway Central nervous system therapeutics market, by distribution channel, 2018 - 2030 (USD Million)
- Table 42. Denmark central nervous system therapeutics market, by disease, 2018 - 2030 (USD Million)
- Table 43. Denmark central nervous system therapeutics market, by drug class, 2018 - 2030 (USD Million)
- Table 44. Denmark central nervous system therapeutics market, by distribution channel, 2018 - 2030 (USD Million)
- Table 45. Sweden central nervous system therapeutics market, by disease, 2018 - 2030 (USD Million)
- Table 46. Sweden central nervous system therapeutics market, by drug class, 2018 - 2030 (USD Million)
- Table 47. Sweden central nervous system therapeutics market, by distribution channel, 2018 - 2030 (USD Million)
- Table 48. Asia Pacific central nervous system therapeutics market, by country, 2018 - 2030 (USD Million)
- Table 49. Asia Pacific central nervous system therapeutics market, by disease, 2018 - 2030 (USD Million)
- Table 50. Asia Pacific central nervous system therapeutics market, by drug class, 2018 - 2030 (USD Million)
- Table 51. Asia Pacific central nervous system therapeutics market, by distribution channel, 2018 - 2030 (USD Million)
- Table 52. Japan central nervous system therapeutics market, by disease, 2018 - 2030 (USD Million)
- Table 53. Japan central nervous system therapeutics market, by drug class, 2018 - 2030 (USD Million)
- Table 54. Japan central nervous system therapeutics market, by distribution channel, 2018 - 2030 (USD Million)
- Table 55. China central nervous system therapeutics market, by disease, 2018 - 2030 (USD Million)
- Table 56. China central nervous system therapeutics market, by drug class, 2018 - 2030 (USD Million)
- Table 57. China central nervous system therapeutics market, by distribution channel, 2018 - 2030 (USD Million)
- Table 58. India central nervous system therapeutics market, by disease, 2018 - 2030 (USD Million)
- Table 59. India central nervous system therapeutics market, by drug class, 2018 - 2030 (USD Million)
- Table 60. India central nervous system therapeutics market, by distribution channel, 2018 - 2030 (USD Million)
- Table 61. Australia central nervous system therapeutics market, by disease, 2018 - 2030 (USD Million)
- Table 62. Australia central nervous system therapeutics market, by drug class, 2018 - 2030 (USD Million)
- Table 63. Australia central nervous system therapeutics market, by distribution channel, 2018 - 2030 (USD Million)
- Table 64. South Korea central nervous system therapeutics market, by disease, 2018 - 2030 (USD Million)
- Table 65. South Korea central nervous system therapeutics market, by drug class, 2018 - 2030 (USD Million)
- Table 66. South Korea central nervous system therapeutics market, by distribution channel, 2018 - 2030 (USD Million)
- Table 67. Thailand central nervous system therapeutics market, by disease, 2018 - 2030 (USD Million)
- Table 68. Thailand central nervous system therapeutics market, by drug class, 2018 - 2030 (USD Million)
- Table 69. Thailand central nervous system therapeutics market, by distribution channel, 2018 - 2030 (USD Million)
- Table 70. Latin America central nervous system therapeutics market, by country, 2018 - 2030 (USD Million)
- Table 71. Latin America central nervous system therapeutics market, by disease, 2018 - 2030 (USD Million)
- Table 72. Latin America central nervous system therapeutics market, by drug class, 2018 - 2030 (USD Million)
- Table 73. Latin America central nervous system therapeutics market, by distribution channel, 2018 - 2030 (USD Million)
- Table 74. Brazil central nervous system therapeutics market, by disease, 2018 - 2030 (USD Million)
- Table 75. Brazil central nervous system therapeutics market, by drug class, 2018 - 2030 (USD Million)
- Table 76. Brazil central nervous system therapeutics market, by distribution channel, 2018 - 2030 (USD Million)
- Table 77. Argentina central nervous system therapeutics market, by disease, 2018 - 2030 (USD Million)
- Table 78. Argentina central nervous system therapeutics market, by drug class, 2018 - 2030 (USD Million)
- Table 79. Argentina central nervous system therapeutics market, by distribution channel, 2018 - 2030 (USD Million)
- Table 80. Middle East & Africa Central nervous system therapeutics market, by country, 2018 - 2030 (USD Million)
- Table 81. Middle East & Africa central nervous system therapeutics market, by disease, 2018 - 2030 (USD Million)
- Table 82. Middle East & Africa central nervous system therapeutics market, by drug class, 2018 - 2030 (USD Million)
- Table 83. Middle East & Africa central nervous system therapeutics market, by distribution channel, 2018 - 2030 (USD Million)
- Table 84. South Africa central nervous system therapeutics market, by disease, 2018 - 2030 (USD Million)
- Table 85. South Africa central nervous system therapeutics market, by drug class, 2018 - 2030 (USD Million)
- Table 86. South Africa central nervous system therapeutics market, by distribution channel, 2018 - 2030 (USD Million)
- Table 87. Saudi Arabia central nervous system therapeutics market, by disease, 2018 - 2030 (USD Million)
- Table 88. Saudi Arabia central nervous system therapeutics market, by drug class, 2018 - 2030 (USD Million)
- Table 89. Saudi Arabia central nervous system therapeutics market, by distribution channel, 2018 - 2030 (USD Million)
- Table 90. UAE central nervous system therapeutics market, by disease, 2018 - 2030 (USD Million)
- Table 91. UAE central nervous system therapeutics market, by drug class, 2018 - 2030 (USD Million)
- Table 92. UAE central nervous system therapeutics market, by distribution channel, 2018 - 2030 (USD Million)
- Table 93. Kuwait central nervous system therapeutics market, by disease, 2018 - 2030 (USD Million)
- Table 94. Kuwait central nervous system therapeutics market, by drug class, 2018 - 2030 (USD Million)
- Table 95. Kuwait central nervous system therapeutics market, by distribution channel, 2018 - 2030 (USD Million)
List of Figures
- Fig. 1 Central nervous system therapeutics market segmentation
- Fig. 2 Market research process
- Fig. 3 Data triangulation techniques
- Fig. 4 Primary research pattern
- Fig. 5 Market research approaches
- Fig. 6 Value-chain-based sizing & forecasting
- Fig. 7 Market formulation & validation
- Fig. 8 Market snapshot
- Fig. 9 Disease and drug class (USD Million)
- Fig. 10 Distribution channel outlook
- Fig. 11 Competitive landscape
- Fig. 12 Central nervous system therapeutics market dynamics
- Fig. 13 Central nervous system therapeutics market: Porter's five forces analysis
- Fig. 14 Central nervous system therapeutics market: PESTLE analysis
- Fig. 15 Central nervous system therapeutics market Disease segment dashboard
- Fig. 16 Central nervous system therapeutics market: Disease market share analysis, 2024 & 2030
- Fig. 17 Neurovascular diseases market, 2018 - 2030 (USD Million)
- Fig. 18 CNS trauma market, 2018 - 2030 (USD Million)
- Fig. 19 Mental health market, 2018 - 2030 (USD Million)
- Fig. 20 Anxiety disorders market, 2018 - 2030 (USD Million)
- Fig. 21 Epilepsy market, 2018 - 2030 (USD Million)
- Fig. 22 Mood disorders market, 2018 - 2030 (USD Million)
- Fig. 23 Psychotic disorders market, 2018 - 2030 (USD Million)
- Fig. 24 Others market, 2018 - 2030 (USD Million)
- Fig. 25 Neurodegenerative diseases market, 2018 - 2030 (USD Million)
- Fig. 26 Alzheimer's disease market, 2018 - 2030 (USD Million)
- Fig. 27 Parkinsosn's disease market, 2018 - 2030 (USD Million)
- Fig. 28 Multiple sclerosis market, 2018 - 2030 (USD Million)
- Fig. 29 Huntington's disease market, 2018 - 2030 (USD Million)
- Fig. 30 Amytrophic lateral sclerosis market, 2018 - 2030 (USD Million)
- Fig. 31 Others market, 2018 - 2030 (USD Million)
- Fig. 32 Infectious diseases market, 2018 - 2030 (USD Million)
- Fig. 33 CNS cancer market, 2018 - 2030 (USD Million)
- Fig. 34 Others market, 2018 - 2030 (USD Million)
- Fig. 35 Central nervous system therapeutics market: Drug class segment dashboard
- Fig. 36 Central nervous system therapeutics market: Drug class market share analysis, 2024 & 2030
- Fig. 37 Anesthetics market, 2018 - 2030 (USD Million)
- Fig. 38 Anticonvulsants market, 2018 - 2030 (USD Million)
- Fig. 39 Antiemetics market, 2018 - 2030 (USD Million)
- Fig. 40 CNS stimulants market, 2018 - 2030 (USD Million)
- Fig. 41 Pain relievers market, 2018 - 2030 (USD Million)
- Fig. 42 Others market, 2018 - 2030 (USD Million)
- Fig. 43 Central nervous system therapeutics market: Distribution channel segment dashboard
- Fig. 44 Central nervous system therapeutics market: Distribution channel market share analysis, 2024 & 2030
- Fig. 45 Hospital pharmacies market, 2018 - 2030 (USD Million)
- Fig. 46 Retail pharmacies market, 2018 - 2030 (USD Million)
- Fig. 47 Others market, 2018 - 2030 (USD Million)
- Fig. 48 Central nervous system therapeutics market revenue, by region
- Fig. 49 Regional marketplace: Key takeaways
- Fig. 50 Regional marketplace: Key takeaways
- Fig. 51 North America central nervous system therapeutics market, 2018 - 2030 (USD Million)
- Fig. 52 U.S. country dynamics
- Fig. 53 U.S. central nervous system therapeutics market, 2018 - 2030 (USD Million)
- Fig. 54 Canada country dynamics
- Fig. 55 Canada central nervous system therapeutics market, 2018 - 2030 (USD Million)
- Fig. 56 Mexico country dynamics
- Fig. 57 Mexico central nervous system therapeutics market, 2018 - 2030 (USD Million)
- Fig. 58 Europe central nervous system therapeutics market, 2018 - 2030 (USD Million)
- Fig. 59 UK country dynamics
- Fig. 60 UK central nervous system therapeutics market, 2018 - 2030 (USD Million)
- Fig. 61 Germany country dynamics
- Fig. 62 Germany central nervous system therapeutics market, 2018 - 2030 (USD Million)
- Fig. 63 France country dynamics
- Fig. 64 France central nervous system therapeutics market, 2018 - 2030 (USD Million)
- Fig. 65 Italy country dynamics
- Fig. 66 Italy central nervous system therapeutics market, 2018 - 2030 (USD Million)
- Fig. 67 Spain country dynamics
- Fig. 68 Spain central nervous system therapeutics market, 2018 - 2030 (USD Million)
- Fig. 69 Norway country dynamics
- Fig. 70 Norway central nervous system therapeutics market, 2018 - 2030 (USD Million)
- Fig. 71 Sweden country dynamics
- Fig. 72 Sweden central nervous system therapeutics market, 2018 - 2030 (USD Million)
- Fig. 73 Denmark country dynamics
- Fig. 74 Denmark central nervous system therapeutics market, 2018 - 2030 (USD Million)
- Fig. 75 Asia Pacific central nervous system therapeutics market, 2018 - 2030 (USD Million)
- Fig. 76 Japan country dynamics
- Fig. 77 Japan central nervous system therapeutics market, 2018 - 2030 (USD Million)
- Fig. 78 China country dynamics
- Fig. 79 China central nervous system therapeutics market, 2018 - 2030 (USD Million)
- Fig. 80 India country dynamics
- Fig. 81 India central nervous system therapeutics market, 2018 - 2030 (USD Million)
- Fig. 82 Australia country dynamics
- Fig. 83 Australia central nervous system therapeutics market, 2018 - 2030 (USD Million)
- Fig. 84 South Korea country dynamics
- Fig. 85 South Korea central nervous system therapeutics market, 2018 - 2030 (USD Million)
- Fig. 86 Thailand country dynamics
- Fig. 87 Thailand central nervous system therapeutics market, 2018 - 2030 (USD Million)
- Fig. 88 Latin America central nervous system therapeutics market, 2018 - 2030 (USD Million)
- Fig. 89 Brazil country dynamics
- Fig. 90 Brazil central nervous system therapeutics market, 2018 - 2030 (USD Million)
- Fig. 91 Argentina country dynamics
- Fig. 92 Argentina central nervous system therapeutics market, 2018 - 2030 (USD Million)
- Fig. 93 MEA central nervous system therapeutics market, 2018 - 2030 (USD Million)
- Fig. 94 South Africa country dynamics
- Fig. 95 South Africa central nervous system therapeutics market, 2018 - 2030 (USD Million)
- Fig. 96 Saudi Arabia country dynamics
- Fig. 97 Saudi Arabia central nervous system therapeutics market, 2018 - 2030 (USD Million)
- Fig. 98 UAE country dynamics
- Fig. 99 UAE central nervous system therapeutics market, 2018 - 2030 (USD Million)
- Fig. 100 Kuwait country dynamics
- Fig. 101 Kuwait central nervous system therapeutics market, 2018 - 2030 (USD Million)
- Fig. 102 Company categorization
- Fig. 103 Company market position analysis
- Fig. 104 Strategic framework
Central Nervous System Therapeutic Market Growth & Trends:
The global central nervous system therapeutics market size is expected to reach USD 254.6 million by 2030, registering a CAGR of 10.4% from 2025 to 2030, according to a new report by Grand View Research, Inc. High unmet medical needs and government initiatives to reduce the disease burden are driving the market for central nervous system (CNS) therapeutic over the forecast period. According to WHO, the global economy loses due to depression and anxiety is more than USD 1 trillion per year and rising patient base of mental health globally is expected to increase the economy loses by USD 16 trillion in 2030.
The market holds strong future growth opportunities and major players are adopting different marketing strategies such as new product development, collaborations, geographic expansion, mergers and acquisitions, and new product approval, to strengthen their positions. In February 2020, Biogen announced the investment in Sangamo's zinc finger platform to develop therapies for Alzheimer's disease and other neurological diseases. Similarly, the company has an agreement with Ionis Pharmaceutical for the development of drug candidates applicable across a wide range of neurological diseases.
Presence of strong pipeline products by major pharmaceutical companies such as Biogen, H. Lundbeck A/S, Eli Lilly and Company, and others are expected to accelerate market growth over the forecast period. Besides, other pharmaceutical companies are also actively involved in the development of novel therapies and investing heavily to develop effective therapeutics for the treatment of CNS associated diseases.
Most of the late phase development drugs are for the treatment of neurodegenerative disorders such as Alzheimer's disease, multiple sclerosis, Parkinson's disease, and amyotrophic lateral sclerosis. The drug candidates such as aducanumab, brexpiprozole, evobrutinib, solanezumab are some of the potential drugs that could be commercialized in the next five to eight years for the treatment of various indication of neurodegenerative disorders. Apart from neurodegenerative diseases, migraine, schizophrenia, and epilepsy are the major CNS disease indications that have potential drug candidates in pipeline.
The cancer segment is expected to witness the fastest growth rate over the forecast period. Increasing prevalence, high mortality rate, and rising demand for effective treatment are expected to fuel the growth of the market for CNS therapeutic. According to National Cancer Institute estimates, the number of new cases of CNS cancers was 23,890 whereas the number of deaths was 18,020 in the U.S. in 2020.
Pharmaceutical companies are adopting strategies such as product development, merger and acquisition, and collaboration to strengthen their position in market. For instance, Biogen has signed agreements with Ionis Pharmaceuticals, Atalanta Therapeutics, and Sangamo Therapeutics to develop novel therapeutics for the treatment of different disease indications of the central nervous system. Similarly, in January 2020, the CNS Pharmaceuticals has entered into a licensing agreement with MD Anderson Cancer Center to investigate WP1244, a designed DNA-binding agent to cross the blood-brain barriers for the potential treatment of brain cancers.
Central Nervous System Therapeutic Market Report Highlights:
- Neurodegenerative diseases are projected to witness the fastest growth with a CAGR of 11.5% over the forecast period, owing to the increasing prevalence of conditions such as Alzheimer's, Parkinson's, and multiple sclerosis.
- The CNS cancer segment is expected to witness the fastest growth rate over the forecast period. Increasing demand for effective treatment is expected to drive the segment
- In Asia Pacific, the market is estimated to witness the fastest growth over the coming years owing to the increase in treatment rate and betterment of healthcare infrastructure in the region
- North America held a majority of share in 2024 due to high awareness level in the region and better reimbursement scenario
Table of Contents
Chapter 1. Methodology and Scope
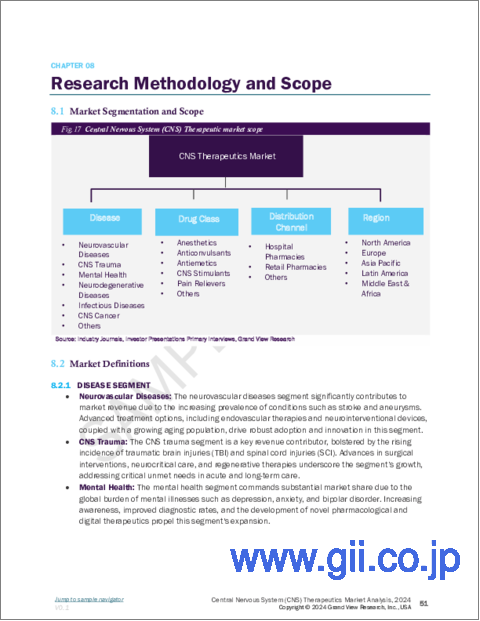
- 1.1. Market Segmentation & Scope
- 1.2. Segment Definitions
- 1.2.1. Disease
- 1.2.2. Drug Class
- 1.2.3. Distribution Channel
- 1.3. Estimates and Forecast Timeline
- 1.4. Research Methodology
- 1.5. Information Procurement
- 1.5.1. Purchased Database
- 1.5.2. GVR's Internal Database
- 1.5.3. Secondary Sources
- 1.5.4. Primary Research
- 1.6. Information Analysis
- 1.6.1. Data Analysis Models
- 1.7. Market Formulation & Data Visualization
- 1.8. Model Details
- 1.8.1. Commodity Flow Analysis
- 1.9. List of Secondary Sources
- 1.10. Objectives
Chapter 2. Executive Summary
- 2.1. Market Snapshot
- 2.2. Segment Snapshot
- 2.3. Competitive Landscape Snapshot
Chapter 3. Central Nervous System Therapeutics Market Variables, Trends, & Scope
- 3.1. Market Lineage Outlook
- 3.2. Market Dynamics
- 3.2.1. Market Driver Analysis
- 3.2.2. Market Restraint Analysis
- 3.3. Business Environment Analysis
- 3.3.1. Industry Analysis - Porter's Five Forces Analysis
- 3.3.1.1. Supplier Power
- 3.3.1.2. Buyer Power
- 3.3.1.3. Substitution Threat
- 3.3.1.4. Threat of New Entrants
- 3.3.1.5. Competitive Rivalry
- 3.3.2. PESTLE Analysis
- 3.3.1. Industry Analysis - Porter's Five Forces Analysis
Chapter 4. Central Nervous System Therapeutics Market: Disease Business Analysis
- 4.1. Disease Market Share, 2024 & 2030
- 4.2. Disease Segment Dashboard
- 4.3. Market Size & Forecasts and Trend Analysis, by Disease, 2018 to 2030 (USD Million)
- 4.4. Neurovascular Diseases
- 4.4.1. Neurovascular Diseases Market, 2018 - 2030 (USD Million)
- 4.5. CNS Trauma
- 4.5.1. CNS Trauma Market, 2018 - 2030 (USD Million)
- 4.6. Mental Health
- 4.6.1. Mental Health Market, 2018 - 2030 (USD Million)
- 4.6.2. Anxiety Disorders
- 4.6.2.1. Anxiety Disorders Market, 2018 - 2030 (USD Million)
- 4.6.3. Epilepsy
- 4.6.3.1. Epilepsy Market, 2018 - 2030 (USD Million)
- 4.6.4. Mood Disorders
- 4.6.4.1. Mood Disorders Market, 2018 - 2030 (USD Million)
- 4.6.5. Psychotic Disorders
- 4.6.5.1. Psychotic Disorders Market, 2018 - 2030 (USD Million)
- 4.6.6. Others
- 4.6.6.1. Others Market, 2018 - 2030 (USD Million)
- 4.7. Neurodegenerative Diseases
- 4.7.1. Neurodegenerative Diseases Market, 2018 - 2030 (USD Million)
- 4.7.2. Alzheimer's Disease
- 4.7.2.1. Alzheimer's Disease Market, 2018 - 2030 (USD Million)
- 4.7.3. Parkinsosn's Disease
- 4.7.3.1. Parkinsosn's Disease Market, 2018 - 2030 (USD Million)
- 4.7.4. Multiple Sclerosis
- 4.7.4.1. Multiple Sclerosis Market, 2018 - 2030 (USD Million)
- 4.7.5. Huntington's Disease
- 4.7.5.1. Huntington's Disease Market, 2018 - 2030 (USD Million)
- 4.7.6. Amytrophic Lateral Sclerosis
- 4.7.6.1. Amytrophic Lateral Sclerosis Market, 2018 - 2030 (USD Million)
- 4.7.7. Others
- 4.7.7.1. Others Market, 2018 - 2030 (USD Million)
- 4.8. Infectious Diseases
- 4.8.1. Infectious Diseases Market, 2018 - 2030 (USD Million)
- 4.9. CNS Cancer
- 4.9.1. CNS Cancer Market, 2018 - 2030 (USD Million)
- 4.10. Others
- 4.10.1. Others Market, 2018 - 2030 (USD Million)
Chapter 5. Central Nervous System Therapeutics Market: Drug Class Business Analysis
- 5.1. Drug Class Market Share, 2024 & 2030
- 5.2. Drug Class Segment Dashboard
- 5.3. Market Size & Forecasts and Trend Analysis, by Drug Class, 2018 to 2030 (USD Million)
- 5.4. Anesthetics
- 5.4.1. Anesthetics Market, 2018 - 2030 (USD Million)
- 5.5. Anticonvulsants
- 5.5.1. Anticonvulsants Market, 2018 - 2030 (USD Million)
- 5.6. Antiemetics
- 5.6.1. Antiemetics Market, 2018 - 2030 (USD Million)
- 5.7. CNS Stimulants
- 5.7.1. CNS Stimulants Market, 2018 - 2030 (USD Million)
- 5.8. Pain Relievers
- 5.8.1. Pain Relievers Market, 2018 - 2030 (USD Million)
- 5.9. Others
- 5.9.1. Others Market, 2018 - 2030 (USD Million)
Chapter 6. Central Nervous System Therapeutics Market: Distribution Channel Business Analysis
- 6.1. Distribution Channel Market Share, 2024 & 2030
- 6.2. Distribution Channel Segment Dashboard
- 6.3. Market Size & Forecasts and Trend Analysis, by Distribution Channel, 2018 to 2030 (USD Million)
- 6.4. Hospital Pharmacies
- 6.4.1. Hospital Pharmacies Market, 2018 - 2030 (USD Million)
- 6.5. Retail Pharmacies
- 6.5.1. Retail Pharmacies Market, 2018 - 2030 (USD Million)
- 6.6. Others
- 6.6.1. Others Market, 2018 - 2030 (USD Million)
Chapter 7. Central Nervous System Therapeutics Market: Regional Estimates & Trend Analysis by Disease, Drug Class, Distribution Channel
- 7.1. Regional Market Share Analysis, 2024 & 2030
- 7.2. Regional Market Dashboard
- 7.3. Market Size, & Forecasts Trend Analysis, 2018 to 2030:
- 7.4. North America
- 7.4.1. North America Central Nervous System Therapeutics Market Estimates And Forecasts, By Country, 2018 - 2030 (USD Million)
- 7.4.2. U.S.
- 7.4.2.1. Key Country Dynamics
- 7.4.2.2. Regulatory Framework
- 7.4.2.3. Competitive Insights
- 7.4.2.4. U.S. Central Nervous System Therapeutics Market Estimates And Forecasts, 2018 - 2030 (USD Million)
- 7.4.3. Canada
- 7.4.3.1. Key Country Dynamics
- 7.4.3.2. Regulatory Framework
- 7.4.3.3. Competitive Insights
- 7.4.3.4. Canada Central Nervous System Therapeutics Market Estimates And Forecasts, 2018 - 2030 (USD Million)
- 7.4.4. Mexico
- 7.4.4.1. Key Country Dynamics
- 7.4.4.2. Regulatory Framework
- 7.4.4.3. Competitive Insights
- 7.4.4.4. Mexico Central Nervous System Therapeutics Market Estimates And Forecasts, 2018 - 2030 (USD Million)
- 7.5. Europe
- 7.5.1. Europe Central Nervous System Therapeutics Market Estimates And Forecasts, By Country, 2018 - 2030 (USD Million)
- 7.5.2. UK
- 7.5.2.1. Key Country Dynamics
- 7.5.2.2. Regulatory Framework
- 7.5.2.3. Competitive Insights
- 7.5.2.4. UK Central Nervous System Therapeutics Market Estimates And Forecasts, 2018 - 2030 (USD Million)
- 7.5.3. Germany
- 7.5.3.1. Key Country Dynamics
- 7.5.3.2. Regulatory Framework
- 7.5.3.3. Competitive Insights
- 7.5.3.4. Germany Central Nervous System Therapeutics Market Estimates And Forecasts, 2018 - 2030 (USD Million)
- 7.5.4. France
- 7.5.4.1. Key Country Dynamics
- 7.5.4.2. Regulatory Framework
- 7.5.4.3. Competitive Insights
- 7.5.4.4. France Central Nervous System Therapeutics Market Estimates And Forecasts, 2018 - 2030 (USD Million)
- 7.5.5. Italy
- 7.5.5.1. Key Country Dynamics
- 7.5.5.2. Regulatory Framework
- 7.5.5.3. Competitive Insights
- 7.5.5.4. Italy Central Nervous System Therapeutics Market Estimates And Forecasts, 2018 - 2030 (USD Million)
- 7.5.6. Spain
- 7.5.6.1. Key Country Dynamics
- 7.5.6.2. Regulatory Framework
- 7.5.6.3. Competitive Insights
- 7.5.6.4. Spain Central Nervous System Therapeutics Market Estimates And Forecasts, 2018 - 2030 (USD Million)
- 7.5.7. Norway
- 7.5.7.1. Key Country Dynamics
- 7.5.7.2. Regulatory Framework
- 7.5.7.3. Competitive Insights
- 7.5.7.4. Norway Central Nervous System Therapeutics Market Estimates And Forecasts, 2018 - 2030 (USD Million)
- 7.5.8. Denmark
- 7.5.8.1. Key Country Dynamics
- 7.5.8.2. Regulatory Framework
- 7.5.8.3. Competitive Insights
- 7.5.8.4. Denmark Central Nervous System Therapeutics Market Estimates And Forecasts, 2018 - 2030 (USD Million)
- 7.5.9. Sweden
- 7.5.9.1. Key Country Dynamics
- 7.5.9.2. Regulatory Framework
- 7.5.9.3. Competitive Insights
- 7.5.9.4. Sweden Central Nervous System Therapeutics Market Estimates And Forecasts, 2018 - 2030 (USD Million)
- 7.6. Asia Pacific
- 7.6.1. Asia Pacific Central Nervous System Therapeutics Market Estimates And Forecasts, By Country, 2018 - 2030 (USD Million)
- 7.6.2. Japan
- 7.6.2.1. Key Country Dynamics
- 7.6.2.2. Regulatory Framework
- 7.6.2.3. Competitive Insights
- 7.6.2.4. Japan Central Nervous System Therapeutics Market Estimates And Forecasts, 2018 - 2030 (USD Million)
- 7.6.3. China
- 7.6.3.1. Key Country Dynamics
- 7.6.3.2. Regulatory Framework
- 7.6.3.3. Competitive Insights
- 7.6.3.4. China Central Nervous System Therapeutics Market Estimates And Forecasts, 2018 - 2030 (USD Million)
- 7.6.4. India
- 7.6.4.1. Key Country Dynamics
- 7.6.4.2. Regulatory Framework
- 7.6.4.3. Competitive Insights
- 7.6.4.4. India Central Nervous System Therapeutics Market Estimates And Forecasts, 2018 - 2030 (USD Million)
- 7.6.5. South Korea
- 7.6.5.1. Key Country Dynamics
- 7.6.5.2. Regulatory Framework
- 7.6.5.3. Competitive Insights
- 7.6.5.4. South Korea Central Nervous System Therapeutics Market Estimates And Forecasts, 2018 - 2030 (USD Million)
- 7.6.6. Australia
- 7.6.6.1. Key Country Dynamics
- 7.6.6.2. Regulatory Framework
- 7.6.6.3. Competitive Insights
- 7.6.6.4. Australia Central Nervous System Therapeutics Market Estimates And Forecasts, 2018 - 2030 (USD Million)
- 7.6.7. Thailand
- 7.6.7.1. Key Country Dynamics
- 7.6.7.2. Regulatory Framework
- 7.6.7.3. Competitive Insights
- 7.6.7.4. Thailand Central Nervous System Therapeutics Market Estimates And Forecasts, 2018 - 2030 (USD Million)
- 7.7. Latin America
- 7.7.1. Latin America Central Nervous System Therapeutics Market Estimates And Forecasts, By Country, 2018 - 2030 (USD Million)
- 7.7.2. Brazil
- 7.7.2.1. Key Country Dynamics
- 7.7.2.2. Regulatory Framework
- 7.7.2.3. Competitive Insights
- 7.7.2.4. Brazil Central Nervous System Therapeutics Market Estimates And Forecasts, 2018 - 2030 (USD Million)
- 7.7.3. Argentina
- 7.7.3.1. Key Country Dynamics
- 7.7.3.2. Regulatory Framework
- 7.7.3.3. Competitive Insights
- 7.7.3.4. Argentina Central Nervous System Therapeutics Market Estimates And Forecasts, 2018 - 2030 (USD Million)
- 7.8. MEA
- 7.8.1. MEA Central Nervous System Therapeutics Market Estimates And Forecasts, By Country, 2018 - 2030 (USD Million)
- 7.8.2. South Africa
- 7.8.2.1. Key Country Dynamics
- 7.8.2.2. Regulatory Framework
- 7.8.2.3. Competitive Insights
- 7.8.2.4. South Africa Central Nervous System Therapeutics Market Estimates And Forecasts, 2018 - 2030 (USD Million)
- 7.8.3. Saudi Arabia
- 7.8.3.1. Key Country Dynamics
- 7.8.3.2. Regulatory Framework
- 7.8.3.3. Competitive Insights
- 7.8.3.4. Saudi Arabia Central Nervous System Therapeutics Market Estimates And Forecasts, 2018 - 2030 (USD Million)
- 7.8.4. UAE
- 7.8.4.1. Key Country Dynamics
- 7.8.4.2. Regulatory Framework
- 7.8.4.3. Competitive Insights
- 7.8.4.4. UAE Central Nervous System Therapeutics Market Estimates And Forecasts, 2018 - 2030 (USD Million)
- 7.8.5. Kuwait
- 7.8.5.1. Key Country Dynamics
- 7.8.5.2. Regulatory Framework
- 7.8.5.3. Competitive Insights
- 7.8.5.4. Kuwait Central Nervous System Therapeutics Market Estimates And Forecasts, 2018 - 2030 (USD Million)
Chapter 8. Competitive Landscape
- 8.1. Participant Overview
- 8.2. Company Market Position Analysis
- 8.3. Company Categorization
- 8.4. Strategy Mapping
- 8.5. Company Profiles/Listing
- 8.5.1. Biogen
- 8.5.1.1. Overview
- 8.5.1.2. Financial Performance
- 8.5.1.3. Product Benchmarking
- 8.5.1.4. Strategic Initiatives
- 8.5.2. Otsuka Pharmaceutical Co., Ltd.
- 8.5.2.1. Overview
- 8.5.2.2. Financial Performance
- 8.5.2.3. Product Benchmarking
- 8.5.2.4. Strategic Initiatives
- 8.5.3. Eli Lilly and Company
- 8.5.3.1. Overview
- 8.5.3.2. Financial Performance
- 8.5.3.3. Product Benchmarking
- 8.5.3.4. Strategic Initiatives
- 8.5.4. Merck & Co., Inc.
- 8.5.4.1. Overview
- 8.5.4.2. Financial Performance
- 8.5.4.3. Product Benchmarking
- 8.5.4.4. Strategic Initiatives
- 8.5.5. Astra Zeneca
- 8.5.5.1. Overview
- 8.5.5.2. Financial Performance
- 8.5.5.3. Product Benchmarking
- 8.5.5.4. Strategic Initiatives
- 8.5.6. Takeda Pharmaceutical Company Limited
- 8.5.6.1. Overview
- 8.5.6.2. Financial Performance
- 8.5.6.3. Product Benchmarking
- 8.5.6.4. Strategic Initiatives
- 8.5.7. Novartis AG
- 8.5.7.1. Overview
- 8.5.7.2. Financial Performance
- 8.5.7.3. Product Benchmarking
- 8.5.7.4. Strategic Initiatives
- 8.5.8. Teva Pharmaceutical Industries Ltd
- 8.5.8.1. Overview
- 8.5.8.2. Financial Performance
- 8.5.8.3. Product Benchmarking
- 8.5.8.4. Strategic Initiatives
- 8.5.9. Johnson & Johnson Services, Inc.
- 8.5.9.1. Overview
- 8.5.9.2. Financial Performance
- 8.5.9.3. Product Benchmarking
- 8.5.9.4. Strategic Initiatives
- 8.5.10. Pfizer Inc.
- 8.5.10.1. Overview
- 8.5.10.2. Financial Performance
- 8.5.10.3. Product Benchmarking
- 8.5.10.4. Strategic Initiatives
- 8.5.1. Biogen

