|
|
市場調査レポート
商品コード
1587791
球状SiCの市場規模、シェア、動向分析レポート:用途別、製品別、地域別、セグメント予測、2024年~2030年Spherical Silicon Carbide Market Size, Share & Trends Analysis Report By Application (Filler Material, Coating), By Product (Below 30.0 Micrometre, Above 50.0 Micrometre), By Region, And Segment Forecasts, 2024 - 2030 |
||||||

|
|||||||
カスタマイズ可能
|
|||||||

| 球状SiCの市場規模、シェア、動向分析レポート:用途別、製品別、地域別、セグメント予測、2024年~2030年 |
|
出版日: 2024年10月03日
発行: Grand View Research
ページ情報: 英文 100 Pages
納期: 2~10営業日
|

全表示
- 概要
- 図表
- 目次
球状SiCの市場動向:
球状SiCの世界市場規模は2023年に36億8,000万米ドルと推計され、2024年から2030年にかけてCAGR 11.0%で成長すると予測されています。
高熱伝導性、高耐圧、高温での優れた効率といったSiCの優れた特性は、エレクトロニクス産業に理想的です。この材料は、電気自動車(EV)インバーター、エネルギー効率の高いチップ、半導体などの高出力デバイスの開発に特に適しています。産業界が次世代エレクトロニクスを推進する中、SiCは高周波かつ高温の用途に使用されています。これは、電気自動車(EV)、再生可能エネルギーシステム、データセンターにおける、より効率的な電子部品への需要を支えています。
SiC(炭化ケイ素)は再生可能エネルギー産業、特にソーラー・インバータや風力タービンにおいて重要な役割を果たしており、エネルギー効率を大幅に向上させる。電力損失を低減し、太陽光発電システムや電力網におけるエネルギー変換効率を高めるその能力は、需要を牽引してきました。各国が厳しいエネルギー目標の達成とカーボンフットプリントの削減を目指しているため、再生可能エネルギー技術におけるSiCの使用は大幅に拡大すると予想されます。
EVへの世界のシフトもSiC需要の重要な原動力です。EVパワートレインでは、SiCは従来のシリコンベースのデバイスよりも高い効率を提供し、より長い走行距離とより速い充電能力につながります。大手自動車メーカーがEVの生産規模を拡大していることから、SiCベース半導体の需要は増加すると予想されます。加えて、SiCはブレーキシステムやエンジン部品などの自動車部品にも使用されており、SiCの採用をさらに後押ししています。
さらに、航空宇宙産業は、ジェット・タービンのブレードや航空宇宙用電子機器などの高温耐摩耗用途にSiCを採用しつつあります。SiCは強度を維持しながら極限の環境に耐えることができるため、高圧や高温に耐えなければならない重要な部品の製造に適した材料となっています。さらに、SiCは、耐久性と性能が最も重要なセンサーやレーダー用の高度な防衛システムにも使用されています。
特に防衛、航空宇宙、エレクトロニクス分野での特殊セラミックへの需要の高まりが、SiCへのニーズの高まりに寄与しています。その硬度と耐摩耗性、耐腐食性は、耐久性のあるセラミック部品の製造に理想的です。自動車や鉄鋼部門など、高い機械的強度を持つ材料を必要とする産業も、性能の向上とメンテナンスコストの削減を目的として、SiCベースのセラミックに注目しています。
SiCは、鉄鋼業界において、炉の操業を改善し、排出ガスを削減するためにますます使用されるようになっています。SiCの高い熱伝導率は、より効率的なエネルギー利用を可能にするため、よりクリーンで迅速な鉄鋼生産工程を可能にします。これは、特に製鉄のような伝統的にエネルギー多消費型である重工業において、二酸化炭素排出量の削減を目指す世界の動きと一致しています。
目次
第1章 調査手法と範囲
第2章 エグゼクティブサマリー
第3章 球状SiC市場の変数、動向、範囲
- 市場系統の見通し
- バリューチェーン分析
- 市場力学
- 市場 促進要因分析
- 市場抑制要因分析
- 市場機会分析
- 市場課題分析
- 規制の枠組み
- ビジネス環境分析
- PESTLE分析
- ポーターのファイブフォース分析
- 市場混乱分析
第4章 球状SiC市場:製品の推定・動向分析
- 重要なポイント
- 製品変動分析と市場シェア、2023年と2030年
- 製品別市場、2018年-2030年
- 30.0μm未満
- 30.0~50.0μm
- 50.0μm超
第5章 球状SiC市場:用途の推定・動向分析
- 重要なポイント
- 用途変動分析と市場シェア、2023年と2030年
- 用途別市場、2018年-2030年
- 充填材
- セラミック材
- コーティング
- その他
第6章 球状SiC市場:地域の推定・動向分析
- 重要なポイント
- 地域別市場シェア分析、2023年および2030年
- 地域別、2018年-2030年
- 北米
- 製品別、2018年-2030年
- 用途別、2018年-2030年
- 米国
- カナダ
- メキシコ
- 欧州
- 製品別、2018年-2030年
- 用途別、2018年-2030年
- ドイツ
- 英国
- フランス
- スペイン
- イタリア
- アジア太平洋
- 製品別、2018年-2030年
- 用途別、2018年-2030年
- 中国
- インド
- 日本
- 中南米
- 製品別、2018年-2030年
- 用途別、2018年-2030年
- ブラジル
- 中東・アフリカ
- 製品別、2018年-2030年
- 用途別、2018年-2030年
- サウジアラビア
第7章 サプライヤーインテリジェンス
- クラリッチマトリックス
- エンゲージメントモデル
- 交渉戦略
- 調達のベストプラクティス
- ベンダー選択基準
第8章 競合分析
- 主要市場参入企業による最近の動向と影響分析
- 企業分類
- 企業の市場ポジショニング
- 企業ヒートマップ分析
- 企業リスト
- Fujimi Corporation
- Shin-Etsu Chemical
List of Tables
- Table 1 Spherical silicon carbide market estimates & forecasts, by product, 2018 - 2030 (USD Million)
- Table 2 Spherical silicon carbide market estimates & forecasts, by application, 2018 - 2030 (USD Million)
- Table 3 Spherical silicon carbide market estimates & forecasts, by filler material, 2018 - 2030 (USD Million)
- Table 4 Spherical silicon carbide market estimates & forecasts, by ceramic material, 2018 - 2030 (USD Million)
- Table 5 Spherical silicon carbide market estimates & forecasts, by coating, 2018 - 2030 (USD Million)
- Table 6 Spherical silicon carbide market estimates & forecasts, by others, 2018 - 2030 (USD Million)
- Table 7 Spherical silicon carbide market estimates & forecasts, by Below 30.0 μm, 2018 - 2030 (USD Million)
- Table 8 Spherical silicon carbide market estimates & forecasts, by 30.0-50.0μm, 2018 - 2030 (USD Million)
- Table 9 Spherical silicon carbide market estimates & forecasts, by Above 50.0 μm, 2018 - 2030 (USD Million)
- Table 10 North America Spherical silicon carbide market estimates & forecasts, 2018 - 2030 (USD Million)
- Table 11 North America Spherical silicon carbide market estimates & forecasts, by product, 2018 - 2030 (USD Million)
- Table 12 North America Spherical silicon carbide market estimates & forecasts, by application, 2018 - 2030 (USD Million)
- Table 13 U.S. Spherical silicon carbide market estimates & forecasts, 2018 - 2030 (USD Million)
- Table 14 U.S. Spherical silicon carbide market estimates & forecasts, by product, 2018 - 2030 (USD Million)
- Table 15 U.S. Spherical silicon carbide market estimates & forecasts, by application, 2018 - 2030 (USD Million)
- Table 16 Canada Spherical silicon carbide market estimates & forecasts, 2018 - 2030 (USD Million)
- Table 17 Canada Spherical silicon carbide market estimates & forecasts, by product, 2018 - 2030 (USD Million)
- Table 18 Canada Spherical silicon carbide market estimates & forecasts, by application, 2018 - 2030 (USD Million)
- Table 19 Mexico Spherical silicon carbide market estimates & forecasts, 2018 - 2030 (USD Million)
- Table 20 Mexico Spherical silicon carbide market estimates & forecasts, by product, 2018 - 2030 (USD Million)
- Table 21 Mexico Spherical silicon carbide market estimates & forecasts, by application, 2018 - 2030 (USD Million)
- Table 22 Europe Spherical silicon carbide market estimates & forecasts, 2018 - 2030 (USD Million)
- Table 23 Europe Spherical silicon carbide market estimates & forecasts, by product, 2018 - 2030 (USD Million)
- Table 24 Europe Spherical silicon carbide market estimates & forecasts, by application, 2018 - 2030 (USD Million)
- Table 25 Germany Spherical silicon carbide market estimates & forecasts, 2018 - 2030 (USD Million)
- Table 26 Germany Spherical silicon carbide market estimates & forecasts, by product, 2018 - 2030 (USD Million)
- Table 27 Germany Spherical silicon carbide market estimates & forecasts, by application, 2018 - 2030 (USD Million)
- Table 28 UK Spherical silicon carbide market estimates & forecasts, 2018 - 2030 (USD Million)
- Table 29 UK Spherical silicon carbide market estimates & forecasts, by product, 2018 - 2030 (USD Million)
- Table 30 UK Spherical silicon carbide market estimates & forecasts, by application, 2018 - 2030 (USD Million)
- Table 31 France Spherical silicon carbide market estimates & forecasts, 2018 - 2030 (USD Million)
- Table 32 France Spherical silicon carbide market estimates & forecasts, by product, 2018 - 2030 (USD Million)
- Table 33 France Spherical silicon carbide market estimates & forecasts, by application, 2018 - 2030 (USD Million)
- Table 34 Spain Spherical silicon carbide market estimates & forecasts, 2018 - 2030 (USD Million)
- Table 35 Spain Spherical silicon carbide market estimates & forecasts, by product, 2018 - 2030 (USD Million)
- Table 36 Spain Spherical silicon carbide market estimates & forecasts, by application, 2018 - 2030 (USD Million)
- Table 37 Italy Spherical silicon carbide market estimates & forecasts, 2018 - 2030 (USD Million)
- Table 38 Italy Spherical silicon carbide market estimates & forecasts, by product, 2018 - 2030 (USD Million)
- Table 39 Italy Spherical silicon carbide market estimates & forecasts, by application, 2018 - 2030 (USD Million)
- Table 40 Asia Pacific Spherical silicon carbide market estimates & forecasts, 2018 - 2030 (USD Million)
- Table 41 Asia Pacific Spherical silicon carbide market estimates & forecasts, by product, 2018 - 2030 (USD Million)
- Table 42 Asia Pacific Spherical silicon carbide market estimates & forecasts, by application, 2018 - 2030 (USD Million)
- Table 43 China Spherical silicon carbide market estimates & forecasts, 2018 - 2030 (USD Million)
- Table 44 China Spherical silicon carbide market estimates & forecasts, by application, 2018 - 2030 (USD Million)
- Table 45 China Spherical silicon carbide market estimates & forecasts, by product, 2018 - 2030 (USD Million)
- Table 46 India Spherical silicon carbide market estimates & forecasts, 2018 - 2030 (USD Million)
- Table 47 India Spherical silicon carbide market estimates & forecasts, by product, 2018 - 2030 (USD Million)
- Table 48 India Spherical silicon carbide market estimates & forecasts, by application, 2018 - 2030 (USD Million)
- Table 49 Japan Spherical silicon carbide market estimates & forecasts, 2018 - 2030 (USD Million)
- Table 50 Japan Spherical silicon carbide market estimates & forecasts, by product, 2018 - 2030 (USD Million)
- Table 51 Japan Spherical silicon carbide market estimates & forecasts, by application, 2018 - 2030 (USD Million)
- Table 52 Central & South America Spherical silicon carbide market estimates & forecasts, 2018 - 2030 (USD Million)
- Table 53 Central & South America Spherical silicon carbide market estimates & forecasts, by product, 2018 - 2030 (USD Million)
- Table 54 Central & South America Spherical silicon carbide market estimates & forecasts, by application, 2018 - 2030 (USD Million)
- Table 55 Brazil Spherical silicon carbide market estimates & forecasts, 2018 - 2030 (USD Million)
- Table 56 Brazil Spherical silicon carbide market estimates & forecasts, by Material, 2018 - 2030 (USD Million)
- Table 57 Brazil Spherical silicon carbide market estimates & forecasts, by Application, 2018 - 2030 (USD Million)
- Table 58 Middle East & Africa Spherical silicon carbide market estimates & forecasts, 2018 - 2030 (USD Million)
- Table 59 Middle East & Africa Spherical silicon carbide market estimates & forecasts, by product, 2018 - 2030 (USD Million)
- Table 60 Middle East & Africa Spherical silicon carbide market estimates & forecasts, by application, 2018 - 2030 (USD Million)
- Table 61 Saudi Arabia Spherical silicon carbide market estimates & forecasts, 2018 - 2030 (USD Million)
- Table 62 Saudi Arabia Spherical silicon carbide market estimates & forecasts, by product, 2018 - 2030 (USD Million)
- Table 63 Saudi Arabia Spherical silicon carbide market estimates & forecasts, by application, 2018 - 2030 (USD Million)
List of Figures
- Fig. 1 Information Procurement
- Fig. 2 Primary Research Pattern
- Fig. 3 Primary Research Process
- Fig. 4 Market Research Approaches - Bottom-Up Approach
- Fig. 5 Market Research Approaches - Top-Down Approach
- Fig. 6 Market Research Approaches - Combined Approach
- Fig. 7 Market Snapshot
- Fig. 8 Segmental Outlook
- Fig. 9 Competitive Outlook
- Fig. 10 Market - Value Chain Analysis
- Fig. 11 Market Drivers Impact Analysis
- Fig. 12 Market Restraint Impact Analysis
- Fig. 13 Industry Analysis - PORTERS
- Fig. 14 Industry Analysis - PESTEL
- Fig. 15 Product: Key Takeaways
- Fig. 16 Product: Market Share, 2023 & 2030
- Fig. 17 Application: Key Takeaways
- Fig. 18 Application: Market Share, 2023 & 2030
- Fig. 19 Region, 2023 & 2030 (USD Million)
- Fig. 20 Regional Marketplace: Key Takeaways
- Fig. 21 Kraljic Matrix
- Fig. 22 Engagement Model
- Fig. 23 Sourcing Best Practices
- Fig. 24 Sourcing Best Practices
- Fig. 25 Competition Categorization
- Fig. 26 Company Market Positioning
- Fig. 27 Strategy Mapping, 2023
Spherical Silicon Carbide Market Trends:
The global spherical silicon carbide market size was estimated at USD 3.68 billion in 2023 and is projected to grow at a CAGR of 11.0% from 2024 to 2030. Silicon carbide's exceptional properties, such as high thermal conductivity, high breakdown voltage, and superior efficiency at high temperatures, make it ideal for the electronics industry. The material is particularly suited for developing high-power devices like electric vehicle (EV) inverters, energy-efficient chips, and semiconductors. As industries push toward next-generation electronics, SiC is used in high-frequency and high-temperature applications. This supports the demand for more efficient electronic components in electric vehicles (EVs), renewable energy systems, and data centers.
Silicon carbide (SiC) plays a crucial role in the renewable energy industry, particularly in solar inverters and wind turbines, where it significantly improves energy efficiency. Its ability to reduce power loss and increase energy conversion efficiency in photovoltaic systems and power grids has driven demand. As countries aim to meet stringent energy goals and reduce carbon footprints, using SiC in renewable energy technologies is expected to expand significantly.
The global shift toward EVs is another critical driver for SiC demand. In EV powertrains, silicon carbide offers higher efficiency than traditional silicon-based devices, leading to longer driving ranges and faster charging capabilities. With major automakers scaling up EV production, the demand for SiC-based semiconductors is expected to rise. In addition, SiC is used in automotive components such as braking systems and engine parts, further boosting its adoption.
Moreover, the aerospace industry is turning to silicon carbide for high-temperature, wear-resistant applications such as jet turbine blades and aerospace electronics. SiC's ability to withstand extreme environments while maintaining its strength makes it a preferred material for producing critical components that must endure high pressures and temperatures. Furthermore, SiC is used in advanced defense systems for sensors and radars, where durability and performance are paramount.
The growing demand for specialty ceramics, especially in defense, aerospace, and electronics sectors, contributes to the rising need for silicon carbide. Its hardness and resistance to wear and corrosion make it ideal for producing durable ceramic components. Industries that require materials with high mechanical strength, such as the automotive and steel sectors, are also turning to SiC-based ceramics to enhance performance and reduce maintenance costs.
Silicon carbide is increasingly used in the steel industry to improve furnace operations and reduce emissions. SiC's high thermal conductivity allows for more efficient energy use, thus enabling cleaner and faster steel production processes. This aligns with the global push towards reducing carbon emissions, particularly in heavy industries like steelmaking, which are traditionally energy-intensive.
Global Spherical Silicon Carbide Market Report Segmentation
This report forecasts revenue growth at global, regional & country levels and provides an analysis of the industry trends in each of the segments from 2018 to 2030. For this study, Grand View Research has segmented the global spherical silicon carbide market based on the product, application, and region:
- Product Outlook (Revenue, USD Million, 2018 - 2030)
- Below 30.0 μm
- 30.0-50.0 μm
- Above 50.0 μm
- Application Outlook (Revenue, USD Million, 2018 - 2030)
- Filler Material
- Ceramic Material
- Coating
- Other
- Regional Outlook (Revenue, USD Million, 2018 - 2030)
- North America
- U.S.
- Canada
- Mexico
- Europe
- Germany
- UK
- France
- Italy
- Spain
- Asia Pacific
- China
- Japan
- India
- Central & South America
- Brazil
- Middle East & Africa
- Saudi Arabia
Table of Contents
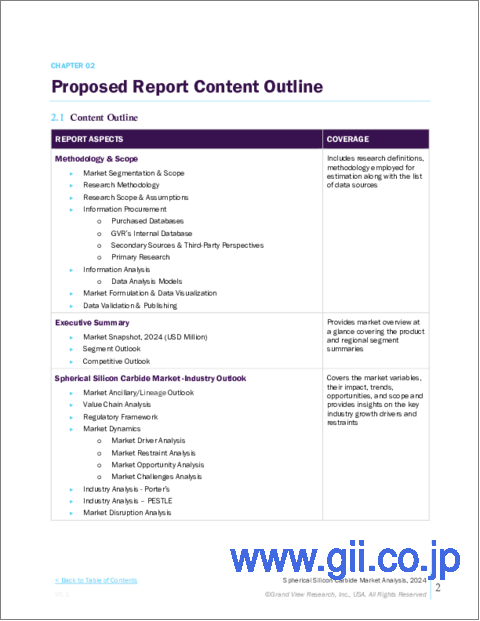
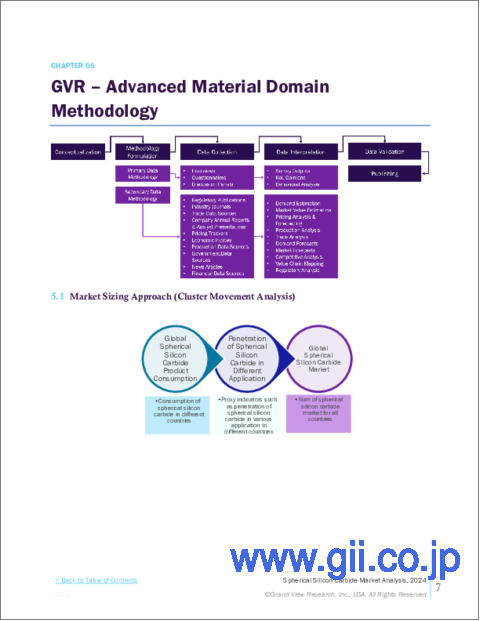
Chapter 1. Methodology and Scope
- 1.1. Research Methodology
- 1.2. Research Scope & Assumption
- 1.3. Information Procurement
- 1.3.1. Purchased Database
- 1.3.2. GVR's Internal Database
- 1.3.3. Secondary Sources & Third-Party Perspectives
- 1.3.4. Primary Research
- 1.4. Information Analysis
- 1.4.1. Data Analysis Models
- 1.5. Market Formulation & Data Visualization
- 1.6. List of Data Sources
Chapter 2. Executive Summary
- 2.1. Market Outlook, 2023 (USD Million)
- 2.2. Segmental Outlook
- 2.3. Competitive Insights
Chapter 3. Spherical Silicon Carbide Market Variables, Trends & Scope
- 3.1. Market Lineage Outlook
- 3.2. Value Chain Analysis
- 3.3. Market Dynamics
- 3.3.1. Market Driver Analysis
- 3.3.2. Market Restraint Analysis
- 3.3.3. Market Opportunity Analysis
- 3.3.4. Market Challenge Analysis
- 3.4. Regulatory Framework
- 3.5. Business Environment Analysis
- 3.5.1. PESTLE Analysis
- 3.5.2. Porter's Five Forces Analysis
- 3.6. Market Disruption Analysis
Chapter 4. Spherical Silicon Carbide Market: Product Estimates & Trend Analysis
- 4.1. Key Takeaways
- 4.2. Product Movement Analysis & Market Share, 2023 & 2030
- 4.3. Market By Product, 2018 - 2030 (USD Million)
- 4.4. Below 30.0 μm
- 4.4.1. Market Estimates & Forecasts, 2018 - 2030 (USD Million)
- 4.5. 30.0-50.0μm
- 4.5.1. Market Estimates & Forecasts, 2018 - 2030 (USD Million)
- 4.6. Above 50.0 μm
- 4.6.1. Market Estimates & Forecasts, 2018 - 2030 (USD Million)
Chapter 5. Spherical Silicon Carbide Market: Application Estimates & Trend Analysis
- 5.1. Key Takeaways
- 5.2. Application Movement Analysis & Market Share, 2023 & 2030
- 5.3. Market By Application, 2018 - 2030 (USD Million)
- 5.4. Filler Material
- 5.4.1. Market Estimates & Forecasts, 2018 - 2030 (USD Million)
- 5.5. Ceramic Material
- 5.5.1. Market Estimates & Forecasts, 2018 - 2030 (USD Million)
- 5.6. Coating
- 5.6.1. Market Estimates & Forecasts, 2018 - 2030 (USD Million)
- 5.7. Other
- 5.7.1. Market Estimates & Forecasts, 2018 - 2030 (USD Million)
Chapter 6. Spherical Silicon Carbide Market: Regional Estimates & Trend Analysis
- 6.1. Key Takeaways
- 6.2. Regional Market Share Analysis, 2023 & 2030
- 6.3. Market Estimates & Forecasts by Region, 2018 - 2030 (USD Million)
- 6.4. North America
- 6.4.1. North America Spherical Silicon Carbide Market Estimates & Forecasts, 2018 - 2030 (USD Million)
- 6.4.2. North America Spherical Silicon Carbide Market Estimates & Forecasts, by Product, 2018 - 2030 (USD Million)
- 6.4.3. North America Spherical Silicon Carbide Market Estimates & Forecasts, by Application, 2018 - 2030 (USD Million)
- 6.4.4. U.S.
- 6.4.4.1. U.S. Spherical Silicon Carbide Market Estimates & Forecasts, 2018 - 2030 (USD Million)
- 6.4.4.2. U.S. Spherical Silicon Carbide Market Estimates & Forecasts, by Product, 2018 - 2030 (USD Million)
- 6.4.4.3. U.S. Spherical Silicon Carbide Market Estimates & Forecasts, by Application, 2018 - 2030 (USD Million)
- 6.4.5. Canada
- 6.4.5.1. Canada Spherical Silicon Carbide Market Estimates & Forecasts, 2018 - 2030 (USD Million)
- 6.4.5.2. Canada Spherical Silicon Carbide Market Estimates & Forecasts, by Product, 2018 - 2030 (USD Million)
- 6.4.5.3. Canada Spherical Silicon Carbide Market Estimates & Forecasts, by Application, 2018 - 2030 (USD Million)
- 6.4.6. Mexico
- 6.4.6.1. Mexico Spherical Silicon Carbide Market Estimates & Forecasts, 2018 - 2030 (USD Million)
- 6.4.6.2. Mexico Spherical Silicon Carbide Market Estimates & Forecasts, by Product, 2018 - 2030 (USD Million)
- 6.4.6.3. Mexico Spherical Silicon Carbide Market Estimates & Forecasts, by Application, 2018 - 2030 (USD Million)
- 6.5. Europe
- 6.5.1. Europe Spherical Silicon Carbide Market Estimates & Forecasts, 2018 - 2030 (USD Million)
- 6.5.2. Europe Spherical Silicon Carbide Market Estimates & Forecasts, by Product, 2018 - 2030 (USD Million)
- 6.5.3. Europe Spherical Silicon Carbide Market Estimates & Forecasts, by Application, 2018 - 2030 (USD Million)
- 6.5.4. Germany
- 6.5.4.1. Germany Spherical Silicon Carbide Market Estimates & Forecasts, 2018 - 2030 (USD Million)
- 6.5.4.2. Germany Spherical Silicon Carbide Market Estimates & Forecasts, by Product, 2018 - 2030 (USD Million)
- 6.5.4.3. Germany Spherical Silicon Carbide Market Estimates & Forecasts, by Application, 2018 - 2030 (USD Million)
- 6.5.5. UK
- 6.5.5.1. UK Spherical Silicon Carbide Market Estimates & Forecasts, 2018 - 2030 (USD Million)
- 6.5.5.2. UK Spherical Silicon Carbide Market Estimates & Forecasts, by Product, 2018 - 2030 (USD Million)
- 6.5.5.3. UK Spherical Silicon Carbide Market Estimates & Forecasts, by Application, 2018 - 2030 (USD Million)
- 6.5.6. France
- 6.5.6.1. France Spherical Silicon Carbide Market Estimates & Forecasts, 2018 - 2030 (USD Million)
- 6.5.6.2. France Spherical Silicon Carbide Market Estimates & Forecasts, by Product, 2018 - 2030 (USD Million)
- 6.5.6.3. France Spherical Silicon Carbide Market Estimates & Forecasts, by Application, 2018 - 2030 (USD Million)
- 6.5.7. Spain
- 6.5.7.1. Spain Spherical Silicon Carbide Market Estimates & Forecasts, 2018 - 2030 (USD Million)
- 6.5.7.2. Spain Spherical Silicon Carbide Market Estimates & Forecasts, by Product, 2018 - 2030 (USD Million)
- 6.5.7.3. Spain Spherical Silicon Carbide Market Estimates & Forecasts, by Application, 2018 - 2030 (USD Million)
- 6.5.8. Italy
- 6.5.8.1. Italy Spherical Silicon Carbide Market Estimates & Forecasts, 2018 - 2030 (USD Million)
- 6.5.8.2. Italy Spherical Silicon Carbide Market Estimates & Forecasts, by Product, 2018 - 2030 (USD Million)
- 6.5.8.3. Italy Spherical Silicon Carbide Market Estimates & Forecasts, by Application, 2018 - 2030 (USD Million)
- 6.6. Asia Pacific
- 6.6.1. Asia Pacific Spherical Silicon Carbide Market Estimates & Forecasts, 2018 - 2030 (USD Million)
- 6.6.2. Asia Pacific Spherical Silicon Carbide Market Estimates & Forecasts, by Product, 2018 - 2030 (USD Million)
- 6.6.3. Asia Pacific Spherical Silicon Carbide Market Estimates & Forecasts, by Application, 2018 - 2030 (USD Million)
- 6.6.4. China
- 6.6.4.1. China Spherical Silicon Carbide Market Estimates & Forecasts, 2018 - 2030 (USD Million)
- 6.6.4.2. China Spherical Silicon Carbide Market Estimates & Forecasts, by Product, 2018 - 2030 (USD Million)
- 6.6.4.3. China Spherical Silicon Carbide Market Estimates & Forecasts, by Application, 2018 - 2030 (USD Million)
- 6.6.5. India
- 6.6.5.1. India Spherical Silicon Carbide Market Estimates & Forecasts, 2018 - 2030 (USD Million)
- 6.6.5.2. India Spherical Silicon Carbide Market Estimates & Forecasts, by Product, 2018 - 2030 (USD Million)
- 6.6.5.3. India Spherical Silicon Carbide Market Estimates & Forecasts, by Application, 2018 - 2030 (USD Million)
- 6.6.6. Japan
- 6.6.6.1. Japan Spherical Silicon Carbide Market Estimates & Forecasts, 2018 - 2030 (USD Million)
- 6.6.6.2. Japan Spherical Silicon Carbide Market Estimates & Forecasts, by Product, 2018 - 2030 (USD Million)
- 6.6.6.3. Japan Spherical Silicon Carbide Market Estimates & Forecasts, by Application, 2018 - 2030 (USD Million)
- 6.7. Central & South America
- 6.7.1. Central & South America Spherical Silicon Carbide Market Estimates & Forecasts, 2018 - 2030 (USD Million)
- 6.7.2. Central & South America Spherical Silicon Carbide Market Estimates & Forecasts, by Product, 2018 - 2030 (USD Million)
- 6.7.3. Central & South America Spherical Silicon Carbide Market Estimates & Forecasts, by Application, 2018 - 2030 (USD Million)
- 6.7.4. Brazil
- 6.7.4.1. Brazil Spherical Silicon Carbide Market Estimates & Forecasts, 2018 - 2030 (USD Million)
- 6.7.4.2. Brazil Spherical Silicon Carbide Market Estimates & Forecasts, by Product, 2018 - 2030 (USD Million)
- 6.7.4.3. Brazil Spherical Silicon Carbide Market Estimates & Forecasts, by Application, 2018 - 2030 (USD Million)
- 6.8. Middle East & Africa
- 6.8.1. Middle East & Africa Spherical Silicon Carbide Market Estimates & Forecasts, 2018 - 2030 (USD Million)
- 6.8.2. Middle East & Africa Spherical Silicon Carbide Market Estimates & Forecasts, by Product, 2018 - 2030 (USD Million)
- 6.8.3. Middle East & Africa Spherical Silicon Carbide Market Estimates & Forecasts, by Application, 2018 - 2030 (USD Million)
- 6.8.4. Saudi Arabia
- 6.8.4.1. Saudi Arabia Spherical Silicon Carbide Market Estimates & Forecasts, 2018 - 2030 (USD Million)
- 6.8.4.2. Saudi Arabia Spherical Silicon Carbide Market Estimates & Forecasts, by Product, 2018 - 2030 (USD Million)
- 6.8.4.3. Saudi Arabia Spherical Silicon Carbide Market Estimates & Forecasts, by Application, 2018 - 2030 (USD Million)
Chapter 7. Supplier Intelligence
- 7.1. Kraljic Matrix
- 7.2. Engagement Model
- 7.3. Negotiation Strategies
- 7.4. Sourcing Best Practices
- 7.5. Vendor Selection Criteria
Chapter 8. Competitive Analysis
- 8.1. Recent Developments & Impact Analysis, By Key Market Participants
- 8.2. Company Categorization
- 8.3. Company Market Positioning
- 8.4. Company Heat Map Analysis
- 8.5. Company Listings
- 8.5.1. Fujimi Corporation
- 8.5.1.1. Company Overview
- 8.5.1.2. Financial Performance
- 8.5.1.3. Product Benchmarking
- 8.5.1.4. Strategic Initiatives
- 8.5.2. Shin-Etsu Chemical
- 8.5.2.1. Company Overview
- 8.5.2.2. Financial Performance
- 8.5.2.3. Product Benchmarking
- 8.5.2.4. Strategic Initiatives
- 8.5.1. Fujimi Corporation
