|
|
市場調査レポート
商品コード
1587496
眼科検査機器の市場規模、シェア、動向分析レポート:製品別、最終用途別、地域別、セグメント予測、2025年~2030年Eye Examination Equipment Market Size, Share & Trends Analysis Report By Product (Ophthalmic Ultrasound Imaging Systems, OCT, Corneal Topography Systems), By End Use (Hospitals, Clinics), By Region, And Segment Forecasts, 2025 - 2030 |
||||||
|
|||||||
カスタマイズ可能
|
|||||||

| 眼科検査機器の市場規模、シェア、動向分析レポート:製品別、最終用途別、地域別、セグメント予測、2025年~2030年 |
|
出版日: 2024年10月17日
発行: Grand View Research
ページ情報: 英文 120 Pages
納期: 2~10営業日
|

全表示
- 概要
- 図表
- 目次
眼科検査機器市場の成長と動向
Grand View Research, Inc.の最新レポートによると、世界の眼科検査機器市場規模は2025~2030年にかけてCAGR 6.2%で拡大し、2030年には57億5,000万米ドルに達すると推定されています。
目に関連する疾患の有病率の増加は、予測期間中に先進的眼科治療処置の需要を促進すると予測されています。
世界の高齢者の増加も検眼/眼科検査機器市場を促進する要因です。2017年6月に発表された米国国勢調査局によると、米国の65歳以上の総人口は、2,000年の3,500万人から2016年には4,920万人に増加し、総人口の15.2%を占め、総人口の12.0%に過ぎなかった。緑内障、白内障、加齢黄斑変性(AMD)を含む加齢関連疾患の症例が増加しており、市場の成長を後押しする可能性が高いです。
眼科検査機器市場レポートハイライト
- 眼疾患の有病率の増加と技術的に進歩した眼科機器の流入が、予測期間中の検眼/眼科検査機器市場の成長を後押しすると予測されます。
- 眼科用超音波イメージングシステムは、Bスキャン超音波の普及率上昇により、今後数年間で最も速い成長が見込まれます。
- 2024年の市場規模は、病院部門が圧倒的であったが、これは病院施設での眼科手術が多いためです。
- 北米の眼科検査機器市場は2024年に最大のシェアを占めたが、これは確立された医療環境と治療施設の存在、技術的に先進的な医療製品に対する需要の急増、有利な償還施設によるものです。
- アジア太平洋の眼科検査機器市場は、予測期間中にCAGR 7.0%で成長すると予測されています。2024年7月、EssilorLuxotticaはドイツに本拠を置くOCTスキャナーの専門会社であるHeidelberg Engineeringの株式80%の取得を完了しました。この買収は、EssilorLuxotticaの医療技術セグメントへの戦略的拡大における大きな前進です。
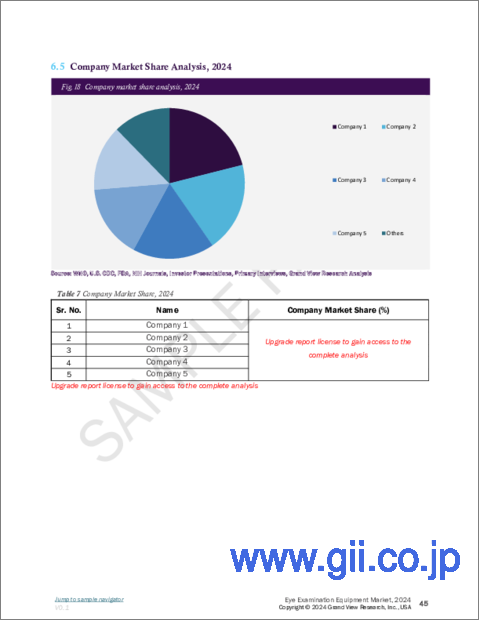
- 市場に参入している主要企業には、Johnson & Johnson Services, Inc.、Alcon、Quantel Medical、Essilor、NIDEK CO. LTD、Canonなどがあります。
目次
第1章 調査手法と範囲
第2章 エグゼクティブサマリー
第3章 眼科検査機器市場の変数、動向、範囲
- 市場系統の展望
- 市場力学
- 市場促進要因分析
- 市場抑制要因分析
- ビジネス環境分析
- 産業分析-ポーターのファイブフォース分析
- PESTLE分析
第4章 眼科検査機器市場:製品ビジネス分析
- 製品市場シェア、2024年と2030年
- 製品セグメントダッシュボード
- 市場規模と予測と動向分析、製品別、2018~2030年
- 光干渉断層撮影スキャナ(OCT)
- 眼科用超音波画像診断システム
- 角膜トポグラフィーシステム
- スリットランプ
- 眼圧計
- 検眼鏡
- 視野計/視野分析装置
- 眼底カメラ
- オートレフラクトメーターと角膜計(フォロプター)
- その他
第5章 眼科検査機器市場:最終用途ビジネス分析
- 最終用途市場シェア、2024年と2030年
- 最終用途セグメントダッシュボード
- 市場規模と予測と動向分析、最終用途別、2018~2030年
- 病院
- クリニック
- その他
第6章 眼科検査機器市場:製品と最終用途別の地域別、推定・動向分析
- 地域別市場シェア分析、2024年と2030年
- 地域別市場ダッシュボード
- 市場規模と予測動向分析、2018~2030年:
- 北米
- 米国
- カナダ
- メキシコ
- 欧州
- 英国
- ドイツ
- フランス
- イタリア
- スペイン
- ノルウェー
- デンマーク
- スウェーデン
- アジア太平洋
- 日本
- 中国
- インド
- 韓国
- オーストラリア
- タイ
- ラテンアメリカ
- ブラジル
- アルゼンチン
- 中東・アフリカ
- 南アフリカ
- サウジアラビア
- アラブ首長国連邦
- クウェート
第7章 競合情勢
- 参加者概要
- 企業の市況分析
- 企業分類
- 戦略マッピング
- 企業プロファイル/上場企業
- Johnson & Johnson Services, Inc.
- Carl Zeiss Meditec AG
- Alcon
- Bausch &Lomb Incorporated
- Quantel Medical
- TOPCON CORPORATION
- Essilor
- NIDEK CO., LTD.
- HAAG-STREIT
- VISIONCARE INC.
List of Tables
- Table 1 List of secondary sources
- Table 2 List of abbreviations
- Table 3 Global eye examination equipment market, by region, 2018 - 2030 (USD Million)
- Table 4 Global eye examination equipment market, by product, 2018 - 2030 (USD Million)
- Table 5 Global eye examination equipment market, by end use, 2018 - 2030 (USD Million)
- Table 6 North America eye examination equipment market, by country, 2018 - 2030 (USD Million)
- Table 7 North America eye examination equipment market, by product, 2018 - 2030 (USD Million)
- Table 8 Million)
- Table 9 North America eye examination equipment market, by end use, 2018 - 2030 (USD Million)
- Table 10 U.S. eye examination equipment market, by product, 2018 - 2030 (USD Million)
- Table 11 U.S. eye examination equipment market, by end use, 2018 - 2030 (USD Million)
- Table 12 Canada eye examination equipment market, by product, 2018 - 2030 (USD Million)
- Table 13 Canada eye examination equipment market, by end use, 2018 - 2030 (USD Million)
- Table 14 Mexico eye examination equipment market, by product, 2018 - 2030 (USD Million)
- Table 15 Mexico eye examination equipment market, by end use, 2018 - 2030 (USD Million)
- Table 16 Europe eye examination equipment market, by country, 2018 - 2030 (USD Million)
- Table 17 Europe eye examination equipment market, by product, 2018 - 2030 (USD Million)
- Table 18 Europe eye examination equipment market, by end use, 2018 - 2030 (USD Million)
- Table 19 UK eye examination equipment market, by product, 2018 - 2030 (USD Million)
- Table 20 UK eye examination equipment market, by end use, 2018 - 2030 (USD Million)
- Table 21 Germany eye examination equipment market, by product, 2018 - 2030 (USD Million)
- Table 22 Germany eye examination equipment market, by end use, 2018 - 2030 (USD Million)
- Table 23 France eye examination equipment market, by product, 2018 - 2030 (USD Million)
- Table 24 France eye examination equipment market, by end use, 2018 - 2030 (USD Million)
- Table 25 Italy eye examination equipment market, by product, 2018 - 2030 (USD Million)
- Table 26 Italy eye examination equipment market, by end use, 2018 - 2030 (USD Million)
- Table 27 Spain eye examination equipment market, by product, 2018 - 2030 (USD Million)
- Table 28 Spain eye examination equipment market, by end use, 2018 - 2030 (USD Million)
- Table 29 Norway eye examination equipment market, by product, 2018 - 2030 (USD Million)
- Table 30 Norway eye examination equipment market, by end use, 2018 - 2030 (USD Million)
- Table 31 Denmark eye examination equipment market, by product, 2018 - 2030 (USD Million)
- Table 32 Denmark eye examination equipment market, by end use, 2018 - 2030 (USD Million)
- Table 33 Sweden eye examination equipment market, by product, 2018 - 2030 (USD Million)
- Table 34 Sweden Eye Examination Equipment market, by end use, 2018 - 2030 (USD Million)
- Table 35 Asia Pacific eye examination equipment market, by country, 2018 - 2030 (USD Million)
- Table 36 Asia Pacific eye examination equipment market, by product, 2018 - 2030 (USD Million)
- Table 37 Asia Pacific eye examination equipment market, by end use, 2018 - 2030 (USD Million)
- Table 38 Japan eye examination equipment market, by product, 2018 - 2030 (USD Million)
- Table 39 Japan eye examination equipment market, by end use, 2018 - 2030 (USD Million)
- Table 40 China eye examination equipment market, by product, 2018 - 2030 (USD Million)
- Table 41 China eye examination equipment market, by end use, 2018 - 2030 (USD Million)
- Table 42 India eye examination equipment market, by product, 2018 - 2030 (USD Million)
- Table 43 India eye examination equipment market, by end use, 2018 - 2030 (USD Million)
- Table 44 Australia eye examination equipment market, by product, 2018 - 2030 (USD Million)
- Table 45 Australia eye examination equipment market, by end use, 2018 - 2030 (USD Million)
- Table 46 South Korea eye examination equipment market, by product, 2018 - 2030 (USD Million)
- Table 47 South Korea eye examination equipment market, by end use, 2018 - 2030 (USD Million)
- Table 48 Thailand eye examination equipment market, by product, 2018 - 2030 (USD Million)
- Table 49 Thailand eye examination equipment market, by end use, 2018 - 2030 (USD Million)
- Table 50 Latin America eye examination equipment market, by country, 2018 - 2030 (USD Million)
- Table 51 Latin America eye examination equipment market, by product, 2018 - 2030 (USD Million)
- Table 52 Latin America eye examination equipment market, by end use, 2018 - 2030 (USD Million)
- Table 53 Brazil eye examination equipment market, by product, 2018 - 2030 (USD Million)
- Table 54 Brazil eye examination equipment market, by end use, 2018 - 2030 (USD Million)
- Table 55 Argentina eye examination equipment market, by product, 2018 - 2030 (USD Million)
- Table 56 Argentina eye examination equipment market, by end use, 2018 - 2030 (USD Million)
- Table 57 Middle East & Africa eye examination equipment market, by country, 2018 - 2030 (USD Million)
- Table 58 Middle East & Africa eye examination equipment market, by product, 2018 - 2030 (USD Million)
- Table 59 Middle East & Africa eye examination equipment market, by end use, 2018 - 2030 (USD Million)
- Table 60 South Africa eye examination equipment market, by product, 2018 - 2030 (USD
- Table 61 South Africa eye examination equipment market, by end use, 2018 - 2030 (USD Million)
- Table 62 Saudi Arabia eye examination equipment market, by product, 2018 - 2030 (USD Million)
- Table 63 Saudi Arabia eye examination equipment market, by end use, 2018 - 2030 (USD Million)
- Table 64 UAE eye examination equipment market, by product, 2018 - 2030 (USD Million)
- Table 65 UAE eye examination equipment market, by end use, 2018 - 2030 (USD Million)
- Table 66 Kuwait eye examination equipment market, by product, 2018 - 2030 (USD Million)
- Table 67 Kuwait eye examination equipment market, by end use, 2018 - 2030 (USD Million)
List of Figures
- Fig. 1 Eye examination equipment market segmentation
- Fig. 2 Market research process
- Fig. 3 Data triangulation techniques
- Fig. 4 Primary research pattern
- Fig. 5 Market research approaches
- Fig. 6 Value-chain-based sizing & forecasting
- Fig. 7 Market formulation & validation
- Fig. 8 Market snapshot
- Fig. 9 Product and end use outlook (USD Million)
- Fig. 10 Competitive landscape
- Fig. 11 Eye examination equipment market dynamics
- Fig. 12 Eye examination equipment market: Porter's five forces analysis
- Fig. 13 Eye examination equipment market: PESTLE analysis
- Fig. 14 Eye examination equipment market: Product segment dashboard
- Fig. 15 Eye examination equipment market: Product market share analysis, 2024 & 2030
- Fig. 16 Optical coherent tomography scanners (OCT) market, 2018 - 2030 (USD Million)
- Fig. 17 Ophthalmic ultrasound imaging systems market, 2018 - 2030 (USD Million)
- Fig. 18 Corneal topography systems market, 2018 - 2030 (USD Million)
- Fig. 19 Slit lamps market, 2018 - 2030 (USD Million)
- Fig. 20 Tonometer devices market, 2018 - 2030 (USD Million)
- Fig. 21 Ophthalmoscopes market, 2018 - 2030 (USD Million)
- Fig. 22 Perimeters/visual field analyzers market, 2018 - 2030 (USD Million)
- Fig. 23 Fundus cameras market, 2018 - 2030 (USD Million)
- Fig. 24 Autorefractors and keratometers (phoropters) market, 2018 - 2030 (USD Million)
- Fig. 25 Eye examination equipment market: End use segment dashboard
- Fig. 26 Eye examination equipment market: End use market share analysis, 2024 & 2030
- Fig. 27 Hospitals market, 2018 - 2030 (USD Million)
- Fig. 28 Clinics market, 2018 - 2030 (USD Million)
- Fig. 29 Others market, 2018 - 2030 (USD Million)
- Fig. 30 Eye examination equipment market revenue, by region
- Fig. 31 Regional marketplace: Key takeaways
- Fig. 32 Regional marketplace: Key takeaways
- Fig. 33 North America eye examination equipment market, 2018 - 2030 (USD Million)
- Fig. 34 U.S. country dynamics
- Fig. 35 U.S. eye examination equipment market, 2018 - 2030 (USD Million)
- Fig. 36 Canada country dynamics
- Fig. 37 Canada eye examination equipment market, 2018 - 2030 (USD Million)
- Fig. 38 Mexico country dynamics
- Fig. 39 Mexico eye examination equipment market, 2018 - 2030 (USD Million)
- Fig. 40 Europe eye examination equipment market, 2018 - 2030 (USD Million)
- Fig. 41 UK country dynamics
- Fig. 42 UK eye examination equipment market, 2018 - 2030 (USD Million)
- Fig. 43 Germany country dynamics
- Fig. 44 Germany eye examination equipment market, 2018 - 2030 (USD Million)
- Fig. 45 France country dynamics
- Fig. 46 France eye examination equipment market, 2018 - 2030 (USD Million)
- Fig. 47 Italy country dynamics
- Fig. 48 Italy eye examination equipment market, 2018 - 2030 (USD Million)
- Fig. 49 Spain country dynamics
- Fig. 50 Spain eye examination equipment market, 2018 - 2030 (USD Million)
- Fig. 51 Norway country dynamics
- Fig. 52 Norway eye examination equipment market, 2018 - 2030 (USD Million)
- Fig. 53 Sweden country dynamics
- Fig. 54 Sweden eye examination equipment market, 2018 - 2030 (USD Million)
- Fig. 55 Denmark country dynamics
- Fig. 56 Denmark eye examination equipment market, 2018 - 2030 (USD Million)
- Fig. 57 Asia Pacific eye examination equipment market, 2018 - 2030 (USD Million)
- Fig. 58 Japan country dynamics
- Fig. 59 Japan eye examination equipment market, 2018 - 2030 (USD Million)
- Fig. 60 China country dynamics
- Fig. 61 China eye examination equipment market, 2018 - 2030 (USD Million)
- Fig. 62 India country dynamics
- Fig. 63 India eye examination equipment market, 2018 - 2030 (USD Million)
- Fig. 64 Australia country dynamics
- Fig. 65 Australia eye examination equipment market, 2018 - 2030 (USD Million)
- Fig. 66 South Korea country dynamics
- Fig. 67 South Korea eye examination equipment market, 2018 - 2030 (USD Million)
- Fig. 68 Thailand country dynamics
- Fig. 69 Thailand eye examination equipment market, 2018 - 2030 (USD Million)
- Fig. 70 Latin America eye examination equipment market, 2018 - 2030 (USD Million)
- Fig. 71 Brazil country dynamics
- Fig. 72 Brazil eye examination equipment market, 2018 - 2030 (USD Million)
- Fig. 73 Argentina country dynamics
- Fig. 74 Argentina eye examination equipment market, 2018 - 2030 (USD Million)
- Fig. 75 MEA eye examination equipment market, 2018 - 2030 (USD Million)
- Fig. 76 South Africa country dynamics
- Fig. 77 South Africa eye examination equipment market, 2018 - 2030 (USD Million)
- Fig. 78 Saudi Arabia country dynamics
- Fig. 79 Saudi Arabia eye examination equipment market, 2018 - 2030 (USD Million)
- Fig. 80 UAE country dynamics
- Fig. 81 UAE eye examination equipment market, 2018 - 2030 (USD Million)
- Fig. 82 Kuwait Key country dynamics
- Fig. 83 Kuwait eye examination equipment market, 2018 - 2030 (USD Million)
- Fig. 84 Company categorization
- Fig. 85 Company market position analysis
- Fig. 86 Strategic framework
Eye Examination Equipment Market Growth & Trends:
The global eye examination equipment market size is estimated to reach USD 5.75 billion by 2030, expanding at a CAGR of 6.2% from 2025 to 2030, according to a new report by Grand View Research, Inc. Increasing prevalence of eye-related disorders is anticipated to drive the demand for advanced ophthalmic treatment procedures over the forecast period.
Growing global geriatric population is another factor propelling the optometry/eye examination equipment market. According to U.S. Census Bureau published on June 2017, the total population aged 65 and older in the U.S. increased to 49.2 million in 2016, accounting for 15.2% of the total population, from 35 million in 2000, which represented only 12.0% of the total population. Mounting cases of age-related disorders including glaucoma, cataracts, and age-related macular degeneration (AMD) are likely to stoke the growth of the market.
Eye Examination Equipment Market Report Highlights:
- Growing prevalence of eye diseases and influx of technologically advanced ophthalmic devices are anticipated to boost the growth of the optometry/eye examination equipment market over the forecast period
- Ophthalmic ultrasound imaging systems are expected to exhibit the fastest growth over the coming years, owing to rising penetration of B-Scan ultrasound
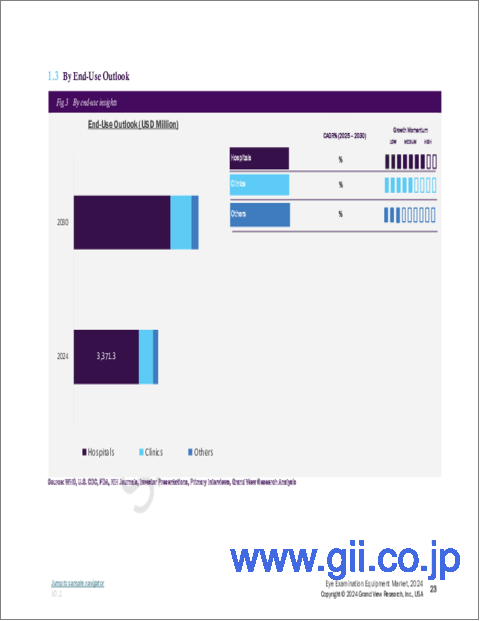
- The hospital segment dominated the market in 2024, owing to the many ophthalmic surgeries performed in these facilities
- The North American eye examination equipment market held the largest share in 2024, due to presence of well-established healthcare setting and treatment facility, surging demand for technologically advanced healthcare products, and favorable reimbursement facilities.
- The Asia Pacific eye examination equipment market is anticipated to grow at a CAGR of 7.0% during the forecast period. In July 2024, EssilorLuxottica completed the acquisition of an 80% stake in Heidelberg Engineering, a German-based company specializing in OCT scanners. This acquisition represents a major step forward in EssilorLuxottica's strategic expansion into the medical technology sector.
- Some of the key companies present in the market are Johnson & Johnson Services, Inc.; Alcon; Quantel Medical; Essilor; NIDEK CO.; LTD; and Canon
Table of Contents
Chapter 1. Methodology and Scope
- 1.1. Market Segmentation & Scope
- 1.2. Segment Definitions
- 1.2.1. Product
- 1.2.2. End Use
- 1.3. Estimates and Forecast Timeline
- 1.4. Research Methodology
- 1.5. Information Procurement
- 1.5.1. Purchased Database
- 1.5.2. GVR's Internal Database
- 1.5.3. Secondary Sources
- 1.5.4. Primary Research
- 1.6. Information Analysis
- 1.6.1. Data Analysis Models
- 1.7. Market Formulation & Data Visualization
- 1.8. Model Details
- 1.8.1. Commodity Flow Analysis
- 1.9. List of Secondary Sources
- 1.10. Objectives
Chapter 2. Executive Summary
- 2.1. Market Snapshot
- 2.2. Segment Snapshot
- 2.3. Competitive Landscape Snapshot
Chapter 3. Eye Examination Equipment Market Variables, Trends, & Scope
- 3.1. Market Lineage Outlook
- 3.2. Market Dynamics
- 3.2.1. Market Driver Analysis
- 3.2.2. Market Restraint Analysis
- 3.3. Business Environment Analysis
- 3.3.1. Industry Analysis - Porter's Five Forces Analysis
- 3.3.1.1. Supplier power
- 3.3.1.2. Buyer power
- 3.3.1.3. Substitution threat
- 3.3.1.4. Threat of new entrant
- 3.3.1.5. Competitive rivalry
- 3.3.2. PESTLE Analysis
- 3.3.1. Industry Analysis - Porter's Five Forces Analysis
Chapter 4. Eye Examination Equipment Market: Product Business Analysis
- 4.1. Product Market Share, 2024 & 2030
- 4.2. Product Segment Dashboard
- 4.3. Market Size & Forecasts and Trend Analysis, by Product, 2018 to 2030 (USD Million)
- 4.4. Optical coherent tomography scanners (OCT)
- 4.4.1. OCT market, 2018 - 2030 (USD Million)
- 4.5. Ophthalmic ultrasound imaging systems
- 4.5.1. Ophthalmic ultrasound imaging systems market, 2018 - 2030 (USD Million)
- 4.6. Corneal topography systems
- 4.6.1. Corneal topography systems market, 2018 - 2030 (USD Million)
- 4.7. Slit lamps
- 4.7.1. Slit lamps market, 2018 - 2030 (USD Million)
- 4.8. Tonometer
- 4.8.1. Tonometer market, 2018 - 2030 (USD Million)
- 4.9. Ophthalmoscopes
- 4.9.1. Ophthalmoscopes market, 2018 - 2030 (USD Million)
- 4.10. Perimeters/visual field analyzers
- 4.10.1. Perimeters/visual field analyzers market, 2018 - 2030 (USD Million)
- 4.11. Fundus cameras
- 4.11.1. Fundus cameras market, 2018 - 2030 (USD Million)
- 4.12. Autorefractors and Keratometers (phoropters)
- 4.12.1. Autorefractors and Keratometers (phoropters) market, 2018 - 2030 (USD Million)
- 4.13. Others
- 4.13.1. Other eye examination equipment market, 2018 - 2030 (USD Million)
Chapter 5. Eye Examination Equipment Market: End Use Business Analysis
- 5.1. End Use Market Share, 2024 & 2030
- 5.2. End Use Segment Dashboard
- 5.3. Market Size & Forecasts and Trend Analysis, by End Use, 2018 to 2030 (USD Million)
- 5.4. Hospitals
- 5.4.1. Eye examination equipment in hospitals market, 2018 - 2030 (USD Million)
- 5.5. Clinics
- 5.5.1. Eye examination equipment in clinics market, 2018 - 2030 (USD Million)
- 5.6. Others
- 5.6.1. Eye examination equipment in other markets, 2018 - 2030 (USD Million)
Chapter 6. Eye Examination Equipment Market: Regional Estimates & Trend Analysis by Product and End Use
- 6.1. Regional Market Share Analysis, 2024 & 2030
- 6.2. Regional Market Dashboard
- 6.3. Market Size & Forecasts Trend Analysis, 2018 to 2030:
- 6.4. North America
- 6.4.1. North America eye examination equipment market estimates and forecasts, 2018 - 2030 (USD Million)
- 6.4.2. U.S.
- 6.4.2.1. Key country dynamic
- 6.4.2.2. Regulatory framework
- 6.4.2.3. Competitive insights
- 6.4.2.4. U.S. eye examination equipment market estimates and forecasts, 2018 - 2030 (USD Million)
- 6.4.3. Canada
- 6.4.3.1. Key country dynamic
- 6.4.3.2. Regulatory framework
- 6.4.3.3. Competitive insights
- 6.4.3.4. Canada eye examination equipment market estimates and forecasts, 2018 - 2030 (USD Million)
- 6.4.4. Mexico
- 6.4.4.1. Key country dynamic
- 6.4.4.2. Regulatory framework
- 6.4.4.3. Competitive insights
- 6.4.4.4. Mexico eye examination equipment market estimates and forecasts, 2018 - 2030 (USD Million)
- 6.5. Europe
- 6.5.1. Europe eye examination equipment market estimates and forecasts, 2018 - 2030 (USD Million)
- 6.5.2. UK
- 6.5.2.1. Key country dynamic
- 6.5.2.2. Regulatory framework
- 6.5.2.3. Competitive insights
- 6.5.2.4. UK eye examination equipment market estimates and forecasts, 2018 - 2030 (USD Million)
- 6.5.3. Germany
- 6.5.3.1. Key country dynamic
- 6.5.3.2. Regulatory framework
- 6.5.3.3. Competitive insights
- 6.5.3.4. Germany eye examination equipment market estimates and forecasts, 2018 - 2030 (USD Million)
- 6.5.4. France
- 6.5.4.1. Key country dynamic
- 6.5.4.2. Regulatory framework
- 6.5.4.3. Competitive insights
- 6.5.4.4. France eye examination equipment market estimates and forecasts, 2018 - 2030 (USD Million)
- 6.5.5. Italy
- 6.5.5.1. Key country dynamic
- 6.5.5.2. Regulatory framework
- 6.5.5.3. Competitive insights
- 6.5.5.4. Italy eye examination equipment market estimates and forecasts, 2018 - 2030 (USD Million)
- 6.5.6. Spain
- 6.5.6.1. Key country dynamic
- 6.5.6.2. Regulatory framework
- 6.5.6.3. Competitive insights
- 6.5.6.4. Spain eye examination equipment market estimates and forecasts, 2018 - 2030 (USD Million)
- 6.5.7. Norway
- 6.5.7.1. Key country dynamic
- 6.5.7.2. Regulatory framework
- 6.5.7.3. Competitive insights
- 6.5.7.4. Norway eye examination equipment market estimates and forecasts, 2018 - 2030 (USD Million)
- 6.5.8. Denmark
- 6.5.8.1. Key country dynamic
- 6.5.8.2. Regulatory framework
- 6.5.8.3. Competitive insights
- 6.5.8.4. Denmark eye examination equipment market estimates and forecasts, 2018 - 2030 (USD Million)
- 6.5.9. Sweden
- 6.5.9.1. Key country dynamic
- 6.5.9.2. Regulatory framework
- 6.5.9.3. Competitive insights
- 6.5.9.4. Sweden eye examination equipment market estimates and forecasts, 2018 - 2030 (USD Million)
- 6.6. Asia Pacific
- 6.6.1. Asia Pacific eye examination equipment market estimates and forecasts, 2018 - 2030 (USD Million)
- 6.6.2. Japan
- 6.6.2.1. Key country dynamic
- 6.6.2.2. Regulatory framework
- 6.6.2.3. Competitive insights
- 6.6.2.4. Japan eye examination equipment market estimates and forecasts, 2018 - 2030 (USD Million)
- 6.6.3. China
- 6.6.3.1. Key country dynamic
- 6.6.3.2. Regulatory framework
- 6.6.3.3. Competitive insights
- 6.6.3.4. China eye examination equipment market estimates and forecasts, 2018 - 2030 (USD Million)
- 6.6.4. India
- 6.6.4.1. Key country dynamic
- 6.6.4.2. Regulatory framework
- 6.6.4.3. Competitive insights
- 6.6.4.4. India eye examination equipment market estimates and forecasts, 2018 - 2030 (USD Million)
- 6.6.5. South Korea
- 6.6.5.1. Key country dynamic
- 6.6.5.2. Regulatory framework
- 6.6.5.3. Competitive insights
- 6.6.5.4. South Korea eye examination equipment market estimates and forecasts, 2018 - 2030 (USD Million)
- 6.6.6. Australia
- 6.6.6.1. Key country dynamic
- 6.6.6.2. Regulatory framework
- 6.6.6.3. Competitive insights
- 6.6.6.4. Australia eye examination equipment market estimates and forecasts, 2018 - 2030 (USD Million)
- 6.6.7. Thailand
- 6.6.7.1. Key country dynamic
- 6.6.7.2. Regulatory framework
- 6.6.7.3. Competitive insights
- 6.6.7.4. Thailand eye examination equipment market estimates and forecasts, 2018 - 2030 (USD Million)
- 6.7. Latin America
- 6.7.1. Latin america eye examination equipment market estimates and forecasts, 2018 - 2030 (USD Million)
- 6.7.2. Brazil
- 6.7.2.1. Key country dynamic
- 6.7.2.2. Regulatory framework
- 6.7.2.3. Competitive insights
- 6.7.2.4. Brazil eye examination equipment market estimates and forecasts, 2018 - 2030 (USD Million)
- 6.7.3. Argentina
- 6.7.3.1. Key country dynamic
- 6.7.3.2. Regulatory framework
- 6.7.3.3. Competitive insights
- 6.7.3.4. Argentina eye examination equipment market estimates and forecasts, 2018 - 2030 (USD Million)
- 6.8. MEA
- 6.8.1. MEA eye examination equipment market estimates and forecasts, 2018 - 2030 (USD Million)
- 6.8.2. South Africa
- 6.8.2.1. Key country dynamic
- 6.8.2.2. Regulatory framework
- 6.8.2.3. Competitive insights
- 6.8.2.4. South Africa eye examination equipment market estimates and forecasts, 2018 - 2030 (USD Million)
- 6.8.3. Saudi Arabia
- 6.8.3.1. Key country dynamic
- 6.8.3.2. Regulatory framework
- 6.8.3.3. Competitive insights
- 6.8.3.4. Saudi Arabia eye examination equipment market estimates and forecasts, 2018 - 2030 (USD Million)
- 6.8.4. UAE
- 6.8.4.1. Key country dynamic
- 6.8.4.2. Regulatory framework
- 6.8.4.3. Competitive insights
- 6.8.4.4. UAE eye examination equipment market estimates and forecasts, 2018 - 2030 (USD Million)
- 6.8.5. Kuwait
- 6.8.5.1. Key country dynamic
- 6.8.5.2. Regulatory framework
- 6.8.5.3. Competitive insights
- 6.8.5.4. Kuwait eye examination equipment market estimates and forecasts, 2018 - 2030 (USD Million)
Chapter 7. Competitive Landscape
- 7.1. Participant Overview
- 7.2. Company Market Position Analysis
- 7.3. Company Categorization
- 7.4. Strategy Mapping
- 7.5. Company Profiles/Listing
- 7.5.1. Johnson & Johnson Services, Inc.
- 7.5.1.1. Overview
- 7.5.1.2. Financial performance
- 7.5.1.3. Product benchmarking
- 7.5.1.4. Strategic initiatives
- 7.5.2. Carl Zeiss Meditec AG
- 7.5.2.1. Overview
- 7.5.2.2. Financial performance
- 7.5.2.3. Product benchmarking
- 7.5.2.4. Strategic initiatives
- 7.5.3. Alcon
- 7.5.3.1. Overview
- 7.5.3.2. Financial performance
- 7.5.3.3. Product benchmarking
- 7.5.3.4. Strategic initiatives
- 7.5.4. Bausch & Lomb Incorporated
- 7.5.4.1. Overview
- 7.5.4.2. Financial performance
- 7.5.4.3. Product benchmarking
- 7.5.4.4. Strategic initiatives
- 7.5.5. Quantel Medical
- 7.5.5.1. Overview
- 7.5.5.2. Financial performance
- 7.5.5.3. Product benchmarking
- 7.5.5.4. Strategic initiatives
- 7.5.6. TOPCON CORPORATION
- 7.5.6.1. Overview
- 7.5.6.2. Financial performance
- 7.5.6.3. Product benchmarking
- 7.5.6.4. Strategic initiatives
- 7.5.7. Essilor
- 7.5.7.1. Overview
- 7.5.7.2. Financial performance
- 7.5.7.3. Product benchmarking
- 7.5.7.4. Strategic initiatives
- 7.5.8. NIDEK CO., LTD.
- 7.5.8.1. Overview
- 7.5.8.2. Financial performance
- 7.5.8.3. Product benchmarking
- 7.5.8.4. Strategic initiatives
- 7.5.9. HAAG-STREIT
- 7.5.9.1. Overview
- 7.5.9.2. Financial performance
- 7.5.9.3. Product benchmarking
- 7.5.9.4. Strategic initiatives
- 7.5.10. VISIONCARE INC.
- 7.5.10.1. Overview
- 7.5.10.2. Financial performance
- 7.5.10.3. Product benchmarking
- 7.5.10.4. Strategic initiatives
- 7.5.1. Johnson & Johnson Services, Inc.

