|
|
市場調査レポート
商品コード
1587476
バスキュラーアクセスデバイスの市場規模、シェア、動向分析レポート:製品別、最終用途別、地域別、セグメント予測、2025年~2030年Vascular Access Devices Market Size, Share & Trends Analysis Report By Product (Short PIVCs, Huber Needles, Midline Catheters, PICCs, CVCs, Dialysis Catheters, Implantable Ports), By End Use, By Region, And Segment Forecasts, 2025 - 2030 |
||||||
|
|||||||
カスタマイズ可能
|
|||||||

| バスキュラーアクセスデバイスの市場規模、シェア、動向分析レポート:製品別、最終用途別、地域別、セグメント予測、2025年~2030年 |
|
出版日: 2024年10月25日
発行: Grand View Research
ページ情報: 英文 200 Pages
納期: 2~10営業日
|

全表示
- 概要
- 図表
- 目次
バスキュラーアクセスデバイス市場の成長と動向:
世界のバスキュラーアクセスデバイス市場規模は、2030年には114億9,000万米ドルに達し、2025年から2030年までの予測期間中にCAGR 4.7%で成長すると予測されています。
高齢者人口の増加、慢性疾患の蔓延、外科手術の件数などが市場拡大に寄与しています。バスキュラーアクセスデバイスを使用することで、血管系にアクセスし、体液、薬物、血液を投与・除去することができます。がんや腎不全を含む重篤な医療疾患の治療には、こうした器具が頻繁に使用されています。バスキュラーアクセスデバイスのニーズは、慢性疾患の有病率の上昇によって牽引されると予想されます。加えて、医療機器の技術的進歩も市場の成長を支えています。
がん、腎臓病、心臓病、高血圧、糖尿病、肥満、うつ病などの慢性疾患の増加は、がんの新規症例の増加につながっています。例えば、GLOBOCAN 2020報告書によると、2020年には19,292,789件の新規がん症例が報告され、そのうち2,261,419件と2,206,771件がそれぞれ乳がんと肺がんに特に関連しています。さらに、2021年4月に発表されたWHOのデータによると、慢性疾患は年間4,100万人(全死亡者の71%)を死亡させ、その77%は低・中所得国で発生しています。今後数年間は、がん罹患率の増加に伴い、バスキュラーアクセスデバイスの需要が高まると思われます。
同市場の主要企業は、市場での存在感を維持するため、新製品の発売や提携に投資しています。例えば、2022年9月にAccess Vascular, Inc.はAssociation for Vascular Access(AVA)と提携しました。この提携は、エビデンスに基づく実践と技術教育によって患者の転帰を向上させることを目的としています。さらに、2020年5月にはSmiths Medical(ICU Medical, Inc.)がAccess Scientific, LLCの事業を買収し、この取引によってSmiths Medicalの血管アクセス製品ポートフォリオが拡充されました。
バスキュラーアクセスデバイス市場レポートハイライト
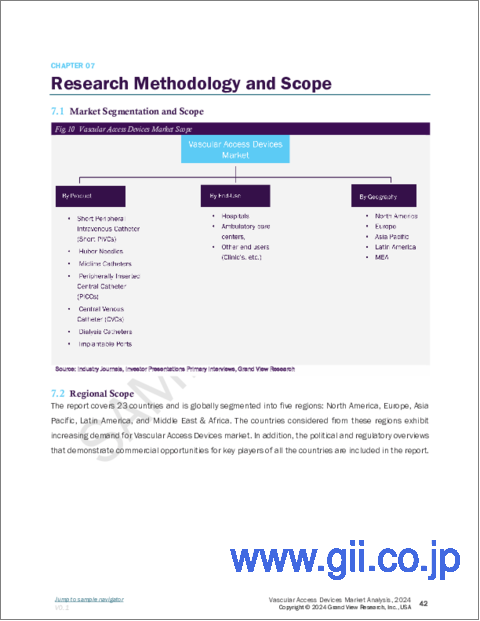
- 製品別では、Short Peripheral Intravenous Catheter(Short PIVCs)、Huber Needles、Midline Catheter、Peripherally Inserted Central Catheter(PICCs)、透析カテーテル、Implantable Ports、中心静脈カテーテルに分類されます。さらに、短い末梢静脈カテーテル(Short PIVCs)セグメントは2024年に44%超の最大市場シェアを占め、予測期間中もその優位性を維持すると予想されます。この背景には、緊急手術の増加や慢性疾患の有病率の上昇があります。
- 市場はさらに最終用途別に区分され、病院、外来手術センター、その他のエンドユーザーが含まれます。病院は2024年に最大の市場シェアを占め、予測期間中もその優位性を維持すると予想されます。これは、設備の整ったヘルスケア施設の存在、高額な医療費、熟練した医療専門家の病院での利用が可能であることに起因しています。
- 北米は2024年に53.35%以上の主要市場シェアを占めました。これは、同地域に高度なヘルスケアインフラが存在すること、慢性疾患の有病率が上昇していることに起因しています。
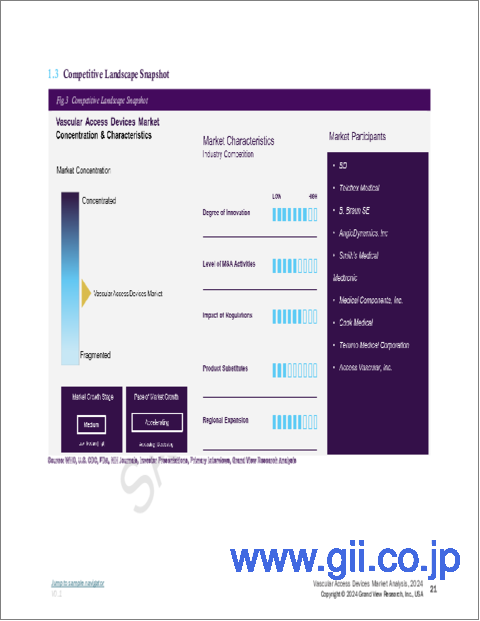
- バスキュラーアクセスデバイスの競合情勢は非常に激しく、多くの企業がさまざまなタイプの製品やサービスを提供しています。この市場の主なプレーヤーには、BD、B. Braun Melsungen AG、Terumo Corporation、Teleflex Incorporated、Smiths Medicalなどがあります。これらの企業は市場シェアを維持するため、継続的に技術革新を行い、新製品や新サービスを投入しています。その他、AngioDynamics、Deltamed、Merit Medical Systemsなどの中小企業も市場に進出しています。
目次
第1章 :調査手法と範囲
第2章 :エグゼクティブサマリー
- 市場スナップショット
- セグメントスナップショット-I
- セグメントスナップショット-II
- 競合情勢
第3章 バスキュラーアクセスデバイス市場の変数と動向
- バスキュラーアクセスデバイス市場の系統的展望
- 補助市場の見通し
- 市場力学
- 市場 促進要因分析
- 市場抑制要因分析
- 業界分析ツール
- ポーターの分析
- マクロ経済分析
第4章 バスキュラーアクセスデバイス市場:製品の推定・動向分析
- 製品市場シェア分析、2024年および2030年
- 製品別
- ショート末梢静脈カテーテル(PVC)
- フーバーニードルズ
- 正中線カテーテル
- 末梢挿入中心静脈カテーテル(PICC)
- 中心静脈カテーテル(CVC)
- 透析カテーテル
- 埋め込み型ポート
第5章 :バスキュラーアクセスデバイス市場: 最終用途の推定・動向分析
- 最終用途市場シェア分析、2024年および2030年
- 最終用途別
- 病院
- 外来診療センター
- その他
第6章 バスキュラーアクセスデバイス市場:地域の推定・動向分析
- バスキュラーアクセスデバイス市場:地域別展望
- 北米
- 米国
- カナダ
- メキシコ
- 欧州
- 英国
- ドイツ
- フランス
- イタリア
- スペイン
- スウェーデン
- デンマーク
- ノルウェー
- アジア太平洋
- 中国
- 日本
- インド
- オーストラリア
- 韓国
- タイ
- ラテンアメリカ
- ブラジル
- アルゼンチン
- 中東・アフリカ(中東・アフリカ)
- 南アフリカ
- サウジアラビア
- アラブ首長国連邦
- クウェート
第7章 競合分析
- 企業分類
- 参加者概要
- 財務実績
- 製品ベンチマーク
- 企業の市況分析
- 戦略マッピング
- 合併と買収
- 製品発売
- 拡張
- その他
第8章 バスキュラーアクセスデバイス市場-競合情勢
- 参入企業の概要
- Bd
- Teleflex Medical
- B. Braun
- Angiodynamics
- Smith's Medical(Icu Medical, Inc)
- Medtronic
- Medical Components, Inc.
- Cook Medical
- Terumo Medical Corporation
- Access Vascular, Inc.
List of Tables
- Table 1 List of Secondary Sources
- Table 2 List of Abbreviations
- Table 3 Global Vascular Access Devices Market, by product, 2018 - 2030 (USD Million)
- Table 4 Global Vascular Access Devices Market, by end-use, 2018 - 2030 (USD Million)
- Table 5 Global Vascular Access Devices Market, by Region, 2018 - 2030 (USD Million)
- Table 6 North America Vascular Access Devices Market, by Country, 2018 - 2030 (USD Million)
- Table 7 North America Vascular Access Devices Market, by product, 2018 - 2030 (USD Million)
- Table 8 North America Vascular Access Devices Market, by end-use, 2018 - 2030 (USD Million)
- Table 9 U.S. Vascular Access Devices Market, by product, 2018 - 2030 (USD Million)
- Table 10 U.S. Vascular Access Devices Market, by end-use, 2018 - 2030 (USD Million)
- Table 11 Canada Vascular Access Devices Market, by product, 2018 - 2030 (USD Million)
- Table 12 Canada Vascular Access Devices Market, by end-use, 2018 - 2030 (USD Million)
- Table 13 Mexico Vascular Access Devices Market, by product, 2018 - 2030 (USD Million)
- Table 14 Mexico Vascular Access Devices Market, by end-use, 2018 - 2030 (USD Million)
- Table 15 Europe Vascular Access Devices Market, by Country, 2018 - 2030 (USD Million)
- Table 16 Europe Vascular Access Devices Market, by product, 2018 - 2030 (USD Million)
- Table 17 Europe Vascular Access Devices Market, by end-use, 2018 - 2030 (USD Million)
- Table 18 Germany Vascular Access Devices Market, by product, 2018 - 2030 (USD Million)
- Table 19 Germany Vascular Access Devices Market, by end-use, 2018 - 2030 (USD Million)
- Table 20 UK Vascular Access Devices Market, by product, 2018 - 2030 (USD Million)
- Table 21 UK Vascular Access Devices Market, by end-use, 2018 - 2030 (USD Million)
- Table 22 France Vascular Access Devices Market, by product, 2018 - 2030 (USD Million)
- Table 23 France Vascular Access Devices Market, by end-use, 2018 - 2030 (USD Million)
- Table 24 Italy Vascular Access Devices Market, by product, 2018 - 2030 (USD Million)
- Table 25 Italy Vascular Access Devices Market, by end-use, 2018 - 2030 (USD Million)
- Table 26 Spain Vascular Access Devices Market, by product, 2018 - 2030 (USD Million)
- Table 27 Spain Vascular Access Devices Market, by end-use, 2018 - 2030 (USD Million)
- Table 28 Sweden Vascular Access Devices Market, by product, 2018 - 2030 (USD Million)
- Table 29 Sweden Vascular Access Devices Market, by end-use, 2018 - 2030 (USD Million)
- Table 30 Denmark Vascular Access Devices Market, by product, 2018 - 2030 (USD Million)
- Table 31 Denmark Vascular Access Devices Market, by end-use, 2018 - 2030 (USD Million)
- Table 32 Norway Vascular Access Devices Market, by product, 2018 - 2030 (USD Million)
- Table 33 Norway Vascular Access Devices Market, by end-use, 2018 - 2030 (USD Million)
- Table 34 Asia Pacific Vascular Access Devices Market, by Country, 2018 - 2030 (USD Million)
- Table 35 Asia Pacific Vascular Access Devices Market, by product, 2018 - 2030 (USD Million)
- Table 36 Asia Pacific Vascular Access Devices Market, by end-use, 2018 - 2030 (USD Million)
- Table 37 China Vascular Access Devices Market, by product, 2018 - 2030 (USD Million)
- Table 38 China Vascular Access Devices Market, by end-use, 2018 - 2030 (USD Million)
- Table 39 Japan Vascular Access Devices Market, by product, 2018 - 2030 (USD Million)
- Table 40 Japan Vascular Access Devices Market, by end-use, 2018 - 2030 (USD Million)
- Table 41 India Vascular Access Devices Market, by product, 2018 - 2030 (USD Million)
- Table 42 India Vascular Access Devices Market, by end-use, 2018 - 2030 (USD Million)
- Table 43 Australia Vascular Access Devices Market, by product, 2018 - 2030 (USD Million)
- Table 44 Australia Vascular Access Devices Market, by end-use, 2018 - 2030 (USD Million)
- Table 45 South Korea Vascular Access Devices Market, by product, 2018 - 2030 (USD Million)
- Table 46 South Korea Vascular Access Devices Market, by end-use, 2018 - 2030 (USD Million)
- Table 47 Thailand Vascular Access Devices Market, by product, 2018 - 2030 (USD Million)
- Table 48 Thailand Vascular Access Devices Market, by end-use, 2018 - 2030 (USD Million)
- Table 49 Latin America Vascular Access Devices Market, by Country, 2018 - 2030 (USD Million)
- Table 50 Latin America Vascular Access Devices Market, by product, 2018 - 2030 (USD Million)
- Table 51 Latin America Vascular Access Devices Market, by end-use, 2018 - 2030 (USD Million)
- Table 52 Brazil Vascular Access Devices Market, by product, 2018 - 2030 (USD Million)
- Table 53 Brazil Vascular Access Devices Market, by end-use, 2018 - 2030 (USD Million)
- Table 54 Argentina Vascular Access Devices Market, by product, 2018 - 2030 (USD Million)
- Table 55 Argentina Vascular Access Devices Market, by end-use, 2018 - 2030 (USD Million)
- Table 56 Middle East & Africa Vascular Access Devices Market, by Country, 2018 - 2030 (USD Million)
- Table 57 Middle East & Africa Vascular Access Devices Market, by product, 2018 - 2030 (USD Million)
- Table 58 Middle East & Africa Vascular Access Devices Market, by end-use, 2018 - 2030 (USD Million)
- Table 59 South Africa Vascular Access Devices Market, by product, 2018 - 2030 (USD Million)
- Table 60 South Africa Vascular Access Devices Market, by end-use, 2018 - 2030 (USD Million)
- Table 61 Saudi Arabia Vascular Access Devices Market, by product, 2018 - 2030 (USD Million)
- Table 62 Saudi Arabia Vascular Access Devices Market, by end-use, 2018 - 2030 (USD Million)
- Table 63 UAE Vascular Access Devices Market, by product, 2018 - 2030 (USD Million)
- Table 64 UAE Vascular Access Devices Market, by end-use, 2018 - 2030 (USD Million)
- Table 65 Kuwait Vascular Access Devices Market, by product, 2018 - 2030 (USD Million)
- Table 66 Kuwait Vascular Access Devices Market, by end-use, 2018 - 2030 (USD Million)
List of Figures
- Fig. 1 Vascular access devices market segmentation
- Fig. 2 Market research process
- Fig. 3 Information procurement
- Fig. 4 Primary research pattern
- Fig. 5 Market research approaches
- Fig. 6 Market formulation & validation
- Fig. 7 Commodity flow analysis
- Fig. 8 Market snapshot
- Fig. 9 Segment snapshot-I
- Fig. 10 Segment snapshot-II
- Fig. 11 Competitive landscape
- Fig. 12 Vascular access devices market dynamics
- Fig. 13 Vascular access devices market: PORTER's analysis
- Fig. 14 Vascular access devices market: PESTEL analysis
- Fig. 15 Vascular access devices market: Product dashboard
- Fig. 16 Vascular access devices market Product movement analysis
- Fig. 17 Short peripheral intravenous catheters (Short PIVCs) market, 2018 - 2030 (USD Million)
- Fig. 18 Huber needles market, 2018 - 2030 (USD Million)
- Fig. 19 Midline catheters market, 2018 - 2030 (USD Million)
- Fig. 20 Peripherally inserted central catheters (PICCs) market, 2018 - 2030 (USD Million)
- Fig. 21 Central venous catheters (CVCs) market, 2018 - 2030 (USD Million)
- Fig. 22 Dialysis catheters market, 2018 - 2030 (USD Million)
- Fig. 23 Implantable ports market, 2018 - 2030 (USD Million)
- Fig. 24 Vascular access devices market: End use dashboard
- Fig. 25 Vascular access devices market End use movement analysis
- Fig. 26 Hospitals market, 2018 - 2030 (USD Million)
- Fig. 27 Ambulatory care centers market, 2018 - 2030 (USD Million)
- Fig. 28 Others market, 2018 - 2030 (USD Million)
- Fig. 29 Vascular access devices market revenue, by region, 2024 & 2030, (USD Million)
- Fig. 30 Regional marketplace: Key takeaways
- Fig. 31 Regional marketplace: Key takeaways
- Fig. 32 North America vascular access devices market estimates and forecast, 2018 - 2030 (USD Million)
- Fig. 33 Key country dynamics
- Fig. 34 U.S. vascular access devices market estimates and forecast, 2018 - 2030 (USD Million)
- Fig. 35 Key country dynamics
- Fig. 36 Technology used by vendors for patient monitoring in Canada
- Fig. 37 Canada vascular access devices market estimates and forecast, 2018 - 2030 (USD Million)
- Fig. 38 Fig Europe vascular access devices market estimates and forecast, 2018 - 2030 (USD Million)
- Fig. 39 Key country dynamics
- Fig. 40 UK vascular access devices market estimates and forecast, 2018 - 2030 (USD Million)
- Fig. 41 Key country dynamics
- Fig. 42 Germany vascular access devices market estimates and forecast, 2018 - 2030 (USD Million)
- Fig. 43 Key country dynamics
- Fig. 44 France vascular access devices market estimates and forecast, 2018 - 2030 (USD Million)
- Fig. 45 Key country dynamics
- Fig. 46 Italy vascular access devices market estimates and forecast, 2018 - 2030 (USD Million)
- Fig. 47 Key country dynamics
- Fig. 48 Spain vascular access devices market estimates and forecast, 2018 - 2030 (USD Million)
- Fig. 49 Key country dynamics
- Fig. 50 Sweden vascular access devices market estimates and forecast, 2018 - 2030 (USD Million)
- Fig. 51 Key country dynamics
- Fig. 52 Denmark vascular access devices market estimates and forecast, 2018 - 2030 (USD Million)
- Fig. 53 Key country dynamics
- Fig. 54 Norway vascular access devices market estimates and forecast, 2018 - 2030 (USD Million)
- Fig. 55 Asia Pacific vascular access devices market estimates and forecast, 2018 - 2030 (USD Million)
- Fig. 56 Key country dynamics
- Fig. 57 China vascular access devices market estimates and forecast, 2018 - 2030 (USD Million)
- Fig. 58 Key country dynamics
- Fig. 59 Japan vascular access devices market estimates and forecast, 2018 - 2030 (USD Million)
- Fig. 60 Key country dynamics
- Fig. 61 India vascular access devices market estimates and forecast, 2018 - 2030 (USD Million)
- Fig. 62 Key country dynamics
- Fig. 63 Australia vascular access devices market estimates and forecast, 2018 - 2030 (USD Million)
- Fig. 64 Key country dynamics
- Fig. 65 South Korea vascular access devices market estimates and forecast, 2018 - 2030 (USD Million) 116
- Fig. 66 Key country dynamics
- Fig. 67 Thailand vascular access devices market estimates and forecast, 2018 - 2030 (USD Million)
- Fig. 68 Latin America vascular access devices market estimates and forecast, 2018 - 2030 (USD Million)
- Fig. 69 Key country dynamics
- Fig. 70 Brazil vascular access devices market estimates and forecast, 2018 - 2030 (USD Million)
- Fig. 71 Key country dynamics
- Fig. 72 Mexico vascular access devices market estimates and forecast, 2018 - 2030 (USD Million)
- Fig. 73 Key country dynamics
- Fig. 74 Argentina vascular access devices market estimates and forecast, 2018 - 2030 (USD Million)
- Fig. 75 MEA vascular access devices market estimates and forecast, 2018 - 2030 (USD Million)
- Fig. 76 Key country dynamics
- Fig. 77 South Africa vascular access devices market estimates and forecast, 2018 - 2030 (USD Million)
- Fig. 78 Key country dynamics
- Fig. 79 Saudi Arabia vascular access devices market estimates and forecast, 2018 - 2030 (USD Million)
- Fig. 80 Key country dynamics
- Fig. 81 UAE vascular access devices market estimates and forecast, 2018 - 2030 (USD Million)
- Fig. 82 Key country dynamics
- Fig. 83 Kuwait vascular access devices market, 2018 - 2030 (USD Million)
- Fig. 84 Key company categorization
- Fig. 85 Overall market share analysis
- Fig. 86 Market share analysis by PIVCs
- Fig. 87 Market share analysis by Huber needles
- Fig. 88 Market share analysis by midline catheters
- Fig. 89 Market share analysis by PICCs
- Fig. 90 Market share analysis by CVCs
- Fig. 91 Market share analysis by dialysis catheters
- Fig. 92 Market share analysis by implantable ports
- Fig. 93 Strategy mapping
Vascular Access Devices Market Growth & Trends:
The global vascular access devices market size is expected to reach USD 11.49 billion in 2030 and is anticipated to grow at a CAGR of 4.7% during the forecast from 2025 to 2030. The rise in the geriatric population, the prevalence of chronic illnesses, and the number of surgical operations all contribute to the market's expansion. The vascular system could be accessed with vascular access devices such that fluids, drugs, and blood can be administered or removed. For the treatment of severe medical illnesses including cancer and renal failure, these devices are frequently employed. The need for vascular access devices is anticipated to be driven by the rising prevalence of chronic disorders. Additionally, technological advancements in medical devices are also likely to support the growth of the market.
An increase in chronic illnesses including cancer, renal disease, heart disease, hypertension, diabetes, obesity, and depression has led to an increase in new cases of cancer. For instance, the GLOBOCAN 2020 report states that 19,292,789 new cancer cases were reported in 2020, out of which 2,261,419 and 2,206,771 were specifically related to breast cancer and lung cancer, respectively. Additionally, according to WHO data released in April 2021, chronic illnesses would cause the deaths of 41 million people per year (71% of all fatalities), with 77% of those deaths occurring in low- and middle-income countries. The demand for vascular access devices would be rising as cancer rates grow in the coming years.
Key players in the market are investing in the launch of new products and collaborations for sustaining their market presence. For instance, in September 2022, Access Vascular, Inc., partnered with the Association for Vascular Access (AVA). This partnership aims to enhance patient outcomes with evidence-based practices and tech education. Moreover, in May 2020, Smiths Medical (ICU Medical, Inc.) acquired Access Scientific, LLC's business; this transaction extends Smiths Medical's vascular access product portfolio.
Vascular Access Devices Market Report Highlights:
- On the basis of product, the market is divided into Short Peripheral Intravenous Catheter (Short PIVCs), Huber Needles, Midline Catheters, Peripherally Inserted Central Catheter (PICCs), Dialysis Catheters, Implantable Ports, and Central venous catheters. Furthermore, the Short Peripheral Intravenous Catheter (Short PIVCs) segment accounted for the largest market share of over 44% in 2024 and is expected to maintain its dominance over the forecast period. This is attributed to the increasing number of emergency surgeries and the rising prevalence of chronic diseases
- The market is further segmented on the basis of end-users, which includes hospitals, ambulatory surgical centers, and other end-users. Hospitals accounted for the largest market share in 2024 and are expected to maintain their dominance over the forecast period. This is attributed to the presence of well-equipped healthcare facilities, high healthcare expenditure, and the availability of skilled healthcare professionals in hospitals
- North America held a major market share of over 53.35% in 2024; this is attributed to the presence of advanced healthcare infrastructure and the rising prevalence of chronic diseases in the regio
- The competitive landscape for vascular access devices is highly competitive, with many companies offering different types of products and services. The major players in this market include BD, B. Braun Melsungen AG, Terumo Corporation, Teleflex Incorporated, and Smiths Medical. These companies are continuously innovating and introducing new products and services to maintain their market share. Other smaller companies such as AngioDynamics, Deltamed, and Merit Medical Systems have a presence in the market
Table of Contents
Chapter 01 Methodology And Scope
- 1.1 Market Segmentation
- 1.1.1 Segment Definitions
- 1.1.1.1 Product Type
- 1.1.1.2 End-Use
- 1.1.1 Segment Definitions
- 1.2 Regional Scope
- 1.3 Estimates And Forecast Timeline
- 1.4 Objectives
- 1.4.1 Objective 1: Understand Market Dynamics
- 1.4.2 Objective 2: Understand Market Estimates & Forecasts
- 1.4.3 Objective 3: Understand Attributes Such As Strategy Framework & Competitive Landscape
- 1.5 Research Methodology
- 1.6 Information Procurement
- 1.6.1 Purchased Database
- 1.7 Information Or Data Analysis
- 1.7.1 Data Analysis Models
- 1.8 Market Formulation & Validation
- 1.9 Model Details
- 1.9.1 Commodity Flow Analysis
- 1.9.2 Market Estimation Methodology
- 1.9.3 Country Based Segment Share Calculation
- 1.9.4 Vascular Access Devices Market: Cagr Calculation
- 1.9.5 Estimated Global Market Share - Research Methodology
- 1.10 List Of Secondary Sources
- 1.11 List Of Primary Sources
- 1.12 List Of Abbreviations
Chapter 02 Executive Summary
- 2.1 Market Snapshot
- 2.2 Segment Snapshot-I
- 2.3 Segment Snapshot-Ii
- 2.4 Competitive Landscape
Chapter 03 Vascular Access Devices Market Variables And Trends
- 3.1 Vascular Access Devices Market Lineage Outlook
- 3.1.1 Ancillary Market Outlook
- 3.2 Market Dynamics
- 3.2.1 Market Driver Analysis
- 3.2.1.1 Growing Prevalence Of Cardiovascular Diseases
- 3.2.1.2 Increasing Need For Vascular Access Devices In Oncology
- 3.2.1.3 Technological Advancements In Vascular Access Devices
- 3.2.1.4 Rising Use Of Vascular Access Devices Among Pediatric Patients
- 3.2.2 Market Restraint Analysis
- 3.2.2.1 Stringent Regulations And Product Recalls
- 3.2.2.2 Risks Associated With Catheter Usage
- 3.2.1 Market Driver Analysis
- 3.3 Industry Analysis Tools
- 3.3.1 Porter's Analysis
- 3.3.2 Macroeconomic Analysis
Chapter 04 Vascular Access Devices Market: Product Estimates & Trend Analysis
- 4.1 Product Market Share Analysis, 2024 & 2030
- 4.2 Vascular Access Devices Market Estimates & Forecast, By Product (USD Million)
- 4.3 Short Peripheral Intravenous Catheters (Pvc)
- 4.3.1 Short Peripheral Intravenous Catheters (Short Pivcs) Market, 2018 - 2030 (USD Million)
- 4.4 Huber Needles
- 4.4.1 Huber Needles Market, 2018 - 2030 (USD Million)
- 4.5 Midline Catheters
- 4.5.1 Midline Catheters Market, 2018 - 2030 (USD Million)
- 4.6 Peripherally Inserted Central Catheters (Piccs)
- 4.6.1 Peripherally Inserted Central Catheters (Piccs) Market, 2018 - 2030 (USD Million)
- 4.7 Central Venous Catheters (Cvcs)
- 4.7.1 Central Venous Catheters (Cvcs) Market, 2018 - 2030 (USD Million)
- 4.8 Dialysis Catheters
- 4.8.1 Dialysis Catheters Market, 2018 - 2030 (USD Million)
- 4.9 Implantable Ports
- 4.9.1 Implantable Ports Market, 2018 - 2030 (USD Million)
Chapter 05 Vascular Access Devices Market: End-Use Estimates & Trend Analysis
- 5.1 End-Use Market Share Analysis, 2024 & 2030
- 5.2 Vascular Access Devices Market Estimates & Forecast, By End Use (USD Million)
- 5.3 Hospitals
- 5.3.1 Hospitals Market Estimates And Forecasts, 2018 - 2030 (USD Million)
- 5.4 Ambulatory Care Centers
- 5.4.1 Ambulatory Care Centers Market Estimates And Forecasts, 2018 - 2030 (USD Million)
- 5.5 Others
- 5.5.1 Others Market Estimates And Forecasts, 2018 - 2030 (USD Million)
Chapter 06 Vascular Access Devices Market: Regional Estimates & Trend Analysis
- 6.1 Vascular Access Devices Market: Regional Outlook
- 6.2 North America
- 6.2.1 North America Vascular Access Devices Market Estimates And Forecast, 2018 - 2030 (USD Million)
- 6.2.2 U.S.
- 6.2.2.1 Key Country Dynamics
- 6.2.2.2 Regulatory Framework & Reimbursement Scenario
- 6.2.2.3 U.S. Vascular Access Devices Market Estimates And Forecast, 2018 - 2030 (USD Million)
- 6.2.3 Canada
- 6.2.3.1 Key Country Dynamics
- 6.2.3.2 Regulatory Framework & Reimbursement Scenario
- 6.2.3.3 Canada Vascular Access Devices Market Estimates And Forecast, 2018 - 2030 (USD Million)
- 6.2.4mexico
- 6.2.4.1 Key Country Dynamics
- 6.2.4.2 Regulatory Framework & Reimbursement Scenario
- 6.2.4.3 Canada Vascular Access Devices Market Estimates And Forecast, 2018 - 2030 (USD Million)
- 6.3 Europe
- 6.3.1 Europe Vascular Access Devices Market Estimates And Forecast, 2018 - 2030 (USD Million)
- 6.3.2 Uk
- 6.3.2.1 Key Country Dynamics
- 6.3.2.2 Regulatory Framework & Reimbursement Scenario
- 6.3.2.3 Uk Vascular Access Devices Market Estimates And Forecast, 2018 - 2030 (USD Million)
- 6.3.3 Germany
- 6.3.3.1 Key Country Dynamics
- 6.3.3.2 Regulatory Framework & Reimbursement Scenario
- 6.3.3.3 Germany Vascular Access Devices Market Estimates And Forecast, 2018 - 2030 (USD Million)
- 6.3.4 France
- 6.3.4.1 Key Country Dynamics
- 6.3.4.2 Regulatory Framework & Reimbursement Scenario
- 6.3.4.3 France Vascular Access Devices Market Estimates And Forecast, 2018 - 2030 (USD Million)
- 6.3.5 Italy
- 6.3.5.1 Key Country Dynamics
- 6.3.5.2 Regulatory Framework & Reimbursement Scenario
- 6.3.5.3 Italy Vascular Access Devices Market Estimates And Forecast, 2018 - 2030 (USD Million)
- 6.3.6 Spain
- 6.3.6.1 Key Country Dynamics
- 6.3.6.2 Regulatory Framework & Reimbursement Scenario
- 6.3.6.3 Spain Vascular Access Devices Market Estimates And Forecast, 2018 - 2030 (USD Million)
- 6.3.7 Sweden
- 6.3.7.1 Key Country Dynamics
- 6.3.7.2 Regulatory Framework & Reimbursement Scenario
- 6.3.7.3 Sweden Vascular Access Devices Market Estimates And Forecast, 2018 - 2030 (USD Million)
- 6.3.8 Denmark
- 6.3.8.1 Key Country Dynamics
- 6.3.8.2 Regulatory Framework & Reimbursement Scenario
- 6.3.8.3 Denmark Vascular Access Devices Market Estimates And Forecast, 2018 - 2030 (USD Million)
- 6.3.9 Norway
- 6.3.9.1 Key Country Dynamics
- 6.3.9.2 Regulatory Framework & Reimbursement Scenario
- 6.3.9.3 Norway Vascular Access Devices Market Estimates And Forecast, 2018 - 2030 (USD Million)
- 6.4 Asia Pacific
- 6.4.1 Asia Pacific Vascular Access Devices Market Estimates And Forecast, 2018 - 2030 (USD Million)
- 6.4.2 China
- 6.4.2.1 Key Country Dynamics
- 6.4.2.2 Regulatory Framework & Reimbursement Scenario
- 6.4.2.3 China Vascular Access Devices Market Estimates And Forecast, 2018 - 2030 (USD Million)
- 6.4.3 Japan
- 6.4.3.1 Key Country Dynamics
- 6.4.3.2 Regulatory Framework & Reimbursement Scenario
- 6.4.3.3 Japan Vascular Access Devices Market Estimates And Forecast, 2018 - 2030 (USD Million)
- 6.4.4 India
- 6.4.4.1 Key Country Dynamics
- 6.4.4.2 Regulatory Framework & Reimbursement Scenario
- 6.4.4.3 India Vascular Access Devices Market Estimates And Forecast, 2018 - 2030 (USD Million)
- 6.4.5 Australia
- 6.4.5.1 Key Country Dynamics
- 6.4.5.2 Regulatory Framework & Reimbursement Scenario
- 6.4.5.3 Australia Vascular Access Devices Market Estimates And Forecast, 2018 - 2030 (USD Million)
- 6.4.6 South Korea
- 6.4.6.1 Key Country Dynamics
- 6.4.6.2 Regulatory Framework & Reimbursement Scenario
- 6.4.6.3 South Korea Vascular Access Devices Market Estimates And Forecast, 2018 - 2030 (USD Million)
- 6.4.7 Thailand
- 6.4.7.1 Key Country Dynamics
- 6.4.7.2 Regulatory Framework & Reimbursement Scenario
- 6.4.7.3 Thailand Vascular Access Devices Market Estimates And Forecast, 2018 - 2030 (USD Million)
- 6.5 Latin America
- 6.5.1 Latin America Vascular Access Devices Market Estimates And Forecast, 2018 - 2030 (USD Million)
- 6.5.2 Brazil
- 6.5.2.1 Key Country Dynamics
- 6.5.2.2 Regulatory Framework & Reimbursement Scenario
- 6.5.2.3 Brazil Vascular Access Devices Market Estimates And Forecast, 2018 - 2030 (USD Million)
- 6.5.3 Argentina
- 6.5.3.1 Key Country Dynamics
- 6.5.3.2 Regulatory Framework & Reimbursement Scenario
- 6.5.3.3 Argentina Vascular Access Devices Market Estimates And Forecast, 2018 - 2030 (USD Million)
- 6.6 Middle East & Africa (MEA)
- 6.6.1 Mea Vascular Access Devices Market Estimates And Forecast, 2018 - 2030 (USD Million)
- 6.6.2 South Africa
- 6.6.2.1 Key Country Dynamics
- 6.6.2.2 Regulatory Framework & Reimbursement Scenario
- 6.6.2.3 South Africa Vascular Access Devices Market Estimates And Forecast, 2018 - 2030 (USD Million)
- 6.6.3 Saudi Arabia
- 6.6.3.1 Key Country Dynamics
- 6.6.3.2 Regulatory Framework & Reimbursement Scenario
- 6.6.3.3 Saudi Arabia Vascular Access Devices Market Estimates And Forecast, 2018 - 2030 (USD Million)
- 6.6.4 UAE
- 6.6.4.1 Key Country Dynamics
- 6.6.4.2 Regulatory Framework & Reimbursement Scenario
- 6.6.4.3 Uae Vascular Access Devices Market Estimates And Forecast, 2018 - 2030 (USD Million)
- 6.6.5 Kuwait
- 6.6.5.1 Key Country Dynamics
- 6.6.5.2 Regulatory Framework & Reimbursement Scenario
- 6.6.5.3 Kuwait Vascular Access Devices Market Estimates And Forecast, 2018 - 2030 (USD Million)
Chapter 07 Competitive Analysis
- 7.1 Company Categorization
- 7.2 Participants' Overview
- 7.3 Financial Performance
- 7.4 Product Benchmarking
- 7.5 Company Market Position Analysis
- 7.5.1 Overall Market Share Analysis
- 7.5.2 Market Share Analysis By Short Peripheral Intravenous Catheter (Short Pivcs)
- 7.5.3 Market Share Analysis By Huber Needles
- 7.5.4 Market Share Analysis By Midline Catheters
- 7.5.5 Market Share Analysis By Peripherally Inserted Central Catheter (Piccs)
- 7.5.6 Market Share Analysis By Central Venous Catheter (Cvcs)
- 7.5.7 Market Share Analysis By Dialysis Catheter
- 7.5.8 Market Share Analysis By Implantable Ports
- 7.6 Strategy Mapping
- 7.6.1 Mergers & Acquisition
- 7.6.2 Product Launch
- 7.6.3 Expansions
- 7.6.5 Others
Chapter 08 Vascular Access Devices Market - Competitive Landscape
- 8.1 Participant's Overview
- 8.1.1 Bd
- 8.1.2 Teleflex Medical
- 8.1.3 B. Braun
- 8.1.4 Angiodynamics
- 8.1.5 Smith's Medical (Icu Medical, Inc)
- 8.1.6 Medtronic
- 8.1.7 Medical Components, Inc.
- 8.1.8 Cook Medical
- 8.1.9 Terumo Medical Corporation
- 8.1.10 Access Vascular, Inc.
