|
|
市場調査レポート
商品コード
1790284
神経血管デバイス市場規模、シェア、動向分析レポート:デバイス別、治療用途別、サイズ別、最終用途別、地域別、セグメント別予測、2025年~2033年Neurovascular Devices Market Size, Share & Trends Analysis Report By Device, By Therapeutic Applications, By Size, By End-use, By Region, And Segment Forecasts, 2025 - 2033 |
||||||
|
|||||||
カスタマイズ可能
|
|||||||

| 神経血管デバイス市場規模、シェア、動向分析レポート:デバイス別、治療用途別、サイズ別、最終用途別、地域別、セグメント別予測、2025年~2033年 |
|
出版日: 2025年07月31日
発行: Grand View Research
ページ情報: 英文 110 Pages
納期: 2~10営業日
|

全表示
- 概要
- 図表
- 目次
神経血管デバイス市場のサマリー
神経血管デバイスの世界市場規模は2024年に73億4,000万米ドルと推計され、2033年には119億1,000万米ドルに達すると予測され、2025年から2033年までのCAGRは5.48%で成長します。この市場を牽引しているのは、神経血管障害の有病率の上昇、医療技術の進歩、低侵襲手技への注目の高まりです。
脳卒中、脳動脈瘤、動静脈奇形(AVM)などの疾患が一般的になるにつれ、効果的な治療オプションに対する需要も増加しています。脳卒中や動脈瘤などの神経血管疾患の有病率の増加は、神経血管機器産業の大きな原動力となっています。血栓回収装置、マイクロカテーテル、流路転換コイルなど、さまざまな神経血管装置がこれらの疾患の治療に利用されています。世界脳卒中機関(WSO)が発表した「Global Stroke Fact Sheet 2024」によると、毎年1,200万人以上の脳卒中が新たに発生し、世界人口の約25%が生涯のうちに脳卒中を経験するといいます。
脳卒中などの神経血管障害の負担は著しく増加しており、血栓回収装置や吸引装置などの神経血栓除去装置などの神経血管装置の需要を促進すると予想されています。
目次
第1章 調査手法と範囲
第2章 エグゼクティブサマリー
第3章 神経血管デバイスの変数、動向、範囲
- 市場系統の見通し
- 親市場の見通し
- 関連/付随市場の見通し
- 市場力学
- 市場促進要因分析
- 市場抑制要因分析
- 市場機会分析
- 市場課題分析
- 神経血管デバイス分析ツール
- 業界分析- ポーターのファイブフォース分析
- PESTEL分析
第4章 神経血管デバイス市場:セグメント分析、デバイス別、2021年~2033年
- 定義と範囲
- デバイス別市場シェア分析、2024年および2033年
- 世界の神経血管デバイス市場(デバイス別、2021~2033年)
- 市場規模と予測および動向分析、2021~2033年
第5章 神経血管デバイス市場:セグメント分析、治療用途別、2021年~2033年
- 定義と範囲
- 治療用途別市場シェア分析、2024年および2033年
- 世界の神経血管デバイス市場(治療用途別、2021~2033年)
- 市場規模と予測および動向分析、2021~2033年
第6章 神経血管デバイス市場:セグメント分析、サイズ別、2021年~2033年
- 定義と範囲
- サイズ別市場シェア分析、2024年および2033年
- 世界の神経血管デバイス市場(サイズ別、2021~2033年)
- 市場規模と予測および動向分析、2021~2033年
第7章 神経血管デバイス市場:セグメント分析、最終用途別、2021年~2033年
- 定義と範囲
- 最終用途別市場シェア分析、2024年および2033年
- 世界の神経血管デバイス市場(最終用途別、2021~2033年)
- 市場規模と予測および動向分析、2021~2033年
第8章 神経血管デバイス市場:地域推定・動向分析
- 地域ダッシュボード
- 市場規模、予測動向分析、2021~2033年:
- 北米
- 米国
- カナダ
- メキシコ
- 欧州
- 英国
- ドイツ
- フランス
- イタリア
- スペイン
- ノルウェー
- スウェーデン
- デンマーク
- アジア太平洋
- 日本
- 中国
- インド
- オーストラリア
- 韓国
- タイ
- ラテンアメリカ
- ブラジル
- アルゼンチン
- 中東・アフリカ
- 南アフリカ
- サウジアラビア
- アラブ首長国連邦
- クウェート
第9章 競合情勢
- 主要市場参入企業による最近の動向と影響分析
- 企業/競合の分類
- イノベーター
- ベンダー情勢
- 主要販売代理店およびチャネルパートナーのリスト
- 主要顧客
- 2024年の世界主要企業の市場シェア分析
- Medtronic
- Stryker
- Terumo Corporation
- Penumbra, Inc.
- Johnson & Johnson and its affiliates
- MicroPort Scientific Corporation
- Acandis GmbH
- ZYLOX-TONBRIDGE MEDICAL TECHNOLOGY CO., LTD.
- NeuroSafe Medical Co., Ltd.
- Rapid Medical
- Evasc Neurovascular Enterprises
- Lepu Medical Technology(Beijing)Co., Ltd.
- phenox GmbH
- ヒートマップ分析/企業市況分析
- 2024年の企業市場シェア予測分析
- その他の主要市場企業のリスト
List of Figures
- Fig. 1 Index of Figures
- Fig. 2 Neurovascular devices market segmentation
- Fig. 3 Market research process
- Fig. 4 Information procurement
- Fig. 5 Primary research pattern
- Fig. 6 Market research approaches
- Fig. 7 Value-chain-based sizing & forecasting
- Fig. 8 QFD modeling for market share assessment
- Fig. 9 Market formulation & validation
- Fig. 10 Market outlook (2024)
- Fig. 11 Segment Outlook
- Fig. 12 Strategy framework
- Fig. 13 Penetration & growth prospect mapping
- Fig. 14 Market driver relevance analysis (Current & future impact)
- Fig. 15 Market restraint relevance analysis (Current & future impact)
- Fig. 16 Porter's five forces analysis
- Fig. 17 SWOT analysis, by factor (political & legal, economic and technological)
- Fig. 18 Neurovascular devices market: Device movement analysis
- Fig. 19 Neurovascular devices market device outlook: Key takeaways
- Fig. 20 Cerebral embolization and aneurysm coiling devices market, 2021 - 2033 (USD Million)
- Fig. 21 Embolic coils market, 2021 - 2033 (USD Million)
- Fig. 22 Flow diverters market, 2021 - 2033 (USD Million)
- Fig. 23 Liquid embolic agents market, 2021 - 2033 (USD Million)
- Fig. 24 Cerebral angioplasty and stenting systems market, 2021 - 2033 (USD Million)
- Fig. 25 Carotid artery stents market, 2021 - 2033 (USD Million)
- Fig. 26 Embolic protection systems devices market, 2021 - 2033 (USD Million)
- Fig. 27 Neurothrombectomy devices market, 2021 - 2033 (USD Million)
- Fig. 28 Clot retrieval devices market, 2021 - 2033 (USD Million)
- Fig. 29 Suction devices market, 2021 - 2033 (USD Million)
- Fig. 30 Vascular snares market, 2021 - 2033 (USD Million)
- Fig. 31 Support devices market, 2021 - 2033 (USD Million)
- Fig. 32 Micro catheters market, 2021 - 2033 (USD Million)
- Fig. 33 Guidewires market, 2021 - 2033 (USD Million)
- Fig. 34 Trans radial access devices market, 2021 - 2033 (USD Million)
- Fig. 35 Neurovascular devices market: Therapeutic application movement analysis
- Fig. 36 Neurovascular devices market therapeutic applications outlook: Key takeaways
- Fig. 37 Stroke market, 2021 - 2033 (USD Million)
- Fig. 38 Cerebral artery stenosis market, 2021 - 2033 (USD Million)
- Fig. 39 Cerebral aneurysm market, 2021 - 2033 (USD Million)
- Fig. 40 Aneurysmal subarachnoid hemorrhage market, 2021 - 2033 (USD Million)
- Fig. 41 Others market, 2021 - 2033 (USD Million)
- Fig. 42 Neurovascular devices market: Size movement analysis
- Fig. 43 Neurovascular devices market size outlook: Key takeaways
- Fig. 44 0.027"market, 2021 - 2033 (USD Million)
- Fig. 45 0.021" market, 2021 - 2033 (USD Million)
- Fig. 46 0.021" market, 2021 - 2033 (USD Million)
- Fig. 47 0.071" market, 2021 - 2033 (USD Million)
- Fig. 48 0.046" market, 2021 - 2033 (USD Million)
- Fig. 49 0.019" market, 2021 - 2033 (USD Million)
- Fig. 50 0.013" market, 2021 - 2033 (USD Million)
- Fig. 51 0.058" market, 2021 - 2033 (USD Million)
- Fig. 52 0.068" market, 2021 - 2033 (USD Million)
- Fig. 53 Others market, 2021 - 2033 (USD Million)
- Fig. 54 Neurovascular devices market: End use movement analysis
- Fig. 55 Neurovascular devices market end use outlook: Key takeaways
- Fig. 56 Hospital market, 2021 - 2033 (USD Million)
- Fig. 57 Specialty clinics market, 2021 - 2033 (USD Million)
- Fig. 58 Others market, 2021 - 2033 (USD Million)
- Fig. 59 Regional outlook, 2024 & 2033
- Fig. 60 Regional market place: Key takeaways
- Fig. 61 North America, SWOT, by PEST
- Fig. 62 Europe, SWOT, by PEST
- Fig. 63 Asia Pacific, SWOT, by PEST
- Fig. 64 Latin America, SWOT, by PEST
- Fig. 65 Middle East and Africa,, SWOT, by PEST
- Fig. 66 North America neurovascular devices market, 2021 - 2033 (USD Million)
- Fig. 67 U.S. neurovascular devices market, 2021 - 2033 (USD Million)
- Fig. 68 Canada neurovascular devices market, 2021 - 2033 (USD Million)
- Fig. 69 Europe neurovascular devices market, 2021 - 2033 (USD Million)
- Fig. 70 UK. neurovascular devices market, 2021 - 2033 (USD Million)
- Fig. 71 Germany neurovascular devices market, 2021 - 2033 (USD Million)
- Fig. 72 France neurovascular devices market, 2021 - 2033 (USD Million)
- Fig. 73 Italy neurovascular devices market, 2021 - 2033 (USD Million)
- Fig. 74 Spain neurovascular devices market, 2021 - 2033 (USD Million)
- Fig. 75 Norway neurovascular devices market, 2021 - 2033 (USD Million)
- Fig. 76 Denmark neurovascular devices market, 2021 - 2033 (USD Million)
- Fig. 77 Sweden neurovascular devices market, 2021 - 2033 (USD Million)
- Fig. 78 Asia Pacific neurovascular devices market, 2021 - 2033 (USD Million)
- Fig. 79 Japan neurovascular devices market, 2021 - 2033 (USD Million)
- Fig. 80 China neurovascular devices market, 2021 - 2033 (USD Million)
- Fig. 81 India neurovascular devices market, 2021 - 2033 (USD Million)
- Fig. 82 Australia neurovascular devices market, 2021 - 2033 (USD Million)
- Fig. 83 South Korea neurovascular devices market, 2021 - 2033 (USD Million)
- Fig. 84 Thailand neurovascular devices market, 2021 - 2033 (USD Million)
- Fig. 85 Latin America neurovascular devices market, 2021 - 2033 (USD Million)
- Fig. 86 Brazil neurovascular devices market, 2021 - 2033 (USD Million)
- Fig. 87 Mexico neurovascular devices market, 2021 - 2033 (USD Million)
- Fig. 88 Argentina neurovascular devices market, 2021 - 2033 (USD Million)
- Fig. 89 MEA neurovascular devices market, 2021 - 2033 (USD Million)
- Fig. 90 South Africa neurovascular devices market, 2021 - 2033 (USD Million)
- Fig. 91 Saudi Arabia neurovascular devices market, 2021 - 2033 (USD Million)
- Fig. 92 UAE neurovascular devices market, 2021 - 2033 (USD Million)
- Fig. 93 Kuwait neurovascular devices market, 2021 - 2033 (USD Million)
List of Tables
- Table 1 List of secondary sources
- Table 2 List of abbreviations
- Table 3 North America neurovascular devices market, by country, 2021 - 2033 (USD Million)
- Table 4 North America neurovascular devices market, by device, 2021 - 2033 (USD Million)
- Table 5 North America neurovascular devices market, by therapeutic application, 2021 - 2033 (USD Million)
- Table 6 North America neurovascular devices market, by size, 2021 - 2033 (USD Million)
- Table 7 North America neurovascular devices market, by end use, 2021 - 2033 (USD Million)
- Table 8 U.S neurovascular devices market, by device, 2021 - 2033 (USD Million)
- Table 9 U.S neurovascular devices, by therapeutic application, 2021 - 2033 (USD Million)
- Table 10 U.S neurovascular devices, by size, 2021 - 2033 (USD Million)
- Table 11 U.S neurovascular devices, by end use, 2021 - 2033 (USD Million)
- Table 12 Canada neurovascular devices market, by device, 2021 - 2033 (USD Million)
- Table 13 Canada neurovascular devices market, by therapeutic application, 2021 - 2033 (USD Million)
- Table 14 Canada neurovascular devices market, by size, 2021 - 2033 (USD Million)
- Table 15 Canada neurovascular devices market, by end use, 2021 - 2033 (USD Million)
- Table 16 Europe neurovascular devices market, by country, 2021 - 2033 (USD Million)
- Table 17 Europe neurovascular devices market, by device, 2021 - 2033 (USD Million)
- Table 18 Europe neurovascular devices market, by therapeutic application, 2021 - 2033 (USD Million)
- Table 19 Europe neurovascular devices market, by size, 2021 - 2033 (USD Million)
- Table 20 Europe neurovascular devices market, by end use, 2021 - 2033 (USD Million)
- Table 21 UK neurovascular devices market, by device, 2021 - 2033 (USD Million)
- Table 22 UK neurovascular devices market, by therapeutic application, 2021 - 2033 (USD Million)
- Table 23 UK neurovascular devices market, by size, 2021 - 2033 (USD Million)
- Table 24 UK neurovascular devices market, by end use, 2021 - 2033 (USD Million)
- Table 25 Germany neurovascular devices market, by device, 2021 - 2033 (USD Million)
- Table 26 Germany neurovascular devices market, by therapeutic application, 2021 - 2033 (USD Million)
- Table 27 Germany neurovascular devices market, by size, 2021 - 2033 (USD Million)
- Table 28 Germany neurovascular devices market, by end use, 2021 - 2033 (USD Million)
- Table 29 France neurovascular devices market, by device, 2021 - 2033 (USD Million)
- Table 30 France neurovascular devices market, by therapeutic application, 2021 - 2033 (USD Million)
- Table 31 France neurovascular devices market, by size, 2021 - 2033 (USD Million)
- Table 32 France neurovascular devices market, by end use, 2021 - 2033 (USD Million)
- Table 33 Italy neurovascular devices market, by device, 2021 - 2033 (USD Million)
- Table 34 Italy neurovascular devices market, by therapeutic application, 2021 - 2033 (USD Million)
- Table 35 Italy neurovascular devices market, by size, 2021 - 2033 (USD Million)
- Table 36 Italy neurovascular devices market, by end use, 2021 - 2033 (USD Million)
- Table 37 Spain neurovascular devices market, by device, 2021 - 2033 (USD Million)
- Table 38 Spain neurovascular devices market, by therapeutic application, 2021 - 2033 (USD Million)
- Table 39 Spain neurovascular devices market, by size, 2021 - 2033 (USD Million)
- Table 40 Spain neurovascular devices market, by end use, 2021 - 2033 (USD Million)
- Table 41 Norway neurovascular devices market, by device, 2021 - 2033 (USD Million)
- Table 42 Norway neurovascular devices market, by therapeutic application, 2021 - 2033 (USD Million)
- Table 43 Norway neurovascular devices market, by size, 2021 - 2033 (USD Million)
- Table 44 Norway neurovascular devices market, by end use, 2021 - 2033 (USD Million)
- Table 45 Sweden neurovascular devices market, by device, 2021 - 2033 (USD Million)
- Table 46 Sweden neurovascular devices market, by therapeutic application, 2021 - 2033 (USD Million)
- Table 47 Sweden neurovascular devices market, by size, 2021 - 2033 (USD Million)
- Table 48 Sweden neurovascular devices market, by end use, 2021 - 2033 (USD Million)
- Table 49 Denmark neurovascular devices market, by device, 2021 - 2033 (USD Million)
- Table 50 Denmark neurovascular devices market, by therapeutic application, 2021 - 2033 (USD Million)
- Table 51 Denmark neurovascular devices market, by size, 2021 - 2033 (USD Million)
- Table 52 Denmark neurovascular devices market, by end use, 2021 - 2033 (USD Million)
- Table 53 Asia Pacific neurovascular devices market, by country, 2021 - 2033 (USD Million)
- Table 54 Asia Pacific neurovascular devices market, by device, 2021 - 2033 (USD Million)
- Table 55 Asia Pacific neurovascular devices market, by therapeutic application, 2021 - 2033 (USD Million)
- Table 56 Asia Pacific neurovascular devices market, by size, 2021 - 2033 (USD Million)
- Table 57 Asia Pacific neurovascular devices market, by end use, 2021 - 2033 (USD Million)
- Table 58 China neurovascular devices market, by device, 2021 - 2033 (USD Million)
- Table 59 China neurovascular devices market, by therapeutic application, 2021 - 2033 (USD Million)
- Table 60 China neurovascular devices market, by size, 2021 - 2033 (USD Million)
- Table 61 China neurovascular devices market, by end use, 2021 - 2033 (USD Million)
- Table 62 Japan neurovascular devices market, by device, 2021 - 2033 (USD Million)
- Table 63 Japan neurovascular devices market, by therapeutic application, 2021 - 2033 (USD Million)
- Table 64 Japan neurovascular devices market, by size, 2021 - 2033 (USD Million)
- Table 65 Japan neurovascular devices market, by end use, 2021 - 2033 (USD Million)
- Table 66 India neurovascular devices market, by device, 2021 - 2033 (USD Million)
- Table 67 India neurovascular devices market, by therapeutic application, 2021 - 2033 (USD Million)
- Table 68 India neurovascular devices market, by size, 2021 - 2033 (USD Million)
- Table 69 India neurovascular devices market, by end use, 2021 - 2033 (USD Million)
- Table 70 Australia neurovascular devices market, by device, 2021 - 2033 (USD Million)
- Table 71 Australia neurovascular devices market, by therapeutic application, 2021 - 2033 (USD Million)
- Table 72 Australia neurovascular devices market, by size, 2021 - 2033 (USD Million)
- Table 73 Australia neurovascular devices market, by end use, 2021 - 2033 (USD Million)
- Table 74 South Korea neurovascular devices market, by device, 2021 - 2033 (USD Million)
- Table 75 South Korea neurovascular devices market, by therapeutic application, 2021 - 2033 (USD Million)
- Table 76 South Korea neurovascular devices market, by size, 2021 - 2033 (USD Million)
- Table 77 South Korea neurovascular devices market, by end use, 2021 - 2033 (USD Million)
- Table 78 Latin America neurovascular devices market, by country, 2021 - 2033 (USD Million)
- Table 79 Latin America neurovascular devices market, by device, 2021 - 2033 (USD Million)
- Table 80 Latin America neurovascular devices market, by therapeutic application, 2021 - 2033 (USD Million)
- Table 81 Latin America neurovascular devices market, by size, 2021 - 2033 (USD Million)
- Table 82 Latin America neurovascular devices market, by end use, 2021 - 2033 (USD Million)
- Table 83 Brazil neurovascular devices market, by device, 2021 - 2033 (USD Million)
- Table 84 Brazil neurovascular devices market, by therapeutic application, 2021 - 2033 (USD Million)
- Table 85 Brazil neurovascular devices market, by size, 2021 - 2033 (USD Million)
- Table 86 Brazil neurovascular devices market, by end use, 2021 - 2033 (USD Million)
- Table 87 Mexico neurovascular devices market, by device, 2021 - 2033 (USD Million)
- Table 88 Mexico neurovascular devices market, by therapeutic application, 2021 - 2033 (USD Million)
- Table 89 Mexico neurovascular devices market, by size, 2021 - 2033 (USD Million)
- Table 90 Mexico neurovascular devices market, by end use, 2021 - 2033 (USD Million)
- Table 91 Argentina neurovascular devices market, by device, 2021 - 2033 (USD Million)
- Table 92 Argentina neurovascular devices market, by therapeutic application, 2021 - 2033 (USD Million)
- Table 93 Argentina neurovascular devices market, by size, 2021 - 2033 (USD Million)
- Table 94 Argentina neurovascular devices market, by end use, 2021 - 2033 (USD Million)
- Table 95 Middle East & Africa neurovascular devices market, by country, 2021 - 2033 (USD Million)
- Table 96 Middle East & Africa neurovascular devices market, by device, 2021 - 2033 (USD Million)
- Table 97 Middle East & Africa neurovascular devices market, by therapeutic application, 2021 - 2033 (USD Million)
- Table 98 Middle East & Africa neurovascular devices market, by size, 2021 - 2033 (USD Million)
- Table 99 Middle East & Africa neurovascular devices market, by end use, 2021 - 2033 (USD Million)
- Table 100 South Africa neurovascular devices market, by device, 2021 - 2033 (USD Million)
- Table 101 South Africa neurovascular devices market, by therapeutic application, 2021 - 2033 (USD Million)
- Table 102 South Africa neurovascular devices market, by size, 2021 - 2033 (USD Million)
- Table 103 South Africa neurovascular devices market, by end use, 2021 - 2033 (USD Million)
- Table 104 Saudi Arabia neurovascular devices market, by device, 2021 - 2033 (USD Million)
- Table 105 Saudi Arabia neurovascular devices market, by therapeutic application, 2021 - 2033 (USD Million)
- Table 106 Saudi Arabia neurovascular devices market, by size, 2021 - 2033 (USD Million)
- Table 107 Saudi Arabia neurovascular devices market, by end use, 2021 - 2033 (USD Million)
- Table 108 UAE neurovascular devices market, by device, 2021 - 2033 (USD Million)
- Table 109 UAE neurovascular devices market, by therapeutic application, 2021 - 2033 (USD Million)
- Table 110 UAE neurovascular devices market, by size, 2021 - 2033 (USD Million)
- Table 111 UAE neurovascular devices market, by end use, 2021 - 2033 (USD Million)
- Table 112 Kuwait neurovascular devices market, by device, 2021 - 2033 (USD Million)
- Table 113 Kuwait neurovascular devices market, by therapeutic application, 2021 - 2033 (USD Million)
- Table 114 Kuwait neurovascular devices market, by size, 2021 - 2033 (USD Million)
- Table 115 Kuwait neurovascular devices market, by end use, 2021 - 2033 (USD Million)
Neurovascular Devices Market Summary
The global neurovascular devices market size was estimated at USD 7.34 billion in 2024 and is projected to reach USD 11.91 billion by 2033, growing at a CAGR of 5.48% from 2025 to 2033. The market is driven by the rising prevalence of neurovascular disorders, advancements in medical technology, and an increasing focus on minimally invasive procedures.
As conditions such as stroke, cerebral aneurysms, and Arteriovenous Malformations (AVM) become more common, the demand for effective treatment options also increases. The increasing prevalence of neurovascular diseases such as strokes and aneurysms is a major driving force behind the neurovascular devices industry. Various neurovascular devices, including clot retrieval devices, microcatheters, and flow diversion coils, are utilized to treat these conditions. According to the Global Stroke Fact Sheet 2024 published by the World Stroke Organization (WSO), more than 12 million new strokes occur annually, and about 25% of the global population will experience a stroke in their lifetime.
The burden of neurovascular disorders, such as strokes, is increasing significantly, which is anticipated to propel the demand for neurovascular devices such as neurothrombectomy devices like clot retrievers and suction devices, among others.
Global Neurovascular Devices Market Report Segmentation
This report forecasts revenue growth at the global, regional, and country levels and provides an analysis of the industry trends in each of the sub-segments from 2021 to 2033. For this study, Grand View Research has segmented the global neurovascular devices market report based on the device, therapeutic application, size, end-use, and region:
- Device Outlook (Revenue, USD Million, 2021 - 2033)
- Cerebral Embolization and Aneurysm Coiling Devices
- Embolic coils
- Flow diversion devices
- Liquid embolic agents
- Cerebral Angioplasty and Stenting Systems
- Carotid artery stents
- Embolic protection systems
- Neurothrombectomy Devices
- Clot retrieval devices
- Suction devices/aspiration catheters
- Vascular snares
- Support Devices
- Micro catheters
- Micro guidewires
- Trans Radial Access Devices
- Therapeutic Application Outlook (Revenue, USD Million, 2021 - 2033)
- Stroke
- Cerebral Artery
- Cerebral Aneurysm
- Aneurysmal Subarachnoid Hemorrhage
- Others
- Others
- Size (in Inches) Outlook (Revenue, USD Million, 2021 - 2033)
- 0.027"
- 0.021"
- 0.071"
- 0.017"
- 0.019"
- 0.013"
- 0.058"
- 0.068"
- Others
- End Use Outlook (Revenue, USD Million, 2021 - 2033)
- Hospitals
- Specialty Clinics
- Others
- Regional Outlook (Revenue, USD Million, 2021 - 2033)
- North America
- U.S.
- Canada
- Mexico
- Europe
- Germany
- UK
- France
- Italy
- Spain
- Norway
- Denmark
- Sweden
- Asia Pacific
- Japan
- China
- India
- Australia
- South Korea
- Thailand
- Latin America
- Brazil
- Argentina
- Middle East and Africa (MEA)
- South Africa
- Saudi Arabia
- UAE
- KuwaitTable of Contents
Chapter 1. Methodology and Scope
- 1.1. Market Segmentation and Scope
- 1.2. Segment Definitions
- 1.2.1. Device
- 1.2.2. Therapeutic Applications
- 1.2.3. Size
- 1.2.4. End Use
- 1.2.5. Regional Scope
- 1.2.6. Estimates and forecasts timeline
- 1.3. Research Methodology
- 1.4. Information Procurement
- 1.4.1. Purchased database
- 1.4.2. GVR's internal database
- 1.4.3. Secondary sources
- 1.4.4. Primary research
- 1.4.5. Details of primary research
- 1.5. Information or Data Analysis
- 1.5.1. Data analysis models
- 1.6. Market Formulation & Validation
- 1.7. Model Details
- 1.7.1. Commodity flow analysis (Model 1)
- 1.7.2. Approach 1: Commodity flow approach
- 1.7.3. Volume price analysis (Model 2)
- 1.7.4. Approach 2: Volume price analysis
- 1.8. List of Secondary Sources
- 1.9. List of Primary Sources
- 1.10. Objectives
Chapter 2. Executive Summary
- 2.1. Market Outlook
- 2.2. Segment Outlook
- 2.3. Regional outlook
- 2.4. Competitive Insights
Chapter 3. Neurovascular Devices Variables, Trends & Scope
- 3.1. Market Lineage Outlook
- 3.1.1. Parent Market Outlook
- 3.1.2. Related/ancillary market outlook
- 3.2. Market Dynamics
- 3.2.1. Market Driver Analysis
- 3.2.1.1. Increasing Prevalence of Neurovascular Diseases
- 3.2.1.2. Technological Advancements in Neurovascular Devices
- 3.2.1.3. Rising Number of Awareness Initiatives
- 3.2.1.4. Increasing Demand for Minimally Invasive Procedures
- 3.2.2. Market Restraint Analysis
- 3.2.2.1. Product Recalls
- 3.2.2.2. High Treatment Cost Associated with Neurovascular Disorders
- 3.2.3. Market Opportunity Analysis
- 3.2.3.1. Growing Number of Clinical Trials
- 3.2.3.2. Launches of Novel Products
- 3.2.3.3. Increasing Research & Development Activities
- 3.2.4. Market Challenge Analysis
- 3.2.4.1. Shortage of Skilled Professionals
- 3.2.4.2. Potential Complications & Risks associated with Neurovascular Devices
- 3.2.1. Market Driver Analysis
- 3.3. Neurovascular Devices Analysis Tools
- 3.3.1. Industry Analysis - Porter's
- 3.3.1.1. Bargaining power of suppliers
- 3.3.1.2. Bargaining power of buyers
- 3.3.1.3. Threat of substitutes
- 3.3.1.4. Threat of new entrants
- 3.3.1.5. Competitive rivalry
- 3.3.2. PESTEL Analysis
- 3.3.2.1. Political landscape
- 3.3.2.2. Economic landscape
- 3.3.2.3. Social landscape
- 3.3.2.4. Technological landscape
- 3.3.2.5. Environmental landscape
- 3.3.2.6. Legal landscape
- 3.3.1. Industry Analysis - Porter's
Chapter 4. Neurovascular Devices Market: Segment Analysis, By Device, 2021 - 2033 (USD Million)
- 4.1. Definition and Scope
- 4.2. Device Market Share Analysis, 2024 & 2033
- 4.3. Global Neurovascular Devices Market, by Device, 2021 to 2033
- 4.4. Market Size & Forecasts and Trend Analyses, 2021 to 2033
- 4.4.1. Cerebral Embolization and Aneurysm Coiling Devices
- 4.4.1.1. Cerebral embolization and aneurysm coiling devices market, 2021 - 2033 (USD Million)
- 4.4.1.2. Embolic coils
- 4.4.1.2.1. Embolic coils market, 2021 - 2033 (USD Million)
- 4.4.1.3. Flow diverters
- 4.4.1.3.1. Flow diverters market, 2021 - 2033 (USD Million)
- 4.4.1.4. Liquid embolic agents
- 4.4.1.4.1. Liquid embolic agents market, 2021 - 2033 (USD Million)
- 4.4.2. Cerebral angioplasty and stenting systems
- 4.4.2.1. Cerebral angioplasty and stenting systems market, 2021 - 2033 (USD Million)
- 4.4.2.2. Carotid Artery Stents
- 4.4.2.2.1. Carotid artery stents market, 2021 - 2033 (USD Million)
- 4.4.2.3. Embolic Protection Devices
- 4.4.2.3.1. Embolic protection systems devices market, 2021 - 2033 (USD Million)
- 4.4.3. Neurothrombectomy devices
- 4.4.3.1. Neurothrombectomy devices market, 2021 - 2033 (USD Million)
- 4.4.3.2. Clot Retrieval Devices
- 4.4.3.2.1. Clot retrieval devices market, 2021 - 2033 (USD Million)
- 4.4.3.3. Suction Devices
- 4.4.3.3.1. Suction devices market, 2021 - 2033 (USD Million)
- 4.4.3.4. Vascular Snares
- 4.4.3.4.1. Vascular snares market, 2021 - 2033 (USD Million)
- 4.4.4. Support devices
- 4.4.4.1. Support devices market, 2021 - 2033 (USD Million)
- 4.4.4.2. Micro Catheters
- 4.4.4.2.1. Micro catheters market, 2021 - 2033 (USD Million)
- 4.4.4.3. Micro Guidewires
- 4.4.4.3.1. Micro guidewires market, 2021 - 2033 (USD Million)
- 4.4.5. Trans Radial Access Devices
- 4.4.5.1. Trans radial access devices market, 2021 - 2033 (USD Million)
- 4.4.1. Cerebral Embolization and Aneurysm Coiling Devices
Chapter 5. Neurovascular Devices Market: Segment Analysis, By Therapeutic Applications, 2021 - 2033 (USD Million)
- 5.1. Definition and Scope
- 5.2. Therapeutic Applications Market Share Analysis, 2024 & 2033
- 5.3. Global Neurovascular Devices Market, by Therapeutic Applications, 2021 to 2033
- 5.4. Market Size & Forecasts and Trend Analyses, 2021 to 2033
- 5.4.1. Stroke
- 5.4.1.1. Stroke market, 2021 - 2033 (USD Million)
- 5.4.2. Cerebral artery stenosis
- 5.4.2.1. Cerebral artery stenosis market, 2021 - 2033 (USD Million)
- 5.4.3. Cerebral aneurysm
- 5.4.3.1. Cerebral aneurysm market, 2021 - 2033 (USD Million)
- 5.4.3.2. Aneurysmal Subarachnoid Hemorrhage
- 5.4.3.2.1. Aneurysmal subarachnoid hemorrhage market, 2021 - 2033 (USD Million)
- 5.4.3.3. Others
- 5.4.3.4. Others market, 2021 - 2033 (USD Million)
- 5.4.4. Others
- 5.4.4.1. Others market, 2021 - 2033 (USD Million)
- 5.4.1. Stroke
Chapter 6. Neurovascular Devices Market: Segment Analysis, By Size, 2021 - 2033 (USD Million)
- 6.1. Definition and Scope
- 6.2. Size Market Share Analysis, 2024 & 2033
- 6.3. Global Neurovascular Devices Market, by Size, 2021 to 2033
- 6.4. Market Size & Forecasts and Trend Analyses, 2021 to 2033
- 6.4.1. 0.027"
- 6.4.1.1. 0.027" market, 2021 - 2033 (USD Million)
- 6.4.2. 0.021"
- 6.4.2.1. 0.021" market, 2021 - 2033 (USD Million)
- 6.4.3. 0.071"
- 6.4.3.1. 0.071" market, 2021 - 2033 (USD Million)
- 6.4.4. 0.017"
- 6.4.4.1. 0.017" market, 2021 - 2033 (USD Million)
- 6.4.5. 0.019"
- 6.4.5.1. 0.019" market, 2021 - 2033 (USD Million)
- 6.4.6. 0.013"
- 6.4.6.1. 0.013" market, 2021 - 2033 (USD Million)
- 6.4.7. 0.058"
- 6.4.7.1. 0.058" market, 2021 - 2033 (USD Million)
- 6.4.8. 0.068"
- 6.4.8.1. 0.068" market, 2021 - 2033 (USD Million)
- 6.4.9. Others
- 6.4.9.1. Others market, 2021 - 2033 (USD Million)
- 6.4.1. 0.027"
Chapter 7. Neurovascular Devices Market: Segment Analysis, By End Use, 2021 - 2033 (USD Million)
- 7.1. Definition and Scope
- 7.2. End Use Market Share Analysis, 2024 & 2033
- 7.3. Global Neurovascular Devices Market, by End Use, 2021 to 2033
- 7.4. Market Size & Forecasts and Trend Analyses, 2021 to 2033
- 7.4.1. Hospital
- 7.4.1.1. Hospital market, 2021 - 2033 (USD Million)
- 7.4.2. Specialty clinics
- 7.4.2.1. Specialty clinics market, 2021 - 2033 (USD Million)
- 7.4.3. Others
- 7.4.3.1. Others market, 2021 - 2033 (USD Million)
- 7.4.1. Hospital
Chapter 8. Neurovascular Devices Market: Regional Estimates & Trend Analysis
- 8.1. Regional Dashboard
- 8.2. Market Size, & Forecasts Trend Analysis, 2021 to 2033:
- 8.3. North America
- 8.3.1. U.S.
- 8.3.1.1. Key country dynamics
- 8.3.1.2. Regulatory framework/ reimbursement structure
- 8.3.1.3. Competitive scenario
- 8.3.1.4. U.S. market estimates and forecasts 2021 to 2033, (USD Million)
- 8.3.2. Canada
- 8.3.2.1. Key country dynamics
- 8.3.2.2. Regulatory framework/ reimbursement structure
- 8.3.2.3. Competitive scenario
- 8.3.2.4. Canada market estimates and forecasts 2021 to 2033, (USD Million)
- 8.3.3. Mexico
- 8.3.3.1. Key country dynamics
- 8.3.3.2. Regulatory framework/ reimbursement structure
- 8.3.3.3. Competitive scenario
- 8.3.3.4. Mexico market estimates and forecasts 2021 to 2033, (USD Million)
- 8.3.1. U.S.
- 8.4. Europe
- 8.4.1. UK
- 8.4.1.1. Key country dynamics
- 8.4.1.2. Regulatory framework/ reimbursement structure
- 8.4.1.3. Competitive scenario
- 8.4.1.4. UK market estimates and forecasts 2021 to 2033, (USD Million)
- 8.4.2. Germany
- 8.4.2.1. Key country dynamics
- 8.4.2.2. Regulatory framework/ reimbursement structure
- 8.4.2.3. Competitive scenario
- 8.4.2.4. Germany market estimates and forecasts 2021 to 2033, (USD Million)
- 8.4.3. France
- 8.4.3.1. Key country dynamics
- 8.4.3.2. Regulatory framework/ reimbursement structure
- 8.4.3.3. Competitive scenario
- 8.4.3.4. France market estimates and forecasts 2021 to 2033, (USD Million)
- 8.4.4. Italy
- 8.4.4.1. Key country dynamics
- 8.4.4.2. Regulatory framework/ reimbursement structure
- 8.4.4.3. Competitive scenario
- 8.4.4.4. Italy market estimates and forecasts 2021 to 2033, (USD Million)
- 8.4.5. Spain
- 8.4.5.1. Key country dynamics
- 8.4.5.2. Regulatory framework/ reimbursement structure
- 8.4.5.3. Competitive scenario
- 8.4.5.4. Spain market estimates and forecasts 2021 to 2033, (USD Million)
- 8.4.6. Norway
- 8.4.6.1. Key country dynamics
- 8.4.6.2. Regulatory framework/ reimbursement structure
- 8.4.6.3. Competitive scenario
- 8.4.6.4. Norway market estimates and forecasts 2021 to 2033, (USD Million)
- 8.4.7. Sweden
- 8.4.7.1. Key country dynamics
- 8.4.7.2. Regulatory framework/ reimbursement structure
- 8.4.7.3. Competitive scenario
- 8.4.7.4. Sweden market estimates and forecasts 2021 to 2033, (USD Million)
- 8.4.8. Denmark
- 8.4.8.1. Key country dynamics
- 8.4.8.2. Regulatory framework/ reimbursement structure
- 8.4.8.3. Competitive scenario
- 8.4.8.4. Denmark market estimates and forecasts 2021 to 2033, (USD Million)
- 8.4.1. UK
- 8.5. Asia Pacific
- 8.5.1. Japan
- 8.5.1.1. Key country dynamics
- 8.5.1.2. Regulatory framework/ reimbursement structure
- 8.5.1.3. Competitive scenario
- 8.5.1.4. Japan market estimates and forecasts 2021 to 2033, (USD Million)
- 8.5.2. China
- 8.5.2.1. Key country dynamics
- 8.5.2.2. Regulatory framework/ reimbursement structure
- 8.5.2.3. Competitive scenario
- 8.5.2.4. China market estimates and forecasts 2021 to 2033, (USD Million)
- 8.5.3. India
- 8.5.3.1. Key country dynamics
- 8.5.3.2. Regulatory framework/ reimbursement structure
- 8.5.3.3. Competitive scenario
- 8.5.3.4. India market estimates and forecasts 2021 to 2033, (USD Million)
- 8.5.4. Australia
- 8.5.4.1. Key country dynamics
- 8.5.4.2. Regulatory framework/ reimbursement structure
- 8.5.4.3. Competitive scenario
- 8.5.4.4. Australia market estimates and forecasts 2021 to 2033, (USD Million)
- 8.5.5. South Korea
- 8.5.5.1. Key country dynamics
- 8.5.5.2. Regulatory framework/ reimbursement structure
- 8.5.5.3. Competitive scenario
- 8.5.5.4. South Korea market estimates and forecasts 2021 to 2033, (USD Million)
- 8.5.6. Thailand
- 8.5.6.1. Key country dynamics
- 8.5.6.2. Regulatory framework/ reimbursement structure
- 8.5.6.3. Competitive scenario
- 8.5.6.4. Thailand market estimates and forecasts 2021 to 2033, (USD Million)
- 8.5.1. Japan
- 8.6. Latin America
- 8.6.1. Brazil
- 8.6.1.1. Key country dynamics
- 8.6.1.2. Regulatory framework/ reimbursement structure
- 8.6.1.3. Competitive scenario
- 8.6.1.4. Brazil market estimates and forecasts 2021 to 2033, (USD Million)
- 8.6.2. Argentina
- 8.6.2.1. Key country dynamics
- 8.6.2.2. Regulatory framework/ reimbursement structure
- 8.6.2.3. Competitive scenario
- 8.6.2.4. Argentina market estimates and forecasts 2021 to 2033, (USD Million)
- 8.6.1. Brazil
- 8.7. MEA
- 8.7.1. South Africa
- 8.7.1.1. Key country dynamics
- 8.7.1.2. Regulatory framework/ reimbursement structure
- 8.7.1.3. Competitive scenario
- 8.7.1.4. South Africa market estimates and forecasts 2021 to 2033, (USD Million)
- 8.7.2. Saudi Arabia
- 8.7.2.1. Key country dynamics
- 8.7.2.2. Regulatory framework/ reimbursement structure
- 8.7.2.3. Competitive scenario
- 8.7.2.4. Saudi Arabia market estimates and forecasts 2021 to 2033, (USD Million)
- 8.7.3. UAE
- 8.7.3.1. Key country dynamics
- 8.7.3.2. Regulatory framework/ reimbursement structure
- 8.7.3.3. Competitive scenario
- 8.7.3.4. UAE market estimates and forecasts 2021 to 2033, (USD Million)
- 8.7.4. Kuwait
- 8.7.4.1. Key country dynamics
- 8.7.4.2. Regulatory framework/ reimbursement structure
- 8.7.4.3. Competitive scenario
- 8.7.4.4. Kuwait market estimates and forecasts 2021 to 2033, (USD Million)
- 8.7.1. South Africa
Chapter 9. Competitive Landscape
- 9.1. Recent Developments & Impact Analysis, By Key Market Participants
- 9.2. Company/Competition Categorization
- 9.3. Innovators
- 9.4. Vendor Landscape
- 9.5. List of key distributors and channel partners
- 9.6. Key customers
- 9.7. Global Key company market share analysis, 2024
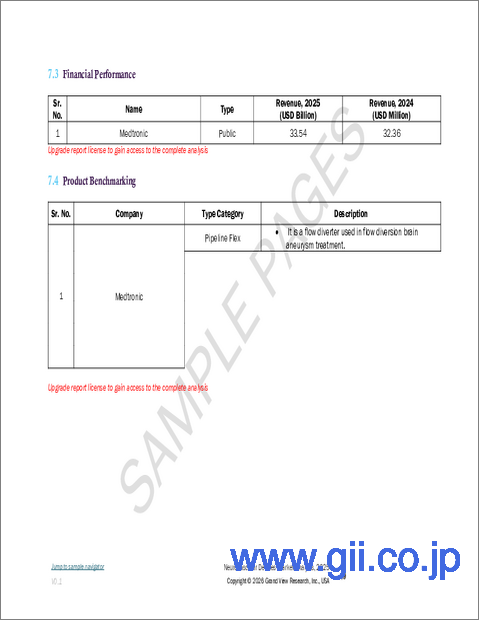
- 9.7.1. Medtronic
- 9.7.1.1. Company overview
- 9.7.1.2. Financial performance
- 9.7.1.3. Product benchmarking
- 9.7.1.4. Strategic initiatives
- 9.7.2. Stryker
- 9.7.2.1. Company overview
- 9.7.2.2. Financial performance
- 9.7.2.3. Product benchmarking
- 9.7.2.4. Strategic initiatives
- 9.7.3. Terumo Corporation
- 9.7.3.1. Company overview
- 9.7.3.2. Financial performance
- 9.7.3.3. Product benchmarking
- 9.7.3.4. Strategic initiatives
- 9.7.4. Penumbra, Inc.
- 9.7.4.1. Company overview
- 9.7.4.2. Financial performance
- 9.7.4.3. Product benchmarking
- 9.7.4.4. Strategic initiatives
- 9.7.5. Johnson & Johnson and its affiliates
- 9.7.5.1. Company overview
- 9.7.5.2. Financial performance
- 9.7.5.3. Product benchmarking
- 9.7.5.4. Strategic initiatives
- 9.7.6. MicroPort Scientific Corporation
- 9.7.6.1. Company overview
- 9.7.6.2. Financial performance
- 9.7.6.3. Product benchmarking
- 9.7.6.4. Strategic initiatives
- 9.7.7. Acandis GmbH
- 9.7.7.1. Company overview
- 9.7.7.2. Financial performance
- 9.7.7.3. Product benchmarking
- 9.7.7.4. Strategic initiatives
- 9.7.8. ZYLOX-TONBRIDGE MEDICAL TECHNOLOGY CO., LTD.
- 9.7.8.1. Company overview
- 9.7.8.2. Financial performance
- 9.7.8.3. Product benchmarking
- 9.7.8.4. Strategic initiatives
- 9.7.9. NeuroSafe Medical Co., Ltd.
- 9.7.9.1. Company overview
- 9.7.9.2. Financial performance
- 9.7.9.3. Product benchmarking
- 9.7.9.4. Strategic initiatives
- 9.7.10. Rapid Medical
- 9.7.10.1. Company overview
- 9.7.10.2. Financial performance
- 9.7.10.3. Product benchmarking
- 9.7.10.4. Strategic initiatives
- 9.7.11. Evasc Neurovascular Enterprises
- 9.7.11.1. Company overview
- 9.7.11.2. Financial performance
- 9.7.11.3. Product benchmarking
- 9.7.11.4. Strategic initiatives
- 9.7.12. Lepu Medical Technology(Beijing)Co., Ltd.
- 9.7.12.1. Company overview
- 9.7.12.2. Financial performance
- 9.7.12.3. Product benchmarking
- 9.7.12.4. Strategic initiatives
- 9.7.13. phenox GmbH
- 9.7.13.1. Company overview
- 9.7.13.2. Financial performance
- 9.7.13.3. Product benchmarking
- 9.7.13.4. Strategic initiatives
- 9.7.1. Medtronic
- 9.8. Heat Map Analysis/ Company Market Position Analysis
- 9.9. Estimated Company Market Share Analysis, 2024
- 9.10. List of Other Key Market Players
Table of Contents
Chapter 1. Methodology and Scope
- 1.1. Market Segmentation and Scope
- 1.2. Segment Definitions
- 1.2.1. Device
- 1.2.2. Therapeutic Applications
- 1.2.3. Size
- 1.2.4. End Use
- 1.2.5. Regional Scope
- 1.2.6. Estimates and forecasts timeline
- 1.3. Research Methodology
- 1.4. Information Procurement
- 1.4.1. Purchased database
- 1.4.2. GVR's internal database
- 1.4.3. Secondary sources
- 1.4.4. Primary research
- 1.4.5. Details of primary research
- 1.5. Information or Data Analysis
- 1.5.1. Data analysis models
- 1.6. Market Formulation & Validation
- 1.7. Model Details
- 1.7.1. Commodity flow analysis (Model 1)
- 1.7.2. Approach 1: Commodity flow approach
- 1.7.3. Volume price analysis (Model 2)
- 1.7.4. Approach 2: Volume price analysis
- 1.8. List of Secondary Sources
- 1.9. List of Primary Sources
- 1.10. Objectives
Chapter 2. Executive Summary
- 2.1. Market Outlook
- 2.2. Segment Outlook
- 2.3. Regional outlook
- 2.4. Competitive Insights
Chapter 3. Neurovascular Devices Variables, Trends & Scope
- 3.1. Market Lineage Outlook
- 3.1.1. Parent Market Outlook
- 3.1.2. Related/ancillary market outlook
- 3.2. Market Dynamics
- 3.2.1. Market Driver Analysis
- 3.2.1.1. Increasing Prevalence of Neurovascular Diseases
- 3.2.1.2. Technological Advancements in Neurovascular Devices
- 3.2.1.3. Rising Number of Awareness Initiatives
- 3.2.1.4. Increasing Demand for Minimally Invasive Procedures
- 3.2.2. Market Restraint Analysis
- 3.2.2.1. Product Recalls
- 3.2.2.2. High Treatment Cost Associated with Neurovascular Disorders
- 3.2.3. Market Opportunity Analysis
- 3.2.3.1. Growing Number of Clinical Trials
- 3.2.3.2. Launches of Novel Products
- 3.2.3.3. Increasing Research & Development Activities
- 3.2.4. Market Challenge Analysis
- 3.2.4.1. Shortage of Skilled Professionals
- 3.2.4.2. Potential Complications & Risks associated with Neurovascular Devices
- 3.2.1. Market Driver Analysis
- 3.3. Neurovascular Devices Analysis Tools
- 3.3.1. Industry Analysis - Porter's
- 3.3.1.1. Bargaining power of suppliers
- 3.3.1.2. Bargaining power of buyers
- 3.3.1.3. Threat of substitutes
- 3.3.1.4. Threat of new entrants
- 3.3.1.5. Competitive rivalry
- 3.3.2. PESTEL Analysis
- 3.3.2.1. Political landscape
- 3.3.2.2. Economic landscape
- 3.3.2.3. Social landscape
- 3.3.2.4. Technological landscape
- 3.3.2.5. Environmental landscape
- 3.3.2.6. Legal landscape
- 3.3.1. Industry Analysis - Porter's
Chapter 4. Neurovascular Devices Market: Segment Analysis, By Device, 2021 - 2033 (USD Million)
- 4.1. Definition and Scope
- 4.2. Device Market Share Analysis, 2024 & 2033
- 4.3. Global Neurovascular Devices Market, by Device, 2021 to 2033
- 4.4. Market Size & Forecasts and Trend Analyses, 2021 to 2033
- 4.4.1. Cerebral Embolization and Aneurysm Coiling Devices
- 4.4.1.1. Cerebral embolization and aneurysm coiling devices market, 2021 - 2033 (USD Million)
- 4.4.1.2. Embolic coils
- 4.4.1.2.1. Embolic coils market, 2021 - 2033 (USD Million)
- 4.4.1.3. Flow diverters
- 4.4.1.3.1. Flow diverters market, 2021 - 2033 (USD Million)
- 4.4.1.4. Liquid embolic agents
- 4.4.1.4.1. Liquid embolic agents market, 2021 - 2033 (USD Million)
- 4.4.2. Cerebral angioplasty and stenting systems
- 4.4.2.1. Cerebral angioplasty and stenting systems market, 2021 - 2033 (USD Million)
- 4.4.2.2. Carotid Artery Stents
- 4.4.2.2.1. Carotid artery stents market, 2021 - 2033 (USD Million)
- 4.4.2.3. Embolic Protection Devices
- 4.4.2.3.1. Embolic protection systems devices market, 2021 - 2033 (USD Million)
- 4.4.3. Neurothrombectomy devices
- 4.4.3.1. Neurothrombectomy devices market, 2021 - 2033 (USD Million)
- 4.4.3.2. Clot Retrieval Devices
- 4.4.3.2.1. Clot retrieval devices market, 2021 - 2033 (USD Million)
- 4.4.3.3. Suction Devices
- 4.4.3.3.1. Suction devices market, 2021 - 2033 (USD Million)
- 4.4.3.4. Vascular Snares
- 4.4.3.4.1. Vascular snares market, 2021 - 2033 (USD Million)
- 4.4.4. Support devices
- 4.4.4.1. Support devices market, 2021 - 2033 (USD Million)
- 4.4.4.2. Micro Catheters
- 4.4.4.2.1. Micro catheters market, 2021 - 2033 (USD Million)
- 4.4.4.3. Micro Guidewires
- 4.4.4.3.1. Micro guidewires market, 2021 - 2033 (USD Million)
- 4.4.5. Trans Radial Access Devices
- 4.4.5.1. Trans radial access devices market, 2021 - 2033 (USD Million)
- 4.4.1. Cerebral Embolization and Aneurysm Coiling Devices
Chapter 5. Neurovascular Devices Market: Segment Analysis, By Therapeutic Applications, 2021 - 2033 (USD Million)
- 5.1. Definition and Scope
- 5.2. Therapeutic Applications Market Share Analysis, 2024 & 2033
- 5.3. Global Neurovascular Devices Market, by Therapeutic Applications, 2021 to 2033
- 5.4. Market Size & Forecasts and Trend Analyses, 2021 to 2033
- 5.4.1. Stroke
- 5.4.1.1. Stroke market, 2021 - 2033 (USD Million)
- 5.4.2. Cerebral artery stenosis
- 5.4.2.1. Cerebral artery stenosis market, 2021 - 2033 (USD Million)
- 5.4.3. Cerebral aneurysm
- 5.4.3.1. Cerebral aneurysm market, 2021 - 2033 (USD Million)
- 5.4.3.2. Aneurysmal Subarachnoid Hemorrhage
- 5.4.3.2.1. Aneurysmal subarachnoid hemorrhage market, 2021 - 2033 (USD Million)
- 5.4.3.3. Others
- 5.4.3.4. Others market, 2021 - 2033 (USD Million)
- 5.4.4. Others
- 5.4.4.1. Others market, 2021 - 2033 (USD Million)
- 5.4.1. Stroke
Chapter 6. Neurovascular Devices Market: Segment Analysis, By Size, 2021 - 2033 (USD Million)
- 6.1. Definition and Scope
- 6.2. Size Market Share Analysis, 2024 & 2033
- 6.3. Global Neurovascular Devices Market, by Size, 2021 to 2033
- 6.4. Market Size & Forecasts and Trend Analyses, 2021 to 2033
- 6.4.1. 0.027"
- 6.4.1.1. 0.027" market, 2021 - 2033 (USD Million)
- 6.4.2. 0.021"
- 6.4.2.1. 0.021" market, 2021 - 2033 (USD Million)
- 6.4.3. 0.071"
- 6.4.3.1. 0.071" market, 2021 - 2033 (USD Million)
- 6.4.4. 0.017"
- 6.4.4.1. 0.017" market, 2021 - 2033 (USD Million)
- 6.4.5. 0.019"
- 6.4.5.1. 0.019" market, 2021 - 2033 (USD Million)
- 6.4.6. 0.013"
- 6.4.6.1. 0.013" market, 2021 - 2033 (USD Million)
- 6.4.7. 0.058"
- 6.4.7.1. 0.058" market, 2021 - 2033 (USD Million)
- 6.4.8. 0.068"
- 6.4.8.1. 0.068" market, 2021 - 2033 (USD Million)
- 6.4.9. Others
- 6.4.9.1. Others market, 2021 - 2033 (USD Million)
- 6.4.1. 0.027"
Chapter 7. Neurovascular Devices Market: Segment Analysis, By End Use, 2021 - 2033 (USD Million)
- 7.1. Definition and Scope
- 7.2. End Use Market Share Analysis, 2024 & 2033
- 7.3. Global Neurovascular Devices Market, by End Use, 2021 to 2033
- 7.4. Market Size & Forecasts and Trend Analyses, 2021 to 2033
- 7.4.1. Hospital
- 7.4.1.1. Hospital market, 2021 - 2033 (USD Million)
- 7.4.2. Specialty clinics
- 7.4.2.1. Specialty clinics market, 2021 - 2033 (USD Million)
- 7.4.3. Others
- 7.4.3.1. Others market, 2021 - 2033 (USD Million)
- 7.4.1. Hospital
Chapter 8. Neurovascular Devices Market: Regional Estimates & Trend Analysis
- 8.1. Regional Dashboard
- 8.2. Market Size, & Forecasts Trend Analysis, 2021 to 2033:
- 8.3. North America
- 8.3.1. U.S.
- 8.3.1.1. Key country dynamics
- 8.3.1.2. Regulatory framework/ reimbursement structure
- 8.3.1.3. Competitive scenario
- 8.3.1.4. U.S. market estimates and forecasts 2021 to 2033, (USD Million)
- 8.3.2. Canada
- 8.3.2.1. Key country dynamics
- 8.3.2.2. Regulatory framework/ reimbursement structure
- 8.3.2.3. Competitive scenario
- 8.3.2.4. Canada market estimates and forecasts 2021 to 2033, (USD Million)
- 8.3.3. Mexico
- 8.3.3.1. Key country dynamics
- 8.3.3.2. Regulatory framework/ reimbursement structure
- 8.3.3.3. Competitive scenario
- 8.3.3.4. Mexico market estimates and forecasts 2021 to 2033, (USD Million)
- 8.3.1. U.S.
- 8.4. Europe
- 8.4.1. UK
- 8.4.1.1. Key country dynamics
- 8.4.1.2. Regulatory framework/ reimbursement structure
- 8.4.1.3. Competitive scenario
- 8.4.1.4. UK market estimates and forecasts 2021 to 2033, (USD Million)
- 8.4.2. Germany
- 8.4.2.1. Key country dynamics
- 8.4.2.2. Regulatory framework/ reimbursement structure
- 8.4.2.3. Competitive scenario
- 8.4.2.4. Germany market estimates and forecasts 2021 to 2033, (USD Million)
- 8.4.3. France
- 8.4.3.1. Key country dynamics
- 8.4.3.2. Regulatory framework/ reimbursement structure
- 8.4.3.3. Competitive scenario
- 8.4.3.4. France market estimates and forecasts 2021 to 2033, (USD Million)
- 8.4.4. Italy
- 8.4.4.1. Key country dynamics
- 8.4.4.2. Regulatory framework/ reimbursement structure
- 8.4.4.3. Competitive scenario
- 8.4.4.4. Italy market estimates and forecasts 2021 to 2033, (USD Million)
- 8.4.5. Spain
- 8.4.5.1. Key country dynamics
- 8.4.5.2. Regulatory framework/ reimbursement structure
- 8.4.5.3. Competitive scenario
- 8.4.5.4. Spain market estimates and forecasts 2021 to 2033, (USD Million)
- 8.4.6. Norway
- 8.4.6.1. Key country dynamics
- 8.4.6.2. Regulatory framework/ reimbursement structure
- 8.4.6.3. Competitive scenario
- 8.4.6.4. Norway market estimates and forecasts 2021 to 2033, (USD Million)
- 8.4.7. Sweden
- 8.4.7.1. Key country dynamics
- 8.4.7.2. Regulatory framework/ reimbursement structure
- 8.4.7.3. Competitive scenario
- 8.4.7.4. Sweden market estimates and forecasts 2021 to 2033, (USD Million)
- 8.4.8. Denmark
- 8.4.8.1. Key country dynamics
- 8.4.8.2. Regulatory framework/ reimbursement structure
- 8.4.8.3. Competitive scenario
- 8.4.8.4. Denmark market estimates and forecasts 2021 to 2033, (USD Million)
- 8.4.1. UK
- 8.5. Asia Pacific
- 8.5.1. Japan
- 8.5.1.1. Key country dynamics
- 8.5.1.2. Regulatory framework/ reimbursement structure
- 8.5.1.3. Competitive scenario
- 8.5.1.4. Japan market estimates and forecasts 2021 to 2033, (USD Million)
- 8.5.2. China
- 8.5.2.1. Key country dynamics
- 8.5.2.2. Regulatory framework/ reimbursement structure
- 8.5.2.3. Competitive scenario
- 8.5.2.4. China market estimates and forecasts 2021 to 2033, (USD Million)
- 8.5.3. India
- 8.5.3.1. Key country dynamics
- 8.5.3.2. Regulatory framework/ reimbursement structure
- 8.5.3.3. Competitive scenario
- 8.5.3.4. India market estimates and forecasts 2021 to 2033, (USD Million)
- 8.5.4. Australia
- 8.5.4.1. Key country dynamics
- 8.5.4.2. Regulatory framework/ reimbursement structure
- 8.5.4.3. Competitive scenario
- 8.5.4.4. Australia market estimates and forecasts 2021 to 2033, (USD Million)
- 8.5.5. South Korea
- 8.5.5.1. Key country dynamics
- 8.5.5.2. Regulatory framework/ reimbursement structure
- 8.5.5.3. Competitive scenario
- 8.5.5.4. South Korea market estimates and forecasts 2021 to 2033, (USD Million)
- 8.5.6. Thailand
- 8.5.6.1. Key country dynamics
- 8.5.6.2. Regulatory framework/ reimbursement structure
- 8.5.6.3. Competitive scenario
- 8.5.6.4. Thailand market estimates and forecasts 2021 to 2033, (USD Million)
- 8.5.1. Japan
- 8.6. Latin America
- 8.6.1. Brazil
- 8.6.1.1. Key country dynamics
- 8.6.1.2. Regulatory framework/ reimbursement structure
- 8.6.1.3. Competitive scenario
- 8.6.1.4. Brazil market estimates and forecasts 2021 to 2033, (USD Million)
- 8.6.2. Argentina
- 8.6.2.1. Key country dynamics
- 8.6.2.2. Regulatory framework/ reimbursement structure
- 8.6.2.3. Competitive scenario
- 8.6.2.4. Argentina market estimates and forecasts 2021 to 2033, (USD Million)
- 8.6.1. Brazil
- 8.7. MEA
- 8.7.1. South Africa
- 8.7.1.1. Key country dynamics
- 8.7.1.2. Regulatory framework/ reimbursement structure
- 8.7.1.3. Competitive scenario
- 8.7.1.4. South Africa market estimates and forecasts 2021 to 2033, (USD Million)
- 8.7.2. Saudi Arabia
- 8.7.2.1. Key country dynamics
- 8.7.2.2. Regulatory framework/ reimbursement structure
- 8.7.2.3. Competitive scenario
- 8.7.2.4. Saudi Arabia market estimates and forecasts 2021 to 2033, (USD Million)
- 8.7.3. UAE
- 8.7.3.1. Key country dynamics
- 8.7.3.2. Regulatory framework/ reimbursement structure
- 8.7.3.3. Competitive scenario
- 8.7.3.4. UAE market estimates and forecasts 2021 to 2033, (USD Million)
- 8.7.4. Kuwait
- 8.7.4.1. Key country dynamics
- 8.7.4.2. Regulatory framework/ reimbursement structure
- 8.7.4.3. Competitive scenario
- 8.7.4.4. Kuwait market estimates and forecasts 2021 to 2033, (USD Million)
- 8.7.1. South Africa
Chapter 9. Competitive Landscape
- 9.1. Recent Developments & Impact Analysis, By Key Market Participants
- 9.2. Company/Competition Categorization
- 9.3. Innovators
- 9.4. Vendor Landscape
- 9.5. List of key distributors and channel partners
- 9.6. Key customers
- 9.7. Global Key company market share analysis, 2024
- 9.7.1. Medtronic
- 9.7.1.1. Company overview
- 9.7.1.2. Financial performance
- 9.7.1.3. Product benchmarking
- 9.7.1.4. Strategic initiatives
- 9.7.2. Stryker
- 9.7.2.1. Company overview
- 9.7.2.2. Financial performance
- 9.7.2.3. Product benchmarking
- 9.7.2.4. Strategic initiatives
- 9.7.3. Terumo Corporation
- 9.7.3.1. Company overview
- 9.7.3.2. Financial performance
- 9.7.3.3. Product benchmarking
- 9.7.3.4. Strategic initiatives
- 9.7.4. Penumbra, Inc.
- 9.7.4.1. Company overview
- 9.7.4.2. Financial performance
- 9.7.4.3. Product benchmarking
- 9.7.4.4. Strategic initiatives
- 9.7.5. Johnson & Johnson and its affiliates
- 9.7.5.1. Company overview
- 9.7.5.2. Financial performance
- 9.7.5.3. Product benchmarking
- 9.7.5.4. Strategic initiatives
- 9.7.6. MicroPort Scientific Corporation
- 9.7.6.1. Company overview
- 9.7.6.2. Financial performance
- 9.7.6.3. Product benchmarking
- 9.7.6.4. Strategic initiatives
- 9.7.7. Acandis GmbH
- 9.7.7.1. Company overview
- 9.7.7.2. Financial performance
- 9.7.7.3. Product benchmarking
- 9.7.7.4. Strategic initiatives
- 9.7.8. ZYLOX-TONBRIDGE MEDICAL TECHNOLOGY CO., LTD.
- 9.7.8.1. Company overview
- 9.7.8.2. Financial performance
- 9.7.8.3. Product benchmarking
- 9.7.8.4. Strategic initiatives
- 9.7.9. NeuroSafe Medical Co., Ltd.
- 9.7.9.1. Company overview
- 9.7.9.2. Financial performance
- 9.7.9.3. Product benchmarking
- 9.7.9.4. Strategic initiatives
- 9.7.10. Rapid Medical
- 9.7.10.1. Company overview
- 9.7.10.2. Financial performance
- 9.7.10.3. Product benchmarking
- 9.7.10.4. Strategic initiatives
- 9.7.11. Evasc Neurovascular Enterprises
- 9.7.11.1. Company overview
- 9.7.11.2. Financial performance
- 9.7.11.3. Product benchmarking
- 9.7.11.4. Strategic initiatives
- 9.7.12. Lepu Medical Technology(Beijing)Co., Ltd.
- 9.7.12.1. Company overview
- 9.7.12.2. Financial performance
- 9.7.12.3. Product benchmarking
- 9.7.12.4. Strategic initiatives
- 9.7.13. phenox GmbH
- 9.7.13.1. Company overview
- 9.7.13.2. Financial performance
- 9.7.13.3. Product benchmarking
- 9.7.13.4. Strategic initiatives
- 9.7.1. Medtronic
- 9.8. Heat Map Analysis/ Company Market Position Analysis
- 9.9. Estimated Company Market Share Analysis, 2024
- 9.10. List of Other Key Market Players

