|
|
市場調査レポート
商品コード
1575216
合金鉄の市場規模、シェア、動向分析レポート:製品別、用途別、地域別、セグメント予測、2024年~2030年Ferroalloys Market Size, Share & Trends Analysis Report By Product (Ferrochrome, Ferromanganese), By Application (Carbon & Low Alloy Steel, Stainless Steel), By Region, And Segment Forecasts, 2024 - 2030 |
||||||

|
|||||||
カスタマイズ可能
|
|||||||


| 合金鉄の市場規模、シェア、動向分析レポート:製品別、用途別、地域別、セグメント予測、2024年~2030年 |
|
出版日: 2024年09月05日
発行: Grand View Research
ページ情報: 英文 120 Pages
納期: 2~10営業日
|

全表示
- 概要
- 図表
- 目次
合金鉄市場の成長と動向:
Grand View Research, Inc.の最新レポートによると、世界の合金鉄の市場規模は、2024年から2030年にかけてCAGR8.4%で成長し、2030年までには867億2,000万米ドルに達すると予測されています。
主要産業における鉄鋼消費の増加は、合金鉄の安定した需要につながっています。さらに、大衆に手頃な価格の住宅を提供するための政府の取り組み、世界のメガシティの数の増加、および進行中の工業化活動は、鉄鋼の世界の需要に貢献すると予想されています。このことは、今後数年間、合金鉄市場の成長を促進すると予想されます。
電気自動車(EV)と航空宇宙産業におけるフェロシリコマンガンの使用の増加は、予測期間にわたって合金鉄の世界需要を維持すると予想されます。クリーン・エネルギーへの産業の移行が進行し、グリーン・スチールへの関心が高まっているため、カーボンフットプリントの低い新しい鋼種を生産するための研究開発活動が行われています。さらに、鋳鉄の世界需要は予測期間中も高水準を維持し、今後数年間は合金鉄市場の収益を維持すると予想されます。従来の内燃機関(ICE)での広範な使用以外に、鋳鉄は、現代の伝統的な調理器具に代わる低コストで健康的な鋳鉄製調理器具にも使用されています。
世界各国の政府による取り組みが、世界の鉄鋼消費を押し上げると予想されます。例えば、米国の超党派インフラ法・インフレ削減法、インドの国家投資・インフラ基金、G7に基づく世界インフラ・投資パートナーシップは、鉄鋼消費を促進し、予測期間中に合金鉄市場に弾みをつけると予想されます。
合金鉄市場のレポートハイライト
- 製品別では、フェロシリコマンガンセグメントが2023年に市場の45.0%超の最大収益シェアを占めました。フェロシリコマンガンは、鉄鋼、ステンレス鋼、マンガンリッチ鋼の製造時に合金化剤および脱酸剤として使用されます。EVや航空宇宙産業で広く使用されています。
- 用途別では、鋳鉄分野が予測期間中最も高い収益CAGR7.0%で成長すると予測されています。このセグメントの成長は、調理器具の製造に鋳鉄が使用されていることに起因しています。
- 地域別では、アジア太平洋地域は粗鋼生産量が多いため、2023年の合金鉄需要が最も高いです。
- 2023年5月、Indian Metals and Ferro Alloys Limited(IMFA)は、インド・オディシャ州Kalinganagarに6,520万米ドル(54億7,000万インドルピー)のフェロクロム拡張プロジェクトを発表しました。
目次
第1章 調査手法と範囲
第2章 エグゼクティブサマリー
第3章 市場の変数、動向、範囲
- 世界の合金鉄市場の見通し
- バリューチェーン分析
- 原材料の動向
- 製造と技術の概要
- 規制の枠組み
- 市場力学
- 市場 促進要因分析
- 市場抑制要因分析
- 市場機会
- 業界動向
- ポーターのファイブフォース分析
- 供給企業の交渉力
- 買い手の交渉力
- 代替の脅威
- 新規参入業者の脅威
- 競争企業間の敵対関係
- PESTLE分析
- 政治
- 経済
- 社会情勢
- 技術
- 環境
- 法律
第4章 合金鉄市場:製品の推定・動向分析
- 合金鉄市場:製品変動分析、2023年・2030年
- フェロクロム
- フェロマンガン
- フェロシリコマンガン
- フェロシリコン
第5章 合金鉄市場:用途の推定・動向分析
- 合金鉄市場:用途変動分析、2023年・2030年
- 炭素鋼・低合金鋼
- ステンレス鋼
- 合金鋼
- 鋳鉄
- その他
第6章 合金鉄市場:地域の推定・動向分析
- 地域分析、2023年・2030年
- 北米
- 製品別、2018年~2030年
- 用途別、2018年~2030年
- 米国
- カナダ
- メキシコ
- 欧州
- 製品別、2018年~2030年
- 用途別、2018年~2030年
- ドイツ
- 英国
- フランス
- イタリア
- トルコ
- ロシア
- アジア太平洋
- 製品別、2018年~2030年
- 用途別、2018年~2030年
- 中国
- インド
- 日本
- 中南米
- 製品別、2018年~2030年
- 用途別、2018年~2030年
- ブラジル
- 中東・アフリカ
- 製品別、2018年~2030年
- 用途別、2018年~2030年
第7章 競合情勢
- 最近の動向と影響分析:主要市場参入企業別
- Kraljic Matrix
- 企業分類
- ヒートマップ分析
- ベンダー情勢
- 原材料サプライヤー一覧
- 販売代理店一覧
- その他の主要メーカー一覧
- 潜在的エンドユーザー一覧
- 戦略マッピング
- 企業プロファイル / 上場企業
- Gulf Ferro Alloys Company(Sabayek)
- Glencore
- Jindal Group
- S.C. Feral S.R.L
- SAIL
- Samancore Chrome
- Shanghai Shenjia Ferroalloys Co. Ltd
- Tata Steel Limited
List of Tables
- Table 1 Ferroalloys market estimates & forecasts, 2018 - 2030 (USD Million) (Kilo Tons)
- Table 2 Ferroalloys market estimates and forecasts, by ferrochrome, 2018 - 2030 (USD Million) (Kilo Tons)
- Table 3 Ferroalloys market estimates and forecasts, by ferromanganese, 2018 - 2030 (USD Million) (Kilo Tons)
- Table 4 Ferroalloys market estimates and forecasts, by ferro silico manganese, 2018 - 2030 (USD Million) (Kilo Tons)
- Table 5 Ferroalloys market estimates and forecasts, by ferro silicon, 2018 - 2030 (USD Million) (Kilo Tons)
- Table 6 Ferroalloys market estimates and forecasts, by carbon & low alloy steel, 2018 - 2030 (USD Million) (Kilo Tons)
- Table 7 Ferroalloys market estimates and forecasts, by stainless steel, 2018 - 2030 (USD Million) (Kilo Tons)
- Table 8 Ferroalloys market estimates and forecasts, by alloy steel, 2018 - 2030 (USD Million) (Kilo Tons)
- Table 9 Ferroalloys market estimates and forecasts, by cast iron, 2018 - 2030 (USD Million) (Kilo Tons)
- Table 10 Ferroalloys market estimates and forecasts, by others, 2018 - 2030 (USD Million) (Kilo Tons)
- Table 11 North America Ferroalloys market estimates & forecasts, 2018 - 2030 (USD Million) (Kilo Tons)
- Table 12 North America Ferroalloys market estimates & forecasts, by product, 2018 - 2030 (USD Million)
- Table 13 North America Ferroalloys market estimates & forecasts, by product, 2018 - 2030 (Kilo Tons)
- Table 14 North America Ferroalloys market estimates & forecasts, by application, 2018 - 2030 (USD Million)
- Table 15 North America Ferroalloys market estimates & forecasts, by application, 2018 - 2030 (Kilo Tons)
- Table 16 U.S. Ferroalloys market estimates & forecasts, 2018 - 2030 (USD Million) (Kilo Tons)
- Table 17 U.S. Ferroalloys market estimates & forecasts, by product, 2018 - 2030 (USD Million)
- Table 18 U.S. Ferroalloys market estimates & forecasts, by product, 2018 - 2030 (Kilo Tons)
- Table 19 U.S. Ferroalloys market estimates & forecasts, by application, 2018 - 2030 (USD Million)
- Table 20 U.S. Ferroalloys market estimates & forecasts, by application, 2018 - 2030 (Kilo Tons)
- Table 21 Canada Ferroalloys market estimates & forecasts, 2018 - 2030 (USD Million) (Kilo Tons)
- Table 22 Canada Ferroalloys market estimates & forecasts, by product, 2018 - 2030 (USD Million)
- Table 23 Canada Ferroalloys market estimates & forecasts, by product, 2018 - 2030 (Kilo Tons)
- Table 24 Canada Ferroalloys market estimates & forecasts, by application, 2018 - 2030 (USD Million)
- Table 25 Canada Ferroalloys market estimates & forecasts, by application, 2018 - 2030 (Kilo Tons)
- Table 26 Mexico Ferroalloys market estimates & forecasts, 2018 - 2030 (USD Million) (Kilo Tons)
- Table 27 Mexico Ferroalloys market estimates & forecasts, by product, 2018 - 2030 (USD Million)
- Table 28 Mexico Ferroalloys market estimates & forecasts, by product, 2018 - 2030 (Kilo Tons)
- Table 29 Mexico Ferroalloys market estimates & forecasts, by application, 2018 - 2030 (USD Million)
- Table 30 Mexico Ferroalloys market estimates & forecasts, by application, 2018 - 2030 (Kilo Tons)
- Table 31 Europe Ferroalloys market estimates & forecasts, 2018 - 2030 (USD Million) (Kilo Tons)
- Table 32 Europe Ferroalloys market estimates & forecasts, by product, 2018 - 2030 (USD Million)
- Table 33 Europe Ferroalloys market estimates & forecasts, by product, 2018 - 2030 (Kilo Tons)
- Table 34 Europe Ferroalloys market estimates & forecasts, by application, 2018 - 2030 (USD Million)
- Table 35 Europe Ferroalloys market estimates & forecasts, by application, 2018 - 2030 (Kilo Tons)
- Table 36 Germany Ferroalloys market estimates & forecasts, 2018 - 2030 (USD Million) (Kilo Tons)
- Table 37 Germany Ferroalloys market estimates & forecasts, by product, 2018 - 2030 (USD Million)
- Table 38 Germany Ferroalloys market estimates & forecasts, by product, 2018 - 2030 (Kilo Tons)
- Table 39 Germany Ferroalloys market estimates & forecasts, by application, 2018 - 2030 (USD Million)
- Table 40 Germany Ferroalloys market estimates & forecasts, by application, 2018 - 2030 (Kilo Tons)
- Table 41 UK Ferroalloys market estimates & forecasts, by product, 2018 - 2030 (USD Million)
- Table 42 UK Ferroalloys market estimates & forecasts, by product, 2018 - 2030 (Kilo Tons)
- Table 43 UK Ferroalloys market estimates & forecasts, by application, 2018 - 2030 (USD Million)
- Table 44 UK Ferroalloys market estimates & forecasts, by application, 2018 - 2030 (Kilo Tons)
- Table 45 France Ferroalloys market estimates & forecasts, 2018 - 2030 (USD Million) (Kilo Tons)
- Table 46 France Ferroalloys market estimates & forecasts, by product, 2018 - 2030 (USD Million)
- Table 47 France Ferroalloys market estimates & forecasts, by product, 2018 - 2030 (Kilo Tons)
- Table 48 France Ferroalloys market estimates & forecasts, by application, 2018 - 2030 (USD Million)
- Table 49 Italy Ferroalloys market estimates & forecasts, by application, 2018 - 2030 (Kilo Tons)
- Table 50 Italy Ferroalloys market estimates & forecasts, 2018 - 2030 (USD Million) (Kilo Tons)
- Table 51 Italy Ferroalloys market estimates & forecasts, by product, 2018 - 2030 (USD Million)
- Table 52 Italy Ferroalloys market estimates & forecasts, by product, 2018 - 2030 (Kilo Tons)
- Table 53 Italy Ferroalloys market estimates & forecasts, by application, 2018 - 2030 (USD Million)
- Table 54 Italy Ferroalloys market estimates & forecasts, by application, 2018 - 2030 (Kilo Tons)
- Table 55 Turkey Ferroalloys market estimates & forecasts, 2018 - 2030 (USD Million) (Kilo Tons)
- Table 56 Turkey Ferroalloys market estimates & forecasts, by product, 2018 - 2030 (USD Million)
- Table 57 Turkey Ferroalloys market estimates & forecasts, by product, 2018 - 2030 (Kilo Tons)
- Table 58 Turkey Ferroalloys market estimates & forecasts, by application, 2018 - 2030 (USD Million)
- Table 59 Turkey Ferroalloys market estimates & forecasts, by application, 2018 - 2030 (Kilo Tons)
- Table 60 Russia Ferroalloys market estimates & forecasts, 2018 - 2030 (USD Million) (Kilo Tons)
- Table 61 Russia Ferroalloys market estimates & forecasts, by product, 2018 - 2030 (USD Million)
- Table 62 Russia Ferroalloys market estimates & forecasts, by product, 2018 - 2030 (Kilo Tons)
- Table 63 Russia Ferroalloys market estimates & forecasts, by application, 2018 - 2030 (USD Million)
- Table 64 Russia Ferroalloys market estimates & forecasts, by application, 2018 - 2030 (Kilo Tons)
- Table 65 Asia Pacific Ferroalloys market estimates & forecasts, 2018 - 2030 (USD Million) (Kilo Tons)
- Table 66 Asia Pacific Ferroalloys market estimates & forecasts, by product, 2018 - 2030 (USD Million)
- Table 67 Asia Pacific Ferroalloys market estimates & forecasts, by product, 2018 - 2030 (Kilo Tons)
- Table 68 Asia Pacific Ferroalloys market estimates & forecasts, by application, 2018 - 2030 (USD Million)
- Table 69 Asia Pacific Ferroalloys market estimates & forecasts, by application, 2018 - 2030 (Kilo Tons)
- Table 70 China Ferroalloys market estimates & forecasts, 2018 - 2030 (USD Million) (Kilo Tons)
- Table 71 China Ferroalloys market estimates & forecasts, by product, 2018 - 2030 (USD Million)
- Table 72 China Ferroalloys market estimates & forecasts, by product, 2018 - 2030 (Kilo Tons)
- Table 73 China Ferroalloys market estimates & forecasts, by application, 2018 - 2030 (USD Million)
- Table 74 China Ferroalloys market estimates & forecasts, by application, 2018 - 2030 (Kilo Tons)
- Table 75 India Ferroalloys market estimates & forecasts, 2018 - 2030 (USD Million) (Kilo Tons)
- Table 76 India Ferroalloys market estimates & forecasts, by product, 2018 - 2030 (USD Million)
- Table 77 India Ferroalloys market estimates & forecasts, by product, 2018 - 2030 (Kilo Tons)
- Table 78 India Ferroalloys market estimates & forecasts, by application, 2018 - 2030 (USD Million)
- Table 79 India Ferroalloys market estimates & forecasts, by application, 2018 - 2030 (Kilo Tons)
- Table 80 Japan Ferroalloys market estimates & forecasts, 2018 - 2030 (USD Million) (Kilo Tons)
- Table 81 Japan Ferroalloys market estimates & forecasts, by product, 2018 - 2030 (USD Million)
- Table 82 Japan Ferroalloys market estimates & forecasts, by product, 2018 - 2030 (Kilo Tons)
- Table 83 Japan Ferroalloys market estimates & forecasts, by application, 2018 - 2030 (USD Million)
- Table 84 Japan Ferroalloys market estimates & forecasts, by application, 2018 - 2030 (Kilo Tons)
- Table 85 Central & South America Ferroalloys market estimates & forecasts, 2018 - 2030 (USD Million) (Kilo Tons)
- Table 86 Central & South America Ferroalloys market estimates & forecasts, by product, 2018 - 2030 (USD Million)
- Table 87 Central & South America Ferroalloys market estimates & forecasts, by product, 2018 - 2030 (Kilo Tons)
- Table 88 Central & South America Ferroalloys market estimates & forecasts, by application, 2018 - 2030 (USD Million)
- Table 89 Central & South America Ferroalloys market estimates & forecasts, by application, 2018 - 2030 (Kilo Tons)
- Table 90 Brazil Ferroalloys market estimates & forecasts, 2018 - 2030 (USD Million) (Kilo Tons)
- Table 91 Brazil Ferroalloys market estimates & forecasts, by product, 2018 - 2030 (USD Million)
- Table 92 Brazil Ferroalloys market estimates & forecasts, by product, 2018 - 2030 (Kilo Tons)
- Table 93 Brazil Ferroalloys market estimates & forecasts, by application, 2018 - 2030 (USD Million)
- Table 94 Brazil Ferroalloys market estimates & forecasts, by application, 2018 - 2030 (Kilo Tons)
- Table 95 Middle East & Africa Ferroalloys market estimates & forecasts, 2018 - 2030 (USD Million) (Kilo Tons)
- Table 96 Middle East & Africa Ferroalloys market estimates & forecasts, by product, 2018 - 2030 (USD Million)
- Table 97 Middle East & Africa Ferroalloys market estimates & forecasts, by product, 2018 - 2030 (Kilo Tons)
- Table 98 Middle East & Africa Ferroalloys market estimates & forecasts, by application, 2018 - 2030 (USD Million)
- Table 99 Middle East & Africa Ferroalloys market estimates & forecasts, by application, 2018 - 2030 (Kilo Tons)
List of Figures
- Fig. 1 Market segmentation
- Fig. 2 Information procurement
- Fig. 3 Data analysis models
- Fig. 4 Market formulation and validation
- Fig. 5 Data validating & publishing
- Fig. 6 Market snapshot
- Fig. 7 Segmental outlook - Product and Application
- Fig. 8 Competitive Outlook
- Fig. 9 Ferroalloys market outlook, 2018 - 2030 (USD Million) (Kilo Tons)
- Fig. 10 Value chain analysis
- Fig. 11 Market dynamics
- Fig. 12 Porter's Analysis
- Fig. 13 PESTEL Analysis
- Fig. 14 Ferroalloys market, by product: Key takeaways
- Fig. 15 Ferroalloys market, by product: Market share, 2023 & 2030
- Fig. 16 Ferroalloys market, by application: Key takeaways
- Fig. 17 Ferroalloys market, by application: Market share, 2023 & 2030
- Fig. 18 Ferroalloys market: Regional analysis, 2023
- Fig. 19 Ferroalloys market, by region: Key takeaways
Ferroalloys Market Growth & Trends:
The global ferroalloys market size is anticipated to reach USD 86.72 billion by 2030, growing at a CAGR of 8.4% from 2024 to 2030, according to a new report by Grand View Research, Inc. The growing consumption of steel across key industries has led to steady ferroalloy requirements. Moreover, the government initiatives to provide affordable housing to the masses, the rising number of megacities worldwide, and ongoing industrialization activities are anticipated to contribute to the global demand for steel. This is expected to subsequently drive the growth of the ferroalloys market in the coming years.
Increasing use of ferro silico manganese in the electric vehicle (EV) and aerospace industries is anticipated to sustain the global demand for ferroalloys over the forecast period. The ongoing transition of industries to clean energy and the growing interest in green steel have led to research and development activities to produce new grades of steel that have a low carbon footprint. Moreover, the global demand for cast iron is anticipated to remain high during the forecast period and sustain revenues for the ferroalloys market in the coming years. Apart from its extensive usage in conventional internal combustion engines (ICEs), it is also used in cast iron cookware, a low-cost and healthy alternative to modern traditional cookware.
Initiatives by governments of different countries across the world are anticipated to boost global steel consumption. For instance, the Bipartisan Infrastructure Law and Inflation Reduction Act in the U.S., the National Investment and Infrastructure Fund in India, and the G7-based Partnership for Global Infrastructure and Investment are expected to drive the steel consumption and provide impetus to the ferroalloy market over the forecast period.
Ferroalloys Market Report Highlights:
- Based on product, the ferro silico manganese segment accounted for the largest revenue share of over 45.0% of the market in 2023. Ferro silico manganese is used as an alloying and deoxidizing agent during the production of steel, stainless steel, and manganese-rich steel. It is extensively used in the EV and aerospace industries.
- Based on application, the cast iron segment of the market is projected to grow at the highest revenue CAGR of 7.0% over the forecast period. The segment's growth can be attributed to the use of cast iron for producing cookware.
- Based on region, the Asia Pacific region witnessed the highest demand for ferroalloys in 2023 owing to the large production volume of crude steel in the region.
- In May 2023, Indian Metals and Ferro Alloys Limited (IMFA) announced its USD 65.2 million (INR 547 crore) ferrochrome expansion project in Kalinganagar, Odisha, India with 100,000 MTPA installed capacity is expected to be commissioned in mid-2026.
Table of Contents
Chapter 1. Methodology and Scope
- 1.1. Market Segmentation & Scope
- 1.2. Market Definition
- 1.3. Information Procurement
- 1.3.1. Information Analysis
- 1.3.2. Market Formulation & Data Visualization
- 1.3.3. Data Validation & Publishing
- 1.4. Research Scope and Assumptions
- 1.4.1. List of Data Sources
Chapter 2. Executive Summary
- 2.1. Market Snapshot
- 2.2. Segmental Outlook
- 2.3. Competitive Outlook
Chapter 3. Market Variables, Trends, and Scope
- 3.1. Global Ferroalloys Market Outlook
- 3.2. Value Chain Analysis
- 3.2.1. Raw Material Trends
- 3.3. Manufacturing & Technology Overview
- 3.4. Regulatory Framework
- 3.5. Market Dynamics
- 3.5.1. Market Driver Analysis
- 3.5.2. Market Restraint Analysis
- 3.5.3. Market Opportunities
- 3.5.4. Industry Trends
- 3.5.4.1. ESG Analysis
- 3.5.4.2. Trade Trends
- 3.6. Porter's Five Forces Analysis
- 3.6.1. Bargaining Power of Suppliers
- 3.6.2. Bargaining Power of Buyers
- 3.6.3. Threat of Substitution
- 3.6.4. Threat of New Entrants
- 3.6.5. Competitive Rivalry
- 3.7. PESTLE Analysis
- 3.7.1. Political
- 3.7.2. Economic
- 3.7.3. Social Landscape
- 3.7.4. Technology
- 3.7.5. Environmental
- 3.7.6. Legal
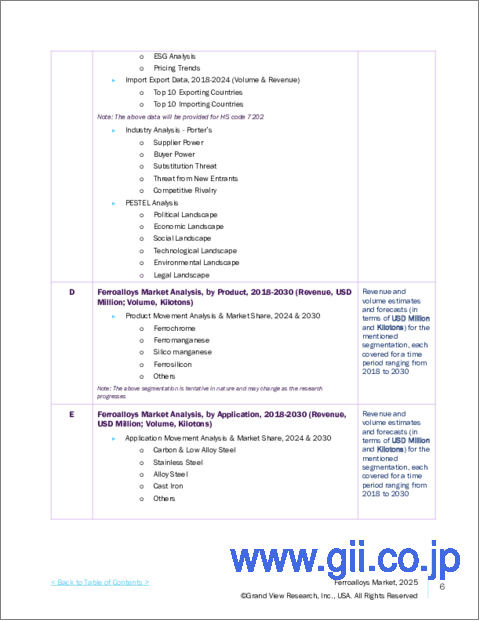
Chapter 4. Ferroalloys Market: Product Estimates & Trend Analysis
- 4.1. Ferroalloys Market: Product Movement Analysis, 2023 & 2030
- 4.2. Ferrochrome
- 4.2.1. Market estimates and forecasts, 2018 - 2030 (Kilo Tons) (USD Million)
- 4.3. Ferromanganese
- 4.3.1. Market estimates and forecasts, 2018 - 2030 (Kilo Tons) (USD Million)
- 4.4. Ferro silico manganese
- 4.4.1. Market estimates and forecasts, 2018 - 2030 (Kilo Tons) (USD Million)
- 4.5. Ferrosilicon
- 4.5.1. Market estimates and forecasts, 2018 - 2030 (Kilo Tons) (USD Million)
Chapter 5. Ferroalloys Market: Application Estimates & Trend Analysis
- 5.1. Ferroalloys Market: Application Movement Analysis, 2023 & 2030
- 5.2. Carbon & Low Alloy Steel
- 5.2.1. Market estimates and forecasts, 2018 - 2030 (Kilo Tons) (USD Million)
- 5.3. Stainless Steel
- 5.3.1. Market estimates and forecasts, 2018 - 2030 (Kilo Tons) (USD Million)
- 5.4. Alloy Steel
- 5.4.1. Market estimates and forecasts, 2018 - 2030 (Kilo Tons) (USD Million)
- 5.5. Cast Iron
- 5.5.1. Market estimates and forecasts, 2018 - 2030 (Kilo Tons) (USD Million)
- 5.6. Others
- 5.6.1. Market estimates and forecasts, 2018 - 2030 (Kilo Tons) (USD Million)
Chapter 6. Ferroalloys Market: Regional Estimates & Trend Analysis
- 6.1. Regional Analysis, 2023 & 2030
- 6.2. North America
- 6.2.1. Market estimates and forecasts, 2018 - 2030 (Kilo Tons) (USD Million)
- 6.2.2. Market estimates and forecasts, by product, 2018 - 2030 (Kilo Tons) (USD Million)
- 6.2.3. Market estimates and forecasts, by application, 2018 - 2030 (Kilo Tons) (USD Million)
- 6.2.4. U.S.
- 6.2.4.1. Market estimates and forecasts, 2018 - 2030 (Kilo Tons) (USD Million)
- 6.2.4.2. Market estimates and forecasts, by product, 2018 - 2030 (Kilo Tons) (USD Million)
- 6.2.4.3. Market estimates and forecasts, by application, 2018 - 2030 (Kilo Tons) (USD Million)
- 6.2.5. Canada
- 6.2.5.1. Market estimates and forecasts, 2018 - 2030 (Kilo Tons) (USD Million)
- 6.2.5.2. Market estimates and forecasts, by product, 2018 - 2030 (Kilo Tons) (USD Million)
- 6.2.5.3. Market estimates and forecasts, by application, 2018 - 2030 (Kilo Tons) (USD Million)
- 6.2.6. Mexico
- 6.2.6.1. Market estimates and forecasts, 2018 - 2030 (Kilo Tons) (USD Million)
- 6.2.6.2. Market estimates and forecasts, by product, 2018 - 2030 (Kilo Tons) (USD Million)
- 6.2.6.3. Market estimates and forecasts, by application, 2018 - 2030 (Kilo Tons) (USD Million)
- 6.3. Europe
- 6.3.1. Market estimates and forecasts, 2018 - 2030 (Kilo Tons) (USD Million)
- 6.3.2. Market estimates and forecasts, by product, 2018 - 2030 (Kilo Tons) (USD Million)
- 6.3.3. Market estimates and forecasts, by application, 2018 - 2030 (Kilo Tons) (USD Million)
- 6.3.4. Germany
- 6.3.4.1. Market estimates and forecasts, 2018 - 2030 (Kilo Tons) (USD Million)
- 6.3.4.2. Market estimates and forecasts, by product, 2018 - 2030 (Kilo Tons) (USD Million)
- 6.3.4.3. Market estimates and forecasts, by application, 2018 - 2030 (Kilo Tons) (USD Million)
- 6.3.5. UK
- 6.3.5.1. Market estimates and forecasts, 2018 - 2030 (Kilo Tons) (USD Million)
- 6.3.5.2. Market estimates and forecasts, by product, 2018 - 2030 (Kilo Tons) (USD Million)
- 6.3.5.3. Market estimates and forecasts, by application, 2018 - 2030 (Kilo Tons) (USD Million)
- 6.3.6. France
- 6.3.6.1. Market estimates and forecasts, 2018 - 2030 (Kilo Tons) (USD Million)
- 6.3.6.2. Market estimates and forecasts, by product, 2018 - 2030 (Kilo Tons) (USD Million)
- 6.3.6.3. Market estimates and forecasts, by application, 2018 - 2030 (Kilo Tons) (USD Million)
- 6.3.7. Italy
- 6.3.7.1. Market estimates and forecasts, 2018 - 2030 (Kilo Tons) (USD Million)
- 6.3.7.2. Market estimates and forecasts, by product, 2018 - 2030 (Kilo Tons) (USD Million)
- 6.3.7.3. Market estimates and forecasts, by application, 2018 - 2030 (Kilo Tons) (USD Million)
- 6.3.8. Turkey
- 6.3.8.1. Market estimates and forecasts, 2018 - 2030 (Kilo Tons) (USD Million)
- 6.3.8.2. Market estimates and forecasts, by product, 2018 - 2030 (Kilo Tons) (USD Million)
- 6.3.8.3. Market estimates and forecasts, by application, 2018 - 2030 (Kilo Tons) (USD Million)
- 6.3.9. Russia
- 6.3.9.1. Market estimates and forecasts, 2018 - 2030 (Kilo Tons) (USD Million)
- 6.3.9.2. Market estimates and forecasts, by product, 2018 - 2030 (Kilo Tons) (USD Million)
- 6.3.9.3. Market estimates and forecasts, by application, 2018 - 2030 (Kilo Tons) (USD Million)
- 6.4. Asia Pacific
- 6.4.1. Market estimates and forecasts, 2018 - 2030 (Kilo Tons) (USD Million)
- 6.4.2. Market estimates and forecasts, by product, 2018 - 2030 (Kilo Tons) (USD Million)
- 6.4.3. Market estimates and forecasts, by application, 2018 - 2030 (Kilo Tons) (USD Million)
- 6.4.4. China
- 6.4.4.1. Market estimates and forecasts, 2018 - 2030 (Kilo Tons) (USD Million)
- 6.4.4.2. Market estimates and forecasts, by product, 2018 - 2030 (Kilo Tons) (USD Million)
- 6.4.4.3. Market estimates and forecasts, by application, 2018 - 2030 (Kilo Tons) (USD Million)
- 6.4.5. India
- 6.4.5.1. Market estimates and forecasts, 2018 - 2030 (Kilo Tons) (USD Million)
- 6.4.5.2. Market estimates and forecasts, by product, 2018 - 2030 (Kilo Tons) (USD Million)
- 6.4.5.3. Market estimates and forecasts, by application, 2018 - 2030 (Kilo Tons) (USD Million)
- 6.4.6. Japan
- 6.4.6.1. Market estimates and forecasts, 2018 - 2030 (Kilo Tons) (USD Million)
- 6.4.6.2. Market estimates and forecasts, by product, 2018 - 2030 (Kilo Tons) (USD Million)
- 6.4.6.3. Market estimates and forecasts, by application, 2018 - 2030 (Kilo Tons) (USD Million)
- 6.5. Central & South America
- 6.5.1. Market estimates and forecasts, 2018 - 2030 (Kilo Tons) (USD Million)
- 6.5.2. Market estimates and forecasts, by product, 2018 - 2030 (Kilo Tons) (USD Million)
- 6.5.3. Market estimates and forecasts, by application, 2018 - 2030 (Kilo Tons) (USD Million)
- 6.5.4. Brazil
- 6.5.4.1. Market estimates and forecasts, 2018 - 2030 (Kilo Tons) (USD Million)
- 6.5.4.2. Market estimates and forecasts, by product, 2018 - 2030 (Kilo Tons) (USD Million)
- 6.5.4.3. Market estimates and forecasts, by application, 2018 - 2030 (Kilo Tons) (USD Million)
- 6.6. Middle East & Africa
- 6.6.1. Market estimates and forecasts, 2018 - 2030 (Kilo Tons) (USD Million)
- 6.6.2. Market estimates and forecasts, by product, 2018 - 2030 (Kilo Tons) (USD Million)
- 6.6.3. Market estimates and forecasts, by application, 2018 - 2030 (Kilo Tons) (USD Million)
Chapter 7. Competitive Landscape
- 7.1. Recent Developments & Impact Analysis, by Key Market Participants
- 7.2. Kraljic Matrix
- 7.3. Company Categorization
- 7.4. Heat Map Analysis
- 7.5. Vendor Landscape
- 7.5.1. List of Raw Material Suppliers
- 7.5.2. List of Distributors
- 7.5.3. List of Other Prominent Manufacturers
- 7.5.4. List of Prospective End-Users
- 7.6. Strategy Mapping
- 7.7. Company Profiles/Listing
- 7.7.1. Gulf Ferro Alloys Company (Sabayek)
- 7.7.1.1. Company Overview
- 7.7.1.2. Financial Performance
- 7.7.1.3. Product Benchmarking
- 7.7.2. Glencore
- 7.7.2.1. Company Overview
- 7.7.2.2. Financial Performance
- 7.7.2.3. Product Benchmarking
- 7.7.3. Jindal Group
- 7.7.3.1. Company Overview
- 7.7.3.2. Product Benchmarking
- 7.7.4. S.C. Feral S.R.L
- 7.7.4.1. Company Overview
- 7.7.4.2. Product Benchmarking
- 7.7.5. SAIL
- 7.7.5.1. Company Overview
- 7.7.5.2. Financial Performance
- 7.7.5.3. Product Benchmarking
- 7.7.6. Samancore Chrome
- 7.7.6.1. Company Overview
- 7.7.6.2. Product Benchmarking
- 7.7.7. Shanghai Shenjia Ferroalloys Co. Ltd
- 7.7.7.1. Company Overview
- 7.7.7.2. Financial Performance
- 7.7.7.3. Product Benchmarking
- 7.7.8. Tata Steel Limited
- 7.7.8.1. Company Overview
- 7.7.8.2. Financial Performance
- 7.7.8.3. Product Benchmarking
- 7.7.1. Gulf Ferro Alloys Company (Sabayek)
