|
|
市場調査レポート
商品コード
1575167
スマートシェルフの市場規模、シェア、動向分析レポート:コンポーネント別、用途別、最終用途別、地域別、セグメント予測、2024年~2030年Smart Shelves Market Size, Share & Trends Analysis Report By Component (Hardware, Software), By Application (Planogram Management, Inventory Management), By End-use, By Region, And Segment Forecasts, 2024 - 2030 |
||||||

|
|||||||
カスタマイズ可能
|
|||||||

| スマートシェルフの市場規模、シェア、動向分析レポート:コンポーネント別、用途別、最終用途別、地域別、セグメント予測、2024年~2030年 |
|
出版日: 2024年09月02日
発行: Grand View Research
ページ情報: 英文 120 Pages
納期: 2~10営業日
|

全表示
- 概要
- 図表
- 目次
スマートシェルフの市場規模と動向:
世界のスマートシェルフの市場規模は、2023年に33億1,000万米ドルとなり、2024年から2030年にかけてCAGR24.2%で成長すると予測されています。
この成長は、小売業における自動化導入の高まりと在庫管理システム強化の必要性に起因しています。市場の最も重要な動向の1つは、小売業務の急速なデジタル変革と自動化です。eコマースが従来の実店舗に課題し続ける中、小売業者は競争力を維持するためにスマートテクノロジーの採用を増やしています。
スマートシェルフは、リアルタイムの在庫データの提供、在庫切れの削減、インタラクティブなディスプレイによる顧客エンゲージメントの向上など、この変革において重要な役割を果たしています。
効率的な在庫管理は、スマートシェルフの採用を促進する重要な要因です。従来の在庫システムは手作業に頼ることが多く、エラーや非効率が発生しやすいです。スマートシェルフは在庫レベルをリアルタイムで可視化するため、小売業者は補充プロセスを自動化し、在庫切れや過剰在庫のリスクを減らすことができます。これは大幅なコスト削減と顧客満足度の向上につながります。
今日の競合環境では、優れた顧客体験を提供することが最も重要です。スマートシェルフは、パーソナライズされたプロモーション、インタラクティブなディスプレイ、リアルタイムの商品情報を提供することで、ショッピング体験を向上させます。これらの機能は顧客を惹きつけるだけでなく、店内での滞在時間を長くし、購入の可能性を高めます。小売企業は、差別化を図り、顧客ロイヤルティを高めるために、スマートシェルフを採用するケースが増えています。
IoT技術の進歩は、スマート棚業界の成長を支える大きな原動力となっています。コネクテッドデバイスの普及と、センサー、RFIDタグ、デジタルディスプレイの低価格化により、スマートシェルフはあらゆる規模の小売業者にとってより身近なものとなっています。IoT技術の統合により、小売業者は膨大な量のデータを収集・分析できるようになり、より多くの情報に基づいた意思決定と業務効率の改善につながります。さらに、AIと機械学習がスマートシェルフに統合されたことで、小売業者に新たな可能性がもたらされました。AIアルゴリズムは、スマートシェルフが収集した膨大なデータを分析してパターンや動向を特定し、小売業者がデータに基づいた意思決定を行えるようにします。
規制遵守と製品の安全性は、特に食品や医薬品などの分野において、小売業者にとって重要な関心事です。スマートシェルフは、温度や湿度などの製品状態をリアルタイムで監視することで、小売業者が規制要件を満たすのに役立ちます。これにより、製品が最適な状態で保管され、腐敗のリスクを低減し、安全基準を確実に遵守することができます。eコマースの台頭は従来の小売業に大きな影響を与え、実店舗はイノベーションを余儀なくされています。スマートシェルフはこの課題への対応策であり、実店舗がオンライン・プラットフォームと統合したシームレスなショッピング体験を提供できるようにします。
目次
第1章 調査手法と範囲
第2章 エグゼクティブサマリー
第3章 スマートシェルフ市場の変数、動向、範囲
- 市場イントロダクション / 系統展望
- 業界バリューチェーン分析
- 市場力学
- 市場促進要因分析
- 市場抑制要因分析
- 業界の機会
- 業界の課題
- スマートシェルフ市場分析ツール
- ポーターの分析
- PESTEL分析
第4章 スマートシェルフ市場:コンポーネントの推定・動向分析
- セグメントダッシュボード
- スマートシェルフ市場:コンポーネント変動分析、2023年・2030年
- ハードウェア
- ソフトウェア
- サービス
第5章 スマートシェルフ市場:用途の推定・動向分析
- セグメントダッシュボード
- スマートシェルフ市場:用途変動分析、2023年・2030年
- 棚割り
- 棚割りにおけるスマートシェルフ市場の収益推定と予測、2017年~2030年
- 在庫管理
- 在庫管理におけるスマートシェルフ市場の収益推定と予測、2017年~2030年
- 価格管理
- 価格管理におけるスマートシェルフ市場の収益推定と予測、2017年~2030年
- コンテンツ管理
- コンテンツ管理におけるスマートシェルフ市場の収益推定と予測、2017年~2030年
- その他
- その他の用途におけるスマートシェルフ市場の収益推定と予測、2017年~2030年
第6章 スマートシェルフ市場:最終用途の推定・動向分析
- セグメントダッシュボード
- スマートシェルフ市場:最終用途変動分析、2023年・2030年
- ハイパーマーケット
- スーパーマーケット
- デパート
- 倉庫
- その他
第7章 スマートシェルフ市場:地域の推定・動向分析
- スマートシェルフ市場シェア、地域別、2023年・2030年、百万米ドル
- 北米
- コンポーネント別、2017年~2030年
- 用途別、2017年~2030年
- 最終用途別、2017年~2030年
- 米国
- カナダ
- メキシコ
- 欧州
- コンポーネント別、2017年~2030年
- 用途別、2017年~2030年
- 最終用途別、2017年~2030年
- 英国
- ドイツ
- フランス
- アジア太平洋
- コンポーネント別、2017年~2030年
- 用途別、2017年~2030年
- 最終用途別、2017年~2030年
- 中国
- 日本
- インド
- 韓国
- オーストラリア
- ラテンアメリカ
- コンポーネント別、2017年~2030年
- 用途別、2017年~2030年
- 最終用途別、2017年~2030年
- ブラジル
- 中東・アフリカ
- コンポーネント別、2017年~2030年
- 用途別、2017年~2030年
- 最終用途別、2017年~2030年
- サウジアラビア王国(KSA)
- アラブ首長国連邦
- 南アフリカ
第8章 競合情勢
- 最近の動向と影響分析:主要市場参入企業別
- 企業分類
- 企業の市場ポジショニング
- 企業の市場シェア分析
- 企業ヒートマップ分析
- 戦略マッピング
- 拡大
- 合併と買収
- パートナーシップとコラボレーション
- 新製品の発売
- 研究開発
- 企業プロファイル
- Avery Dennison Corporation
- AWM Smart Shelf
- E Ink Holdings Inc
- Happiest Minds Technologies Limited
- Honeywell International Inc.
- Huawei Technologies Co. Ltd
- Intel Corporation
- Lenovo PCCW Solutions Limited
- Samsung Electronics Co. Ltd
- Trax Retail
List of Tables
- Table 1 Global Smart Shelves Market revenue estimates and forecast, by component, 2017 - 2030 (USD Million)
- Table 2 Global Smart Shelves Market revenue estimates and forecast, by application, 2017 - 2030 (USD Million)
- Table 3 Global Smart Shelves Market revenue estimates and forecast, by end use, 2017 - 2030 (USD Million)
- Table 4 Global Smart Shelves Market revenue estimates and forecast, by region, 2017 - 2030 (USD Million)
- Table 5 North America Smart Shelves Market estimates & forecasts, 2017 - 2030 (USD Million)
- Table 6 U.S. Smart Shelves Market estimates & forecasts, 2017 - 2030 (USD Million)
- Table 7 Canada Smart Shelves Market estimates & forecasts, 2017 - 2030 (USD Million)
- Table 8 Mexico Smart Shelves Market estimates & forecasts, 2017 - 2030 (USD Million)
- Table 9 Europe Smart Shelves Market estimates & forecasts, 2017 - 2030 (USD Million)
- Table 10 UK Smart Shelves Market estimates & forecasts, 2017 - 2030 (USD Million)
- Table 11 Germany Smart Shelves Market estimates & forecasts, 2017 - 2030 (USD Million)
- Table 12 France Smart Shelves Market estimates & forecasts, 2017 - 2030 (USD Million)
- Table 13 Asia Pacific Smart Shelves Market estimates & forecasts, 2017 - 2030 (USD Million)
- Table 14 China Smart Shelves Market estimates & forecasts, 2017 - 2030 (USD Million)
- Table 15 India Smart Shelves Market estimates & forecasts, 2017 - 2030 (USD Million)
- Table 16 Japan Smart Shelves Market estimates & forecasts, 2017 - 2030 (USD Million)
- Table 17 South Korea Smart Shelves Market estimates & forecasts, 2017 - 2030 (USD Million)
- Table 18 Australia Smart Shelves Market estimates & forecasts, 2017 - 2030 (USD Million)
- Table 19 Latin America Smart Shelves Market estimates & forecasts, 2017 - 2030 (USD Million)
- Table 20 Brazil Smart Shelves Market estimates & forecasts, 2017 - 2030 (USD Million)
- Table 21 Middle East & Africa Smart Shelves Market estimates & forecasts, 2017 - 2030 (USD Million)
- Table 22 Kingdom of Saudi Arabia (KSA) Smart Shelves Market estimates & forecasts, 2017 - 2030 (USD Million)
- Table 23 UAE Smart Shelves Market estimates & forecasts, 2017 - 2030 (USD Million)
- Table 24 South Africa Smart Shelves Market estimates & forecasts, 2017 - 2030 (USD Million)
- Table 25 Participant's Overview
- Table 26 Financial Performance
- Table 27 Product Benchmarking
- Table 28 Key companies undergoing expansion
- Table 29 Key companies involved in mergers & acquisitions
- Table 30 Key companies undertaking partnerships and collaboration
- Table 31 Key companies launching new product/service launches
List of Figures
- Fig. 1 Smart Shelves Market segmentation
- Fig. 2 Information procurement
- Fig. 3 Data analysis models
- Fig. 4 Market formulation and validation
- Fig. 5 Data validating & publishing
- Fig. 6 Market snapshot
- Fig. 7 Segment snapshot, by component and label
- Fig. 8 Segment snapshot
- Fig. 9 Competitive landscape snapshot
- Fig. 10 Smart Shelves Market value, 2017-2030 (USD Million)
- Fig. 11 Smart Shelves Market - Industry value chain analysis
- Fig. 12 Smart Shelves Market - Market trends
- Fig. 13 Smart Shelves Market: Porter's analysis
- Fig. 14 Smart Shelves Market: PESTEL analysis
- Fig. 15 Smart Shelves Market, by Component: Key takeaways
- Fig. 16 Smart Shelves Market, by Component: Market share, 2023 & 2030
- Fig. 17 Smart Shelves Hardware Market estimates & forecasts, 2017 - 2030 (USD Million)
- Fig. 18 Smart Shelves Software Market estimates & forecasts, 2017 - 2030 (USD Million)
- Fig. 19 Smart Shelves Service Market estimates & forecasts, 2017 - 2030 (USD Million)
- Fig. 20 Smart Shelves Market, by Application: Key takeaways
- Fig. 21 Smart Shelves Market, by Application: Market share, 2023 & 2030
- Fig. 22 Planogram Management Market estimates & forecasts, 2017 - 2030 (USD Million)
- Fig. 23 Inventory Management Market estimates & forecasts, 2017 - 2030 (USD Million)
- Fig. 24 Pricing Management Market estimates & forecasts, 2017 - 2030 (USD Million)
- Fig. 25 Content Management Market estimates & forecasts, 2017 - 2030 (USD Million)
- Fig. 26 Others Market estimates & forecasts, 2017 - 2030 (USD Million)
- Fig. 27 Smart Shelves Market, by End Use: Key takeaways
- Fig. 28 Smart Shelves Market, by End Use: Market share, 2023 & 2030
- Fig. 29 Hypermarkets Market estimates & forecasts, 2017 - 2030 (USD Million)
- Fig. 30 Supermarkets Market estimates & forecasts, 2017 - 2030 (USD Million)
- Fig. 31 Department Stores Market estimates & forecasts, 2017 - 2030 (USD Million)
- Fig. 32 Warehouses Market estimates & forecasts, 2017 - 2030 (USD Million)
- Fig. 33 Others Market estimates & forecasts, 2017 - 2030 (USD Million)
- Fig. 34 Global Smart Shelves Market revenue, by Region, 2023 & 2030 (USD Million)
- Fig. 35 North America Smart Shelves Market estimates & forecasts, 2017 - 2030 (USD Million)
- Fig. 36 U.S. Smart Shelves Market estimates & forecasts, 2017 - 2030 (USD Million)
- Fig. 37 Canada Smart Shelves Market estimates & forecasts, 2017 - 2030 (USD Million)
- Fig. 38 Mexico Smart Shelves Market estimates & forecasts, 2017 - 2030 (USD Million)
- Fig. 39 Europe Smart Shelves Market estimates & forecasts, 2017 - 2030 (USD Million)
- Fig. 40 UK Smart Shelves Market estimates & forecasts, 2017 - 2030 (USD Million)
- Fig. 41 Germany Smart Shelves Market estimates & forecasts, 2017 - 2030 (USD Million)
- Fig. 42 France Smart Shelves Market estimates & forecasts, 2017 - 2030 (USD Million)
- Fig. 43 Asia Pacific Smart Shelves Market estimates & forecasts, 2017 - 2030 (USD Million)
- Fig. 44 China Smart Shelves Market estimates & forecasts, 2017 - 2030 (USD Million)
- Fig. 45 India Smart Shelves Market estimates & forecasts, 2017 - 2030 (USD Million)
- Fig. 46 Japan Smart Shelves Market estimates & forecasts, 2017 - 2030 (USD Million)
- Fig. 47 South Korea Smart Shelves Market estimates & forecasts, 2017 - 2030 (USD Million)
- Fig. 48 Australia Smart Shelves Market estimates & forecasts, 2017 - 2030 (USD Million)
- Fig. 49 Latin America Smart Shelves Market estimates & forecasts, 2017 - 2030 (USD Million)
- Fig. 50 Brazil Smart Shelves Market estimates & forecasts, 2017 - 2030 (USD Million)
- Fig. 51 Middle East & Africa Smart Shelves Market estimates & forecasts, 2017 - 2030 (USD Million)
- Fig. 52 Kingdom of Saudi Arabia (KSA) Smart Shelves Market estimates & forecasts, 2017 - 2030 (USD Million)
- Fig. 53 UAE Smart Shelves Market estimates & forecasts, 2017 - 2030 (USD Million)
- Fig. 54 South Africa Smart Shelves Market estimates & forecasts, 2017 - 2030 (USD Million)
- Fig. 55 Key company categorization
- Fig. 56 Smart Shelves Market - Key company market share analysis, 2023
- Fig. 57 Strategic framework
Smart Shelves Market Size & Trends:
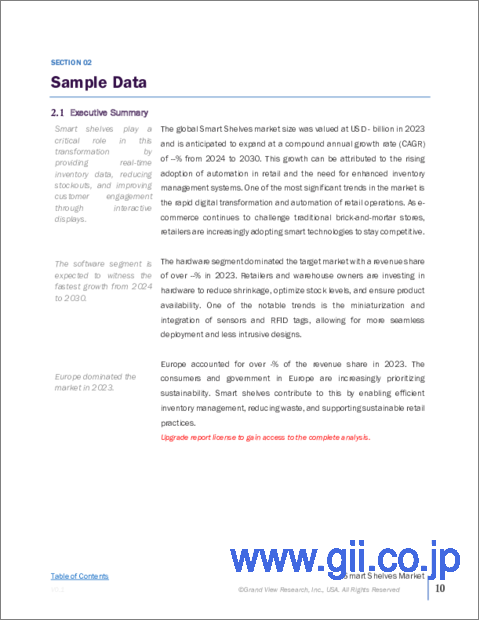
The global smart shelves market size was estimated at USD 3.31 billion in 2023 and is projected to grow at a CAGR of 24.2% from 2024 to 2030. This growth can be attributed to the rising adoption of automation in retail and the need for enhanced inventory management systems. One of the most significant trends in the market is the rapid digital transformation and automation of retail operations. As e-commerce continues to challenge traditional brick-and-mortar stores, retailers are increasingly adopting smart technologies to stay competitive.
Smart shelves play a critical role in this transformation by providing real-time inventory data, reducing stockouts, and improving customer engagement through interactive displays.
Effective inventory management is a critical factor driving the adoption of smart shelves. Traditional inventory systems often rely on manual processes, which are prone to errors and inefficiencies. Smart shelves provide real-time visibility into inventory levels, allowing retailers to automate replenishment processes and reduce the risk of stockouts or overstocking. This leads to significant cost savings and improved customer satisfaction.
In today's competitive retail environment, providing superior customer experience is paramount. Smart shelves enhance the shopping experience by offering personalized promotions, interactive displays, and real-time product information. These features not only attract customers but also encourage them to spend more time in the store, increasing the likelihood of purchases. Retailers are increasingly adopting smart shelves to differentiate themselves and build customer loyalty.
Advancements in IoT technology have been a major driving factor behind the growth of the smart shelves industry. The proliferation of connected devices and the increasing affordability of sensors, RFID tags, and digital displays have made smart shelves more accessible to retailers of all sizes. The integration of IoT technology enables retailers to collect and analyze vast amounts of data, leading to more informed decision-making and improved operational efficiency. Furthermore, the integration of AI and machine learning into smart shelves has opened new possibilities for retailers. AI algorithms can analyze vast amounts of data collected by smart shelves to identify patterns and trends, enabling retailers to make data-driven decisions.
Regulatory compliance and product safety are critical concerns for retailers, particularly in sectors such as food and pharmaceuticals. Smart shelves help retailers meet regulatory requirements by providing real-time monitoring of product conditions, such as temperature and humidity. This ensures that products are stored in optimal conditions, reducing the risk of spoilage and ensuring compliance with safety standards. The rise of e-commerce has significantly impacted traditional retail, forcing brick-and-mortar stores to innovate. Smart shelves are a response to this challenge, enabling physical stores to offer a seamless shopping experience that integrates with online platforms.
Global Smart Shelves Market Report Segmentation
This report forecasts revenue growth at global, regional, and country levels and analyzes the latest industry trends in each of the sub-segments from 2017 to 2030. For this study, Grand View Research has segmented the global smart shelves market report based on component, application, end-use, and region.
- Component Outlook (Revenue, USD Million, 2017 - 2030)
- Hardware
- Software
- Services
- Application Outlook (Revenue, USD Million, 2017 - 2030)
- Planogram Management
- Inventory Management
- Pricing Management
- Content Management
- Others
- End-use Outlook (Revenue, USD Million, 2017 - 2030)
- Hypermarkets
- Supermarkets
- Department Stores
- Warehouses
- Others
- Regional Outlook (Revenue, USD Million, 2017 - 2030)
- North America
- U.S.
- Canada
- Mexico
- Europe
- UK
- Germany
- France
- Asia Pacific
- India
- China
- Japan
- South Korea
- Australia
- Latin America
- Brazil
- Middle East and Africa (MEA)
- Kingdom of Saudi Arabia (KSA)
- UAE
- South Africa
Table of Contents
Chapter 1. Methodology and Scope
- 1.1. Market Segmentation and Scope
- 1.2. Market Definitions
- 1.3. Research Methodology
- 1.3.1. Information Procurement
- 1.3.2. Information or Data Analysis
- 1.3.3. Market Formulation & Data Visualization
- 1.3.4. Data Validation & Publishing
- 1.4. Research Scope and Assumptions
- 1.4.1. List of Data Sources
Chapter 2. Executive Summary
- 2.1. Market Outlook
- 2.2. Segment Outlook
- 2.3. Competitive Insights
Chapter 3. Smart Shelves Market Variables, Trends, & Scope
- 3.1. Market Introduction/Lineage Outlook
- 3.2. Industry Value Chain Analysis
- 3.3. Market Dynamics
- 3.3.1. Market Drivers Analysis
- 3.3.2. Market Restraints Analysis
- 3.3.3. Industry Opportunities
- 3.3.4. Industry Challenges
- 3.4. Smart Shelves Market Analysis Tools
- 3.4.1. Porter's Analysis
- 3.4.1.1. Bargaining power of the suppliers
- 3.4.1.2. Bargaining power of the buyers
- 3.4.1.3. Threats of substitution
- 3.4.1.4. Threats from new entrants
- 3.4.1.5. Competitive rivalry
- 3.4.2. PESTEL Analysis
- 3.4.2.1. Political landscape
- 3.4.2.2. Economic and Social landscape
- 3.4.2.3. Technological landscape
- 3.4.2.4. Environmental landscape
- 3.4.2.5. Legal landscape
- 3.4.1. Porter's Analysis
Chapter 4. Smart Shelves Market: Component Estimates & Trend Analysis
- 4.1. Segment Dashboard
- 4.2. Smart Shelves Market: Component Movement Analysis, 2023 & 2030 (USD Million)
- 4.3. Hardware
- 4.3.1. Smart Shelves Hardware Market Revenue Estimates and Forecasts, 2017 - 2030 (USD Million)
- 4.4. Software
- 4.4.1. Smart Shelves Software Market Revenue Estimates and Forecasts, 2017 - 2030 (USD Million)
- 4.5. Service
- 4.5.1. Smart Shelves Services Market Revenue Estimates and Forecasts, 2017 - 2030 (USD Million)
Chapter 5. Smart Shelves Market: Application Estimates & Trend Analysis
- 5.1. Segment Dashboard
- 5.2. Smart Shelves Market: Application Movement Analysis, 2023 & 2030 (USD Million)
- 5.3. Planogram Management
- 5.3.1. Smart Shelves Market in Planogram Management Revenue Estimates and Forecasts, 2017 - 2030 (USD Million)
- 5.4. Inventory Management
- 5.4.1. Small Shelves Market in Inventory Management Revenue Estimates and Forecasts, 2017 - 2030 (USD Million)
- 5.5. Pricing Management
- 5.5.1. Small Shelves Market in Pricing Management Revenue Estimates and Forecasts, 2017 - 2030 (USD Million)
- 5.6. Content Management
- 5.6.1. Small Shelves Market in Content Management Revenue Estimates and Forecasts, 2017 - 2030 (USD Million)
- 5.7. Others
- 5.7.1. Small Shelves Market in Other Applications Revenue Estimates and Forecasts, 2017 - 2030 (USD Million)
Chapter 6. Smart Shelves Market: End Use Estimates & Trend Analysis
- 6.1. Segment Dashboard
- 6.2. Smart Shelves Market: End Use Movement Analysis, 2023 & 2030 (USD Million)
- 6.3. Hypermarkets
- 6.3.1. Smart Shelves Market in Hypermarkets Revenue Estimates and Forecasts, 2017 - 2030 (USD Million)
- 6.4. Supermarkets
- 6.4.1. Small Shelves Market in Supermarkets Revenue Estimates and Forecasts, 2017 - 2030 (USD Million)
- 6.5. Department Stores
- 6.5.1. Small Shelves Market in Department Stores Revenue Estimates and Forecasts, 2017 - 2030 (USD Million)
- 6.6. Warehouses
- 6.6.1. Small Shelves Market in Warehouses Revenue Estimates and Forecasts, 2017 - 2030 (USD Million)
- 6.7. Others
- 6.7.1. Small Shelves Market in Other End Uses Revenue Estimates and Forecasts, 2017 - 2030 (USD Million)
Chapter 7. Smart Shelves Market: Regional Estimates & Trend Analysis
- 7.1. Smart Shelves Market Share, By Region, 2023 & 2030, USD Million
- 7.2. North America
- 7.2.1. North America Smart Shelves Market Estimates and Forecasts, 2017 - 2030 (USD Million)
- 7.2.2. North America Smart Shelves Market Estimates and Forecasts, by Component, 2017 - 2030 (USD Million)
- 7.2.3. North America Smart Shelves Market Estimates and Forecasts, by Application, 2017 - 2030 (USD Million)
- 7.2.4. North America Smart Shelves Market Estimates and Forecasts, by End Use, 2017 - 2030 (USD Million)
- 7.2.5. U.S.
- 7.2.5.1. U.S. Smart Shelves Market Estimates and Forecasts, 2017 - 2030 (USD Million)
- 7.2.5.2. U.S. Smart Shelves Market Estimates and Forecasts, by Component, 2017 - 2030 (USD Million)
- 7.2.5.3. U.S. Smart Shelves Market Estimates and Forecasts, by Application, 2017 - 2030 (USD Million)
- 7.2.5.4. U.S. Smart Shelves Market Estimates and Forecasts, by End Use, 2017 - 2030 (USD Million)
- 7.2.6. Canada
- 7.2.6.1. Canada Smart Shelves Market Estimates and Forecasts, 2017 - 2030 (USD Million)
- 7.2.6.2. Canada Smart Shelves Market Estimates and Forecasts, by Component, 2017 - 2030 (USD Million)
- 7.2.6.3. Canada Smart Shelves Market Estimates and Forecasts, by Application, 2017 - 2030 (USD Million)
- 7.2.6.4. Canada Smart Shelves Market Estimates and Forecasts, by End Use, 2017 - 2030 (USD Million)
- 7.2.7. Mexico
- 7.2.7.1. Mexico Smart Shelves Market Estimates and Forecasts, 2017 - 2030 (USD Million)
- 7.2.7.2. Mexico Smart Shelves Market Estimates and Forecasts, by Component, 2017 - 2030 (USD Million)
- 7.2.7.3. Mexico Smart Shelves Market Estimates and Forecasts, by Application, 2017 - 2030 (USD Million)
- 7.2.7.4. Mexico Smart Shelves Market Estimates and Forecasts, by End Use, 2017 - 2030 (USD Million)
- 7.3. Europe
- 7.3.1. Europe Smart Shelves Market Estimates and Forecasts, 2017 - 2030 (USD Million)
- 7.3.2. Europe Smart Shelves Market Estimates and Forecasts, by Component, 2017 - 2030 (USD Million)
- 7.3.3. Europe Smart Shelves Market Estimates and Forecasts, by Application, 2017 - 2030 (USD Million)
- 7.3.4. Europe Smart Shelves Market Estimates and Forecasts, by End Use, 2017 - 2030 (USD Million)
- 7.3.5. UK
- 7.3.5.1. UK Smart Shelves Market Estimates and Forecasts, 2017 - 2030 (USD Million)
- 7.3.5.2. UK Smart Shelves Market Estimates and Forecasts, by Component, 2017 - 2030 (USD Million)
- 7.3.5.3. UK Smart Shelves Market Estimates and Forecasts, by Application, 2017 - 2030 (USD Million)
- 7.3.5.4. UK Smart Shelves Market Estimates and Forecasts, by End Use, 2017 - 2030 (USD Million)
- 7.3.6. Germany
- 7.3.6.1. Germany Smart Shelves Market Estimates and Forecasts, 2017 - 2030 (USD Million)
- 7.3.6.2. Germany Smart Shelves Market Estimates and Forecasts, by Component, 2017 - 2030 (USD Million)
- 7.3.6.3. Germany Smart Shelves Market Estimates and Forecasts, by Application, 2017 - 2030 (USD Million)
- 7.3.6.4. Germany Smart Shelves Market Estimates and Forecasts, by End Use, 2017 - 2030 (USD Million)
- 7.3.7. France
- 7.3.7.1. France Smart Shelves Market Estimates and Forecasts, 2017 - 2030 (USD Million)
- 7.3.7.2. France Smart Shelves Market Estimates and Forecasts, by Component, 2017 - 2030 (USD Million)
- 7.3.7.3. France Smart Shelves Market Estimates and Forecasts, by Application, 2017 - 2030 (USD Million)
- 7.3.7.4. France Smart Shelves Market Estimates and Forecasts, by End Use, 2017 - 2030 (USD Million)
- 7.4. Asia Pacific
- 7.4.1. Asia Pacific Smart Shelves Market Estimates and Forecasts, 2017 - 2030 (USD Million)
- 7.4.2. Asia Pacific Smart Shelves Market Estimates and Forecasts, by Component, 2017 - 2030 (USD Million)
- 7.4.3. Asia Pacific Smart Shelves Market Estimates and Forecasts, by Application, 2017 - 2030 (USD Million)
- 7.4.4. Asia Pacific Smart Shelves Market Estimates and Forecasts, by End Use, 2017 - 2030 (USD Million)
- 7.4.5. China
- 7.4.5.1. China Smart Shelves Market Estimates and Forecasts, 2017 - 2030 (USD Million)
- 7.4.5.2. China Smart Shelves Market Estimates and Forecasts, by Component, 2017 - 2030 (USD Million)
- 7.4.5.3. China Smart Shelves Market Estimates and Forecasts, by Application, 2017 - 2030 (USD Million)
- 7.4.5.4. China Smart Shelves Market Estimates and Forecasts, by End Use, 2017 - 2030 (USD Million)
- 7.4.6. Japan
- 7.4.6.1. Japan Smart Shelves Market Estimates and Forecasts, 2017 - 2030 (USD Million)
- 7.4.6.2. Japan Smart Shelves Market Estimates and Forecasts, by Component, 2017 - 2030 (USD Million)
- 7.4.6.3. Japan Smart Shelves Market Estimates and Forecasts, by Application, 2017 - 2030 (USD Million)
- 7.4.6.4. Japan Smart Shelves Market Estimates and Forecasts, by End Use, 2017 - 2030 (USD Million)
- 7.4.7. India
- 7.4.7.1. India Smart Shelves Market Estimates and Forecasts, 2017 - 2030 (USD Million)
- 7.4.7.2. India Smart Shelves Market Estimates and Forecasts, by Component, 2017 - 2030 (USD Million)
- 7.4.7.3. India Smart Shelves Market Estimates and Forecasts, by Application, 2017 - 2030 (USD Million)
- 7.4.7.4. India Smart Shelves Market Estimates and Forecasts, by End Use, 2017 - 2030 (USD Million)
- 7.4.8. South Korea
- 7.4.8.1. South Korea Smart Shelves Market Estimates and Forecasts, 2017 - 2030 (USD Million)
- 7.4.8.2. South Korea Smart Shelves Market Estimates and Forecasts, by Component, 2017 - 2030 (USD Million)
- 7.4.8.3. South Korea Smart Shelves Market Estimates and Forecasts, by Application, 2017 - 2030 (USD Million)
- 7.4.8.4. South Korea Smart Shelves Market Estimates and Forecasts, by End Use, 2017 - 2030 (USD Million)
- 7.4.9. Australia
- 7.4.9.1. Australia Smart Shelves Market Estimates and Forecasts, 2017 - 2030 (USD Million)
- 7.4.9.2. Australia Smart Shelves Market Estimates and Forecasts, by Component, 2017 - 2030 (USD Million)
- 7.4.9.3. Australia Smart Shelves Market Estimates and Forecasts, by Application, 2017 - 2030 (USD Million)
- 7.4.9.4. Australia Smart Shelves Market Estimates and Forecasts, by End Use, 2017 - 2030 (USD Million)
- 7.5. Latin America
- 7.5.1. Latin America Smart Shelves Market Estimates and Forecasts, 2017 - 2030 (USD Million)
- 7.5.2. Latin America Smart Shelves Market Estimates and Forecasts, by Component, 2017 - 2030 (USD Million)
- 7.5.3. Latin America Smart Shelves Market Estimates and Forecasts, by Application, 2017 - 2030 (USD Million)
- 7.5.4. Latin America Smart Shelves Market Estimates and Forecasts, by End Use, 2017 - 2030 (USD Million)
- 7.5.5. Brazil
- 7.5.5.1. Brazil Smart Shelves Market Estimates and Forecasts, 2017 - 2030 (USD Million)
- 7.5.5.2. Brazil Smart Shelves Market Estimates and Forecasts, by Component, 2017 - 2030 (USD Million)
- 7.5.5.3. Brazil Smart Shelves Market Estimates and Forecasts, by Application, 2017 - 2030 (USD Million)
- 7.5.5.4. Brazil Smart Shelves Market Estimates and Forecasts, by End Use, 2017 - 2030 (USD Million)
- 7.6. Middle East and Africa
- 7.6.1. Middle East & Africa Smart Shelves Market Estimates and Forecasts, 2017 - 2030 (USD Million)
- 7.6.2. Middle East and Africa Smart Shelves Market Estimates and Forecasts, by Component, 2017 - 2030 (USD Million)
- 7.6.3. Middle East and Africa Smart Shelves Market Estimates and Forecasts, by Application, 2017 - 2030 (USD Million)
- 7.6.4. Middle East and Africa Smart Shelves Market Estimates and Forecasts, by End Use, 2017 - 2030 (USD Million)
- 7.6.5. Kingdom of Saudi Arabia (KSA)
- 7.6.5.1. Kingdom of Saudi Arabia (KSA) Smart Shelves Market Estimates and Forecasts, 2017 - 2030 (USD Million)
- 7.6.5.2. KSA Smart Shelves Market Estimates and Forecasts, by Component, 2017 - 2030 (USD Million)
- 7.6.5.3. KSA Smart Shelves Market Estimates and Forecasts, by Application, 2017 - 2030 (USD Million)
- 7.6.5.4. KSA Smart Shelves Market Estimates and Forecasts, by End Use, 2017 - 2030 (USD Million)
- 7.6.6. UAE
- 7.6.6.1. UAE Smart Shelves Market Estimates and Forecasts, 2017 - 2030 (USD Million)
- 7.6.6.2. UAE Smart Shelves Market Estimates and Forecasts, by Component, 2017 - 2030 (USD Million)
- 7.6.6.3. UAE Smart Shelves Market Estimates and Forecasts, by Application, 2017 - 2030 (USD Million)
- 7.6.6.4. UAE Smart Shelves Market Estimates and Forecasts, by End Use, 2017 - 2030 (USD Million)
- 7.6.7. South Africa
- 7.6.7.1. South Africa Smart Shelves Market Estimates and Forecasts, 2017 - 2030 (USD Million)
- 7.6.7.2. South Africa Smart Shelves Market Estimates and Forecasts, by Component, 2017 - 2030 (USD Million)
- 7.6.7.3. South Africa Smart Shelves Market Estimates and Forecasts, by Application, 2017 - 2030 (USD Million)
- 7.6.7.4. South Africa Smart Shelves Market Estimates and Forecasts, by End Use, 2017 - 2030 (USD Million)
Chapter 8. Competitive Landscape
- 8.1. Recent Developments & Impact Analysis by Key Market Participants
- 8.2. Company Categorization
- 8.3. Company Market Positioning
- 8.4. Company Market Share Analysis
- 8.5. Company Heat Map Analysis
- 8.6. Strategy Mapping
- 8.6.1. Expansion
- 8.6.2. Mergers & Acquisition
- 8.6.3. Partnerships & Collaborations
- 8.6.4. New Product Launches
- 8.6.5. Research And Development
- 8.7. Company Profiles
- 8.7.1. Avery Dennison Corporation
- 8.7.1.1. Participant's Overview
- 8.7.1.2. Financial Performance
- 8.7.1.3. Product Benchmarking
- 8.7.1.4. Recent Developments
- 8.7.2. AWM Smart Shelf
- 8.7.2.1. Participant's Overview
- 8.7.2.2. Financial Performance
- 8.7.2.3. Product Benchmarking
- 8.7.2.4. Recent Developments
- 8.7.3. E Ink Holdings Inc
- 8.7.3.1. Participant's Overview
- 8.7.3.2. Financial Performance
- 8.7.3.3. Product Benchmarking
- 8.7.3.4. Recent Developments
- 8.7.4. Happiest Minds Technologies Limited
- 8.7.4.1. Participant's Overview
- 8.7.4.2. Financial Performance
- 8.7.4.3. Product Benchmarking
- 8.7.4.4. Recent Developments
- 8.7.5. Honeywell International Inc.
- 8.7.5.1. Participant's Overview
- 8.7.5.2. Financial Performance
- 8.7.5.3. Product Benchmarking
- 8.7.5.4. Recent Developments
- 8.7.6. Huawei Technologies Co. Ltd
- 8.7.6.1. Participant's Overview
- 8.7.6.2. Financial Performance
- 8.7.6.3. Product Benchmarking
- 8.7.6.4. Recent Developments
- 8.7.7. Intel Corporation
- 8.7.7.1. Participant's Overview
- 8.7.7.2. Financial Performance
- 8.7.7.3. Product Benchmarking
- 8.7.7.4. Recent Developments
- 8.7.8. Lenovo PCCW Solutions Limited
- 8.7.8.1. Participant's Overview
- 8.7.8.2. Financial Performance
- 8.7.8.3. Product Benchmarking
- 8.7.8.4. Recent Developments
- 8.7.9. Samsung Electronics Co. Ltd
- 8.7.9.1. Participant's Overview
- 8.7.9.2. Financial Performance
- 8.7.9.3. Product Benchmarking
- 8.7.9.4. Recent Developments
- 8.7.10. Trax Retail
- 8.7.10.1. Participant's Overview
- 8.7.10.2. Financial Performance
- 8.7.10.3. Product Benchmarking
- 8.7.10.4. Recent Developments
- 8.7.1. Avery Dennison Corporation
