|
|
市場調査レポート
商品コード
1869972
プレミアムスピリッツの市場規模、シェアと動向分析レポート:製品別、流通チャネル別、地域別、セグメント別予測(2025年~2033年)Premium Spirits Market Size, Share & Trends Analysis Report By Product (Vodka, Whiskey, Gin, Rum, Tequila, Brandy), By Distribution Channel (On-Trade, Off-Trade), By Region, And Segment Forecasts, 2025 - 2033 |
||||||
|
|||||||
カスタマイズ可能
|
|||||||

| プレミアムスピリッツの市場規模、シェアと動向分析レポート:製品別、流通チャネル別、地域別、セグメント別予測(2025年~2033年) |
|
出版日: 2025年10月29日
発行: Grand View Research
ページ情報: 英文 110 Pages
納期: 2~10営業日
|

概要
プレミアムスピリッツ市場サマリー
世界のプレミアムスピリッツ市場規模は、2024年に2,339億6,000万米ドルと推定され、2033年には5,466億7,000万米ドルに達すると予測されています。
2025年から2033年にかけてCAGR 10.1%で成長する見込みです。ミレニアル世代における高級飲料の人気上昇が、世界的な市場成長を牽引しています。
マルガリータ、マティーニ、マンハッタンなどのカクテルは、北米や欧州の先進国経済圏で著しい支持を得ています。さらに、中国やインドなどの発展途上国におけるカクテル文化の普及拡大が、プレミアムスピリッツの市場範囲を拡大すると予想されます。過去数年間、高級アルコール飲料セグメントの成長は全体セグメントの成長を上回っており、その結果、世界全体のアルコール消費量全体を押し上げています。
プレミアムスピリッツ市場を牽引するもう一つの重要な要素は、本物志向と産地へのこだわりです。消費者は、消費する製品にまつわる背景、すなわちスピリッツの製造場所や製造方法などに関心を強めています。これにより、伝統的な製法、高品質な原料、そして職人技と伝統を重視して製造されるプレミアムスピリッツへの嗜好が高まっています。
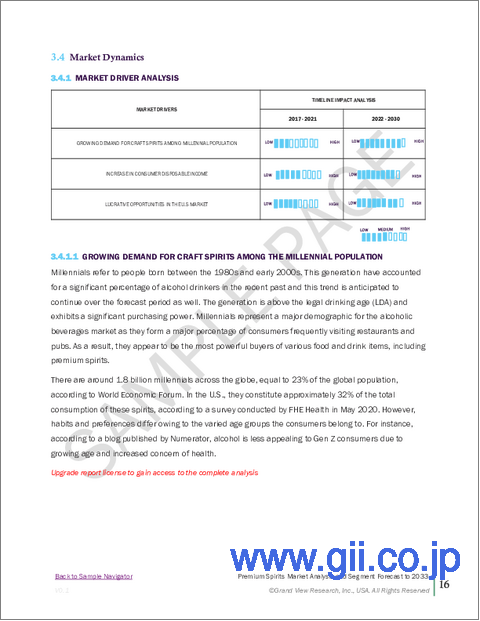
近年、ミレニアル世代がアルコール消費者の相当な割合を占めており、この動向は予測期間中も継続すると見込まれます。同世代は購買力が大きく、法定飲酒年齢(LDA)を超えています。加えて、プレミアムスピリッツは天然原料を使用し、一般酒類よりも品質が優れています。これらの要因が予測期間中の市場成長を牽引すると予想されます。
プレミアムスピリッツ産業は、主に可処分所得の増加によって牽引されています。可処分所得の高い顧客層は最高品質のスピリッツを入手可能です。消費者は飲酒習慣への意識が高まっているため、高品質なプレミアム製品に対してより多くの費用を支払う傾向にあります。加えて、若年層におけるパブやバーへの訪問増加動向も市場拡大に寄与すると見込まれます。
しかしながら、アルコールに対する政府規制の強化、消費者の健康意識の高まり、そして従来のアルコール飲料から低アルコール・ノンアルコール飲料への嗜好変化の増加が主な抑制要因となり、市場成長を妨げるものと見込まれます。
よくあるご質問
目次
第1章 調査手法と範囲
第2章 エグゼクティブサマリー
第3章 プレミアムスピリッツ市場の変数、動向、範囲
- 市場導入
- 浸透と成長の見通しマッピング
- 業界バリューチェーン分析
- 販売/小売チャネル分析
- 利益率分析
- 市場力学
- 市場促進要因分析
- 市場抑制要因分析
- 業界の課題
- 業界の機会
- ビジネス環境分析
- 業界分析- ポーターのファイブフォース分析
- 市場参入戦略
第4章 消費者行動分析
- 消費者の動向と嗜好
- 購入決定に影響を与える要因
- 消費者製品の採用
- 観察と推奨事項
第5章 プレミアムスピリッツ市場:製品別推定・動向分析
- プレミアムスピリッツ市場(製品別):主なポイント
- 製品別変動分析と市場シェア、2024年と2033年
- ウォッカ
- ウィスキー
- ジン
- テキーラ
- ラム酒
- ブランデー
- その他
第6章 プレミアムスピリッツ市場:流通チャネル別推定・動向分析
- プレミアムスピリッツ市場(流通チャネル別):主なポイント
- 流通チャネル別変動分析と市場シェア、2024年と2033年
- オントレード
- オフトレード
- ハイパーマーケットとスーパーマーケット
- 酒屋
- その他
第7章 プレミアムスピリッツ市場:地域別推定・動向分析
- 地域別変動分析と市場シェア、2024年と2033年
- 北米
- 製品別、2021年~2033年
- 流通チャネル別、2021年~2033年
- 米国
- カナダ
- メキシコ
- 欧州
- 製品別、2021年~2033年
- 流通チャネル別、2021年~2033年
- ドイツ
- 英国
- フランス
- イタリア
- スペイン
- アジア太平洋
- 製品別、2021年~2033年
- 流通チャネル別、2021年~2033年
- 中国
- 日本
- インド
- 韓国
- オーストラリアとニュージーランド
- ラテンアメリカ
- 製品別、2021年~2033年
- 流通チャネル別、2021年~2033年
- ブラジル
- 中東・アフリカ
- 製品別、2021年~2033年
- 流通チャネル別、2021年~2033年
- 南アフリカ
第8章 競合分析
- 主要市場参入企業による最近の動向と影響分析
- 企業分類
- 参入企業の概要
- 財務実績
- 製品ポートフォリオ
- 企業市場シェア分析、2024年(%)
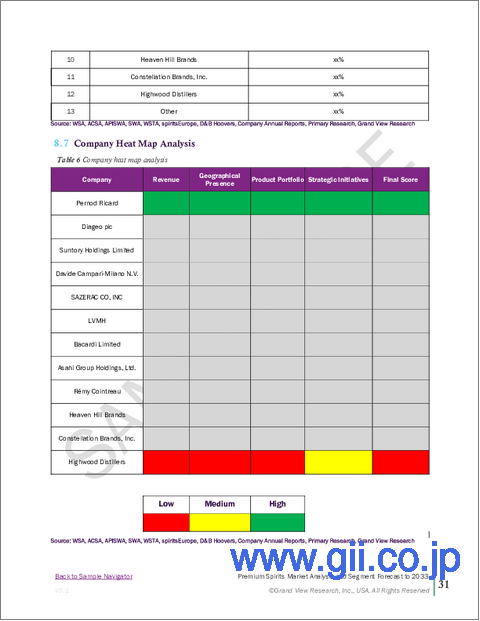
- 企業ヒートマップ分析
- 戦略マッピング
- 企業プロファイル
- Asahi Group Holdings, Ltd.
- Diageo PLC
- Pernod Ricard
- Constellation Brands Inc
- Remy Cointreau
- Bacardi Limited
- Suntory Holding Limited
- Davide Campari-Milano NV
- Highwood Distillers
- Heaven Hill Distillery
- LVMH
- SAZERAC CO, INC

