|
|
市場調査レポート
商品コード
1530446
高級SUVの市場規模、シェア、動向分析レポート:車両タイプ別、推進タイプ別、地域別、セグメント予測、2024~2030年Luxury SUV Market Size, Share & Trends Analysis Report By Vehicle Type (Compact, Mid Size, Full Size), By Propulsion Type (ICE, Electric), By Region (North America, Europe), And Segment Forecasts, 2024 - 2030 |
||||||
カスタマイズ可能
|
|||||||
| 高級SUVの市場規模、シェア、動向分析レポート:車両タイプ別、推進タイプ別、地域別、セグメント予測、2024~2030年 |
|
出版日: 2024年07月24日
発行: Grand View Research
ページ情報: 英文 120 Pages
納期: 2~10営業日
|
全表示
- 概要
- 図表
- 目次
高級SUVの市場規模・動向
高級SUVの世界市場規模は、2023年に1,718億8,000万米ドルと推計され、2024年から2030年にかけてCAGR 18.1%で成長すると予測されています。市場の成長は、先進技術、優れた快適性、強化された性能の組み合わせによるものと考えられます。高級SUVは、実用性と豪華さを求める消費者に好まれる選択肢となっています。持続可能性へのシフトにより、電気自動車やハイブリッド高級SUVの生産と販売が大幅に増加しています。
高級SUVは自動車技術の最先端にあり、ADAS(先進運転支援システム)、自律走行機能、最先端のインフォテインメント・システムなどの機能を統合しています。さらに、事故を最小限に抑えるためにSUVに高度な安全機能を求める需要が高まっていることが、予測期間中の市場の需要をさらに押し上げています。例えば、米国高速道路交通安全局(NHTSA)が発表した報告書によると、SUVにADASを採用することで事故率が23%減少しており、こうした技術の安全上の利点が強調されています。
市場の消費者は、カスタマイズされ、パーソナライズされたオプションをますます求めるようになっています。メーカー各社はオーダーメイドのサービスを提供し、顧客が特定の要件に合わせて車両をカスタマイズできるようにしています。この動向は、豊かさと個人主義がユニークな高級車への需要を牽引する米国や欧州などの市場で特に顕著です。さらに、最先端のコネクティビティとインフォテインメント・システムは、高級SUVにとって重要なセールスポイントとなっています。大型タッチスクリーン・インフォテインメント、音声操作、シームレスなスマートフォン連携といった機能は、今やこのセグメントの標準装備となっています。欧州委員会が発表した報告書によると、5G技術の統合は高級車のコネクティビティ機能をさらに強化します。
高級SUVは都市部での使用を連想させることが多いが、オフロード性能を強化する傾向が強まっています。ランドローバーやメルセデス・ベンツなどのブランドは、先進的な四輪駆動システムや頑丈なデザイン要素を取り入れ、冒険を求める消費者にアピールしています。さらに、高級SUVを所有することは、高い社会的地位や名声に結びつくことが多いです。レクサス、ランドローバー、メルセデス・ベンツといったブランドは、成功と豊かさの象徴です。米国労働統計局の調査によると、高級車を含む贅沢品への支出は、富裕層の間で依然として堅調です。
厳しい環境規制と電気自動車に対する政府のインセンティブが市場を形成しています。二酸化炭素排出量を削減する政策は、よりクリーンで効率的な高級車の開発をメーカーに促しています。例えば、2023年9月、Mercedes-Benz India Pvt. Ltd.はインドでEQE SUVと名付けられた電気高級SUVを発売しました。このSUVは、1回の充電で最大465~550Kmの航続距離を実現します。
目次
第1章 調査手法と範囲
第2章 エグゼクティブサマリー
第3章 市場の変数、動向、範囲
- 市場系統の見通し
- 業界バリューチェーン分析
- 市場力学
- 市場促進要因の影響分析
- 市場抑制要因の影響分析
- 市場機会の影響分析
- 業界分析ツール
- ポーターの分析
- PESTEL分析
第4章 高級SUV市場: 車両タイプ別推計・動向分析
- 車両タイプ別変動分析と市場シェア、2023年と2030年
- 車両タイプ別市場推計・予測
第5章 高級SUV市場:推進タイプ別推計・動向分析
- 推進タイプ別変動分析と市場シェア、2023年と2030年
- 推進タイプ別市場推計・予測
第6章 高級SUV市場:地域別推計・動向分析
- 高級SUV市場:地域別展望
- 北米
- 北米市場の推計と予測、2018年-2030年
- 米国
- カナダ
- メキシコ
- 欧州
- 欧州市場の推計と予測、2018年-2030年
- ドイツ
- 英国
- フランス
- アジア太平洋
- アジア太平洋市場の推計と予測、2018年-2030年
- 中国
- インド
- 日本
- オーストラリア
- 韓国
- ラテンアメリカ
- ラテンアメリカ市場の推計と予測、2018年-2030年
- ブラジル
- 中東・アフリカ
- 中東・アフリカ市場の推計と予測、2018年-2030年
- アラブ首長国連邦
- サウジアラビア王国(KSA)
- 南アフリカ
第7章 競合情勢
- 企業分類
- 財務実績
- 製品ベンチマーク
- 企業市場シェア分析、2023年
- 企業ヒートマップ分析
- 戦略マッピング
- 拡大
- コラボレーション
- 合併と買収
- 新しいスピードの発売
- パートナーシップ
- その他
- 企業リスト
- AB Volvo
- Aston Martin Holdings UK Ltd
- Bayerische Motoren Werke AG
- General Motors
- Isuzu Motors Ltd.
- Mercedes-Benz Group AG
- Nissan Motor Corporation
- Tata Motors Limited
- Toyota Motor Corporation
- Volkswagen Group
List of tables
Table 1 Hybrid train market, (USD Billion) 2018 - 2030
Table 2 Global market estimates and forecasts, by region, 2018 - 2030 (USD Billion)
Table 3 Global market estimates and forecasts, by vehicle type, 2018 - 2030 (USD Billion)
Table 4 Global market estimates and forecasts, by propulsion type, 2018 - 2030 (USD Billion)
Table 5 Compact luxury SUV market, by region, 2018 - 2030 (USD Billion)
Table 6 Mid size luxury SUV market, by region, 2018 - 2030 (USD Billion)
Table 7 Full Size Powered luxury SUV market, by region, 2018 - 2030 (USD Billion)
Table 8 ICE luxury SUV market, by region, 2018 - 2030 (USD Billion)
Table 9 Electric luxury SUV market, by region, 2018 - 2030 (USD Billion)
Table 10 North America luxury SUV market, by vehicle type, 2018 - 2030 (USD Billion)
Table 11 North America luxury SUV market, by propulsion type, 2018 - 2030 (USD Billion)
Table 12 U.S. luxury SUV market, by vehicle type, 2018 - 2030 (USD Billion)
Table 13 U.S. luxury SUV market, by propulsion type, 2018 - 2030 (USD Billion)
Table 14 Canada luxury SUV market, by vehicle type, 2018 - 2030 (USD Billion)
Table 15 Canada luxury SUV market, by propulsion type, 2018 - 2030 (USD Billion)
Table 16 Mexico luxury SUV market, by vehicle type, 2018 - 2030 (USD Billion)
Table 17 Mexico luxury SUV market, by propulsion type, 2018 - 2030 (USD Billion)
Table 18 Europe luxury SUV market, by vehicle type, 2018 - 2030 (USD Billion)
Table 19 Europe luxury SUV market, by propulsion type, 2018 - 2030 (USD Billion)
Table 20 Germany luxury SUV market, by vehicle type, 2018 - 2030 (USD Billion)
Table 21 Germany luxury SUV market, by propulsion type, 2018 - 2030 (USD Billion)
Table 22 UK luxury SUV market, by vehicle type, 2018 - 2030 (USD Billion)
Table 23 UK luxury SUV market, by propulsion type, 2018 - 2030 (USD Billion)
Table 24 France luxury SUV market, by vehicle type, 2018 - 2030 (USD Billion)
Table 25 France luxury SUV market, by propulsion type, 2018 - 2030 (USD Billion)
Table 26 Asia Pacific luxury SUV market, by vehicle type, 2018 - 2030 (USD Billion)
Table 27 Asia Pacific luxury SUV market, by propulsion type, 2018 - 2030 (USD Billion)
Table 28 China luxury SUV market, by vehicle type, 2018 - 2030 (USD Billion)
Table 29 China luxury SUV market, by propulsion type, 2018 - 2030 (USD Billion)
Table 30 India luxury SUV market, by vehicle type, 2018 - 2030 (USD Billion)
Table 31 India luxury SUV market, by propulsion type, 2018 - 2030 (USD Billion)
Table 32 Japan luxury SUV market, by vehicle type, 2018 - 2030 (USD Billion)
Table 33 Japan luxury SUV market, by propulsion type, 2018 - 2030 (USD Billion)
Table 34 Australia luxury SUV market, by vehicle type, 2018 - 2030 (USD Billion)
Table 35 Australia luxury SUV market, by propulsion type, 2018 - 2030 (USD Billion)
Table 36 South Korea luxury SUV market, by vehicle type, 2018 - 2030 (USD Billion)
Table 37 South Korea luxury SUV market, by propulsion type, 2018 - 2030 (USD Billion)
Table 38 Latin America luxury SUV market, by vehicle type, 2018 - 2030 (USD Billion)
Table 39 Latin America luxury SUV market, by propulsion type, 2018 - 2030 (USD Billion)
Table 40 Brazil luxury SUV market, by vehicle type, 2018 - 2030 (USD Billion)
Table 41 Brazil luxury SUV market, by propulsion type, 2018 - 2030 (USD Billion)
Table 42 Middle East & Africa luxury SUV market, by vehicle type, 2018 - 2030 (USD Billion)
Table 43 Middle East & Africa luxury SUV market, by propulsion type, 2018 - 2030 (USD Billion)
Table 44 UAE luxury SUV market, by vehicle type, 2018 - 2030 (USD Billion)
Table 45 UAE luxury SUV market, by propulsion type, 2018 - 2030 (USD Billion)
Table 46 Kingdom of Saudi Arabia (KSA) luxury SUV market, by vehicle type, 2018 - 2030 (USD Billion)
Table 47 Kingdom of Saudi Arabia (KSA) luxury SUV market, by propulsion type, 2018 - 2030 (USD Billion)
Table 48 South Africa luxury SUV market, by vehicle type, 2018 - 2030 (USD Billion)
Table 49 South Africa luxury SUV market, by propulsion type, 2018 - 2030 (USD Billion)
Table 50 Company Market Share, 2023
Table 51 Company Heat Map Analysis
Table 52 Key companies undergoing expansion
Table 53 Key companies undergoing collaborations
Table 54 Key companies undergoing new product launch
Table 55 Key companies undergoing mergers & acquisitions
Table 56 Key companies undergoing other strategies
List of Figures
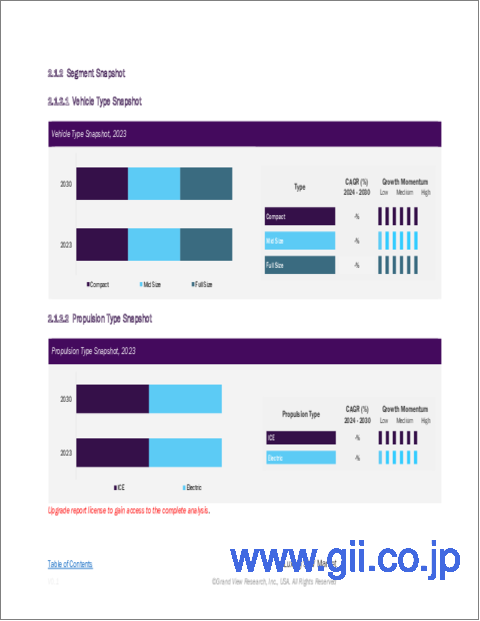
- Fig. 1. Luxury SUV Market Segmentation
- Fig. 2. Information Procurement
- Fig. 3. Information Analysis
- Fig. 4. Market Formulation & Data Visualization
- Fig. 5. Data Validation & Publishing
- Fig. 6. Luxury SUV Market Snapshot
- Fig. 7. Segment Snapshot
- Fig. 8. Competitive Landscape Snapshot
- Fig. 9. Luxury SUV Market Value, 2023 & 2030 (USD Billion)
- Fig. 10. Luxury SUV Market - Market Dynamics
- Fig. 11. Luxury SUV Market: PORTER's Analysis
- Fig. 12. Luxury SUV Market: PESTEL Analysis
- Fig. 13. Luxury SUV Market, by Vehicle Type: Key Takeaways
- Fig. 14. Luxury SUV Market, by Vehicle Type: Market Share, 2023 & 2030
- Fig. 15. Luxury SUV Market, by Propulsion type: Key Takeaways
- Fig. 16. Luxury SUV Market, by Propulsion type: Market Share, 2023 & 2030
- Fig. 17. Luxury SUV Market, by Region, 2023 & 2030, (USD Billion)
- Fig. 18. Regional Marketplace: Key Takeaways
- Fig. 19. North America Luxury SUV Market Estimates & Forecast, 2018 - 2030 (USD Billion)
- Fig. 20. U.S. Luxury SUV Market Estimates & Forecast, 2018 - 2030 (USD Billion)
- Fig. 21. Canada Luxury SUV Market Estimates & Forecast, 2018 - 2030 (USD Billion)
- Fig. 22. Mexico Luxury SUV Market Estimates & Forecast, 2018 - 2030 (USD Billion)
- Fig. 23. Europe Luxury SUV Market Estimates & Forecast, 2018 - 2030 (USD Billion)
- Fig. 24. Germany Luxury SUV Market Estimates & Forecast, 2018 - 2030 (USD Billion)
- Fig. 25. UK Luxury SUV Market Estimates & Forecast, 2018 - 2030 (USD Billion)
- Fig. 26. France Luxury SUV Market Estimates & Forecast, 2018 - 2030 (USD Billion)
- Fig. 27. Asia Pacific Luxury SUV Market Estimates & Forecast, 2018 - 2030 (USD Billion)
- Fig. 28. China Luxury SUV Market Estimates & Forecast, 2018 - 2030 (USD Billion)
- Fig. 29. India Luxury SUV Market Estimates & Forecast, 2018 - 2030 (USD Billion)
- Fig. 30. Japan Luxury SUV Market Estimates & Forecast, 2018 - 2030 (USD Billion)
- Fig. 31. Australia Luxury SUV Market Estimates & Forecast, 2018 - 2030 (USD Billion)
- Fig. 32. South Korea Luxury SUV Market Estimates & Forecast, 2018 - 2030 (USD Billion)
- Fig. 33. Latin America Luxury SUV Market Estimates & Forecast, 2018 - 2030 (USD Billion)
- Fig. 34. Brazil Luxury SUV Market Estimates & Forecast, 2018 - 2030 (USD Billion)
- Fig. 35. MEA Luxury SUV Market Estimates & Forecast, 2018 - 2030 (USD Billion)
- Fig. 36. UAE Luxury SUV Market Estimates & Forecast, 2018 - 2030 (USD Billion)
- Fig. 37. Kingdom of Saudi Arabia Luxury SUV Market Estimates & Forecast, 2018 - 2030 (USD Billion)
- Fig. 38. South Africa Luxury SUV Market Estimates & Forecast, 2018 - 2030 (USD Billion)
- Fig. 39. Company Market Share Analysis, 2023
- Fig. 40. Strategic Framework
Luxury SUV Market Size & Trends
The global luxury SUV market size was estimated at USD 171.88 billion in 2023 and is expected to grow at a CAGR of 18.1% from 2024 to 2030. The market growth can be attributed to a combination of advanced technology, superior comfort, and enhanced performance. Luxury SUVs have become a preferred choice for consumers seeking utility and opulence. The shift towards sustainability has led to a significant rise in the production and sales of electric and hybrid luxury SUVs.
Luxury SUVs are at the forefront of automotive technology, integrating features such as advanced driver assistance systems (ADAS), autonomous driving capabilities, and state-of-the-art infotainment systems. Furthermore, the rising demand for advanced safety features within SUVs to minimize accidents is further driving the demand for the market over the forecast period. For instance, a report published by the National Highway Traffic Safety Administration (NHTSA) stated that the adoption of ADAS in SUVs has reduced accident rates by 23%, underscoring the safety benefits of these technologies.
Consumers in the market are increasingly seeking customized and personalized options. Manufacturers are offering bespoke services, allowing customers to tailor their vehicles to their specific requirements. This trend is particularly evident in markets such as the U.S. and Europe, where affluence and individualism drive demand for unique, high-end vehicles. Furthermore, state-of-the-art connectivity and infotainment systems are a significant selling point for luxury SUVs. Features such as large touchscreen infotainment, voice-activated controls, and seamless smartphone integration are now standard in this segment. According to a report published by the European Commission, the integration of 5G technology further enhances the connectivity features in luxury vehicles.
While luxury SUVs are often associated with urban use, a growing trend is towards enhancing their off-road capabilities. Brands such as Land Rover and Mercedes-Benz are incorporating advanced four-wheel-drive systems and rugged design elements to appeal to adventure-seeking consumers. Furthermore, owning a luxury SUV is often associated with higher social status and prestige. Brands such as Lexus, Land Rover, and Mercedes-Benz symbolize success and affluence. A U.S. Bureau of Labor Statistics survey indicated that spending on luxury goods, including high-end vehicles, remains strong among affluent consumers.
Stringent environmental regulations and government incentives for electric vehicles are shaping the market. Policies to reduce carbon emissions encourage manufacturers to develop cleaner, more efficient luxury vehicles. For instance, in September 2023, Mercedes-Benz India Pvt. Ltd. launched an electric luxury SUV named EQE SUV in India. The SUV has an electric range of up to 465 to 550 Km on a single charge.
Global Luxury SUV Market Report Segmentation
The report forecasts revenue growth at global, regional, and country levels and provides an analysis of the latest industry trends in each of the sub-segments from 2018 to 2030. For this study, Grand View Research has segmented the global luxury SUV market based on vehicle type, propulsion type, and region:
- Vehicle Type Outlook (Revenue, USD Billion, 2018 - 2030)
- Compact
- Mid Size
- Full Size
- Propulsion Type Outlook (Revenue, USD Billion, 2018 - 2030)
- ICE
- Electric
- Regional Outlook (Revenue, USD Billion, 2018 - 2030)
- North America
U.S.
Canada
Mexico
- Europe
Germany
UK
France
- Asia Pacific
China
India
Japan
Australia
South Korea
- Latin America
Brazil
- Middle East & Africa
UAE
Kingdom of Saudi Arabia
South Africa
Table of Contents
Chapter 1. Methodology and Scope
- 1.1. Market Segmentation & Scope
- 1.2. Market Definitions
- 1.3. Information Procurement
- 1.4. Information Analysis
- 1.4.1. Market Formulation & Data Visualization
- 1.4.2. Data Validation & Publishing
- 1.5. Research Scope and Assumptions
- 1.6. List of Data Sources
Chapter 2. Executive Summary
- 2.1. Market Outlook
- 2.2. Segmental Outlook
- 2.3. Competitive Landscape Snapshot
Chapter 3. Market Variables, Trends, and Scope
- 3.1. Market Lineage Outlook
- 3.2. Industry Value Chain Analysis
- 3.3. Market Dynamics
- 3.3.1. Market Driver Impact Analysis
- 3.3.2. Market Restraint Impact Analysis
- 3.3.3. Market Opportunity Impact Analysis
- 3.4. Industry Analysis Tools
- 3.4.1. Porter's Analysis
- 3.4.2. PESTEL Analysis
Chapter 4. Luxury SUV Market: Vehicle Type Estimates & Trend Analysis
- 4.1. Vehicle Type Movement Analysis & Market Share, 2023 & 2030
- 4.2. Luxury SUV Market Estimates & Forecast, By Vehicle Type
- 4.2.1. Compact
- 4.2.2. Mid Size
- 4.2.3. Full Size
Chapter 5. Luxury SUV Market: Propulsion Type Estimates & Trend Analysis
- 5.1. Propulsion Type Movement Analysis & Market Share, 2023 & 2030
- 5.2. Luxury SUV Market Estimates & Forecast, By Propulsion Type
- 5.2.1. ICE
- 5.2.2. Electric
Chapter 6. Luxury SUV Market: Regional Estimates & Trend Analysis
- 6.1. Luxury SUV Market: Regional Outlook
- 6.2. North America
- 6.2.1. North America Hybrid Train market estimates & forecasts, 2018 - 2030 (USD Billion)
- 6.2.2. U.S.
- 6.2.2.1. U.S. Hybrid Train market estimates & forecasts, 2018 - 2030 (USD Billion)
- 6.2.3. Canada
- 6.2.3.1. Canada Hybrid Train market estimates & forecasts, 2018 - 2030 (USD Billion)
- 6.2.4. Mexico
- 6.2.4.1. Mexico Hybrid Train market estimates & forecasts, 2018 - 2030 (USD Billion)
- 6.3. Europe
- 6.3.1. Europe Hybrid Train market estimates & forecasts, 2018 - 2030 (USD Billion)
- 6.3.2. Germany
- 6.3.2.1. Germany Hybrid Train market estimates & forecasts, 2018 - 2030 (USD Billion)
- 6.3.3. UK
- 6.3.3.1. UK Hybrid Train market estimates & forecasts, 2018 - 2030 (USD Billion)
- 6.3.4. France
- 6.3.4.1. France Hybrid Train market estimates & forecasts, 2018 - 2030 (USD Billion)
- 6.4. Asia Pacific
- 6.4.1. Asia Pacific Hybrid Train market estimates & forecasts, 2018 - 2030 (USD Billion)
- 6.4.2. China
- 6.4.2.1. China Hybrid Train market estimates & forecasts, 2018 - 2030 (USD Billion)
- 6.4.3. India
- 6.4.3.1. India Hybrid Train market estimates & forecasts, 2018 - 2030 (USD Billion)
- 6.4.4. Japan
- 6.4.4.1. Japan Hybrid Train market estimates & forecasts, 2018 - 2030 (USD Billion)
- 6.4.5. Australia
- 6.4.5.1. Australia Hybrid Train market estimates & forecasts, 2018 - 2030 (USD Billion)
- 6.4.6. South Korea
- 6.4.6.1. South Korea Hybrid Train market estimates & forecasts, 2018 - 2030 (USD Billion)
- 6.5. Latin America
- 6.5.1. Latin America Hybrid Train market estimates & forecasts, 2018 - 2030 (USD Billion)
- 6.5.2. Brazil
- 6.5.2.1. Brazil Hybrid Train market estimates & forecasts, 2018 - 2030 (USD Billion)
- 6.6. MEA
- 6.6.1. MEA Hybrid Train market estimates & forecasts, 2018 - 2030 (USD Billion)
- 6.6.2. UAE
- 6.6.2.1. UAE Hybrid Train market estimates & forecasts, 2018 - 2030 (USD Billion)
- 6.6.3. Kingdom of Saudi Arabia (KSA)
- 6.6.3.1. Kingdom of Saudi Arabia (KSA) Hybrid Train market estimates & forecasts, 2018 - 2030 (USD Billion)
- 6.6.4. South Africa
- 6.6.4.1. South Africa Hybrid Train market estimates & forecasts, 2018 - 2030 (USD Billion)
Chapter 7. Competitive Landscape
- 7.1. Company Categorization
- 7.2. Financial Performance
- 7.3. Product Benchmarking
- 7.4. Company Market Share Analysis, 2023
- 7.5. Company Heat Map Analysis
- 7.6. Strategy Mapping
- 7.6.1. Expansion
- 7.6.2. Collaborations
- 7.6.3. Mergers & Acquisitions
- 7.6.4. New Speed Launches
- 7.6.5. Partnerships
- 7.6.6. Others
- 7.7. Company List
- 7.7.1. AB Volvo
- 7.7.2. Aston Martin Holdings UK Ltd
- 7.7.3. Bayerische Motoren Werke AG
- 7.7.4. General Motors
- 7.7.5. Isuzu Motors Ltd.
- 7.7.6. Mercedes-Benz Group AG
- 7.7.7. Nissan Motor Corporation
- 7.7.8. Tata Motors Limited
- 7.7.9. Toyota Motor Corporation
- 7.7.10. Volkswagen Group


