|
|
市場調査レポート
商品コード
1530296
ESG投資の市場規模、シェア、動向分析レポート:タイプ別、投資家タイプ別、用途別、地域別、セグメント予測、2024年~2030年ESG Investing Market Size, Share, & Trends Analysis Report By Type (ESG Integration, Impact Investing, Sustainable Funds, Green Bonds), By Investor Types, By Application, By Region, And Segment Forecasts, 2024 - 2030 |
||||||
|
|||||||
カスタマイズ可能
|
|||||||

| ESG投資の市場規模、シェア、動向分析レポート:タイプ別、投資家タイプ別、用途別、地域別、セグメント予測、2024年~2030年 |
|
出版日: 2024年07月17日
発行: Grand View Research
ページ情報: 英文 120 Pages
納期: 2~10営業日
|

全表示
- 概要
- 図表
- 目次
ESG投資の市場規模と動向
世界のESG投資市場規模は2023年に25兆1,000億米ドルと推計され、2024年から2030年にかけてCAGR18.8%で成長すると予測されています。過去10年間で、環境問題や社会問題に対する社会の意識は著しく高まっています。気候変動への抗議、自然災害、社会正義運動は、持続可能な実践の緊急の必要性を浮き彫りにしました。投資家は、自らの投資選択が世界に与える影響をより意識するようになっています。このような意識の高まりは、個人の価値観に合致し、環境の持続可能性と社会的公正に積極的に貢献する投資オプションを求める需要の高まりにつながった。
企業のESG慣行に関する情報の入手可能性は著しく向上しました。投資家は現在、企業の環境への影響、社会的イニシアティブ、ガバナンスの実践に関する洞察を提供する詳細なレポート、格付け、分析にアクセスすることができます。この透明性により、投資家はより多くの情報に基づいた意思決定を行い、自分の価値観に沿った投資を選択することができます。ESGデータプロバイダーや格付け機関の普及も、こうした情報の標準化や普及に重要な役割を果たしており、投資家は異なる企業やセクター間のESGパフォーマンスを比較・評価しやすくなっています。
目次
第1章 調査手法と範囲
第2章 エグゼクティブサマリー
第3章 ESG投資の変数、動向、範囲
- 市場イントロダクション/系統展望
- アプリケーションバリューチェーン分析
- 市場力学
- 市場促進要因分析
- 市場抑制要因分析
- 応募の機会
- ESG投資分析ツール
- ポーターの分析
- PESTEL分析
第4章 ESG投資:タイプ別推定・動向分析
- セグメントダッシュボード
- ESG投資:タイプ別変動分析、2023年および2030年
- ESG統合
- 市場規模の推定と予測、2018年-2030年
- インパクト投資
- 市場規模の推定と予測、2018年-2030年
- サステナブルファンド
- 市場規模の推定と予測、2018年-2030年
- グリーンボンド
- 市場規模の推定と予測、2018年-2030年
- その他
- 市場規模の推定と予測、2018年-2030年
第5章 ESG投資:投資家タイプ別推定・動向分析
- セグメントダッシュボード
- ESG投資:投資家タイプ別変動分析、2023年と2030年
- 機関投資家
- 市場規模の推定と予測、2018年-2030年
- 小口投資家
- 市場規模の推定と予測、2018年-2030年
- 企業投資家
- 市場規模の推定と予測、2018年-2030年
第6章 ESG投資:用途別推定・動向分析
- セグメントダッシュボード
- ESG投資の用途別シェア 2023年と2030年
- 環境
- 市場規模の推定と予測、2018年-2030年
- 社会的
- 市場推計・予測、2018年-2030年
- ガバナンス
- 市場推計・予測、2018年-2030年
- 統合ESG
- 市場推計・予測、2018年-2030年
第7章 ESG投資市場:地域別推定・動向分析
- ESG投資市場シェア、地域別、2023年および2030年
- 北米
- 市場推計・予測、2018年-2030年
- タイプ別、2018年-2030年
- 投資家タイプ別、2018年-2030年
- 用途別、2018年-2030年
- 米国
- カナダ
- メキシコ
- 欧州
- タイプ別、2018年-2030年
- 投資家タイプ別、2018年-2030年
- 用途別、2018年-2030年
- 英国
- ドイツ
- フランス
- アジア太平洋
- 市場推計・予測、2018年-2030年
- タイプ別、2018年-2030年
- 投資家タイプ別、2018年-2030年
- 用途別、2018年-2030年
- 中国
- インド
- 日本
- オーストラリア
- 韓国
- ラテンアメリカ
- 市場推計・予測、2018年-2030年
- タイプ別、2018年-2030年
- 投資家タイプ別、2018年-2030年
- 用途別、2018年-2030年
- ブラジル
- 中東・アフリカ
- 市場推計・予測、2018年-2030年
- タイプ別、2018年-2030年
- 投資家タイプ別、2018年-2030年
- 用途別、2018年-2030年
- アラブ首長国連邦
- サウジアラビア
- 南アフリカ
第8章 競合情勢
- 主要市場参入企業による最近の動向と影響分析
- 企業分類
- 企業の市場シェア分析
- 企業ヒートマップ分析
- 戦略マッピング
- 拡大
- 合併と買収
- パートナーシップとコラボレーション
- 新製品の発売
- 研究開発
- 企業プロファイル
- BlackRock
- BNP Paribas Asset Management
- Goldman Sachs Asset Management
- JP Morgan Asset Management
- Morgan Stanley Investment Management
- Northern Trust Asset Management
- PIMCO
- State Street Global Advisors
- UBS Group
- Vanguard Group
List of Tables
- Table 1 ESG Investing Market 2018 - 2030 (USD Trillion)
- Table 2 Global ESG investing market estimates and forecasts by region, 2018 - 2030 (USD Trillion)
- Table 3 Global ESG investing market estimates and forecasts by type, 2018 - 2030 (USD Trillion)
- Table 4 Global ESG investing market estimates and forecasts by investor types, (USD Trillion), 2018 - 2030
- Table 5 Global ESG investing market estimates and forecasts by application, 2018 - 2030 (USD Trillion)
- Table 6 Type market by region, 2018 - 2030 (USD Trillion)
- Table 7 ESG integration market by region, 2018 - 2030 (USD Trillion)
- Table 8 Impact investing market by region, 2018 - 2030 (USD Trillion)
- Table 9 Sustainable funds market by region, 2018 - 2030 (USD Trillion)
- Table 10 Green bonds market by region, 2018 - 2030 (USD Trillion)
- Table 11 Others market by region, 2018 - 2030 (USD Trillion)
- Table 12 Investor type market by region, 2018 - 2030 (USD Trillion)
- Table 13 Institutional investors market by region, 2018 - 2030 (USD Trillion)
- Table 14 Retail investors market by region, 2018 - 2030 (USD Trillion)
- Table 15 Corporate investors market by region, 2018 - 2030 (USD Trillion)
- Table 16 Application market by region, 2018 - 2030 (USD Trillion)
- Table 17 Environmental market by region, 2018 - 2030 (USD Trillion)
- Table 18 Social market by region, 2018 - 2030 (USD Trillion)
- Table 19 Governance market by region, 2018 - 2030 (USD Trillion)
- Table 20 Integrated ESG market by region, 2018 - 2030 (USD Trillion)
- Table 21 North America ESG investing market, by type, 2018 - 2030 (Market Value, USD Trillion)
- Table 22 North America ESG investing market, by investor types, 2018 - 2030 (Market Value, USD Trillion)
- Table 23 North America ESG investing market, by application, 2018 - 2030 (Market Value, USD Trillion)
- Table 24 U.S. ESG investing market, by type, 2018 - 2030 (Market Value, USD Trillion)
- Table 25 U.S. ESG investing market, by investor types, 2018 - 2030 (Market Value, USD Trillion)
- Table 26 U.S. ESG investing market, by application, 2018 - 2030 (Market Value, USD Trillion)
- Table 27 Canada ESG investing market, by type, 2018 - 2030 (Market Value, USD Trillion)
- Table 28 Canada ESG investing market, by investor types, 2018 - 2030 (Market Value, USD Trillion)
- Table 29 Canada ESG investing market, by application, 2018 - 2030 (Market Value, USD Trillion)
- Table 30 Mexico ESG investing market, by type, 2018 - 2030 (Market Value, USD Trillion)
- Table 31 Mexico ESG investing market, by investor types, 2018 - 2030 (Market Value, USD Trillion)
- Table 32 Mexico ESG investing market, by application, 2018 - 2030 (Market Value, USD Trillion)
- Table 33 Europe ESG investing market, by type, 2018 - 2030 (Market Value, USD Trillion)
- Table 34 Europe ESG investing market, by investor types, 2018 - 2030 (Market Value, USD Trillion)
- Table 35 Europe ESG investing market, by application, 2018 - 2030 (Market Value, USD Trillion)
- Table 36 U.K. ESG investing market, by type, 2018 - 2030 (Market Value, USD Trillion)
- Table 37 U.K. ESG investing market, by investor types, 2018 - 2030 (Market Value, USD Trillion)
- Table 38 U.K. ESG investing market, by application, 2018 - 2030 (Market Value, USD Trillion)
- Table 39 Germany ESG investing market, by type, 2018 - 2030 (Market Value, USD Trillion)
- Table 40 Germany ESG investing market, by investor types, 2018 - 2030 (Market Value, USD Trillion)
- Table 41 Germany ESG investing market, by application, 2018 - 2030 (Market Value, USD Trillion)
- Table 42 France ESG investing market, by type, 2018 - 2030 (Market Value, USD Trillion)
- Table 43 France ESG investing market, by investor types, 2018 - 2030 (Market Value, USD Trillion)
- Table 44 France ESG investing market, by application, 2018 - 2030 (Market Value, USD Trillion)
- Table 45 Asia Pacific ESG investing market, by type, 2018 - 2030 (Market Value, USD Trillion)
- Table 46 Asia Pacific ESG investing market, by investor types, 2018 - 2030 (Market Value, USD Trillion)
- Table 47 Asia Pacific ESG investing market, by application, 2018 - 2030 (Market Value, USD Trillion)
- Table 48 China ESG investing market, by type, 2018 - 2030 (Market Value, USD Trillion)
- Table 49 China ESG investing market, by investor types, 2018 - 2030 (Market Value, USD Trillion)
- Table 50 China ESG investing market, by application, 2018 - 2030 (Market Value, USD Trillion)
- Table 51 India ESG investing market, by type, 2018 - 2030 (Market Value, USD Trillion)
- Table 52 India ESG investing market, by investor types, 2018 - 2030 (Market Value, USD Trillion)
- Table 53 India ESG investing market, by application, 2018 - 2030 (Market Value, USD Trillion)
- Table 54 Japan ESG investing market, by type, 2018 - 2030 (Market Value, USD Trillion)
- Table 55 Japan ESG investing market, by investor types, 2018 - 2030 (Market Value, USD Trillion)
- Table 56 Japan ESG investing market, by application, 2018 - 2030 (Market Value, USD Trillion)
- Table 57 Australia ESG investing market, by type, 2018 - 2030 (Market Value, USD Trillion)
- Table 58 Australia ESG investing market, by investor types, 2018 - 2030 (Market Value, USD Trillion)
- Table 59 Australia ESG investing market, by application, 2018 - 2030 (Market Value, USD Trillion)
- Table 60 South Korea ESG investing market, by type, 2018 - 2030 (Market Value, USD Trillion)
- Table 61 South Korea ESG investing market, by investor types, 2018 - 2030 (Market Value, USD Trillion)
- Table 62 South Korea ESG investing market, by application, 2018 - 2030 (Market Value, USD Trillion)
- Table 63 Latin America ESG investing market, by type, 2018 - 2030 (Market Value, USD Trillion)
- Table 64 Latin America ESG investing market, by investor types, 2018 - 2030 (Market Value, USD Trillion)
- Table 65 Latin America ESG investing market, by application, 2018 - 2030 (Market Value, USD Trillion)
- Table 66 Brazil ESG investing market, by type, 2018 - 2030 (Market Value, USD Trillion)
- Table 67 Brazil ESG investing market, by investor types, 2018 - 2030 (Market Value, USD Trillion)
- Table 68 Brazil ESG investing market, by application, 2018 - 2030 (Market Value, USD Trillion)
- Table 69 MEA ESG investing market, by type, 2018 - 2030 (Market Value, USD Trillion)
- Table 70 MEA ESG investing market, by investor types, 2018 - 2030 (Market Value, USD Trillion)
- Table 71 MEA ESG investing market, by application, 2018 - 2030 (Market Value, USD Trillion)
- Table 72 UAE ESG investing market, by type, 2018 - 2030 (Market Value, USD Trillion)
- Table 73 UAE ESG investing market, by investor types, 2018 - 2030 (Market Value, USD Trillion)
- Table 74 UAE ESG investing market, by application, 2018 - 2030 (Market Value, USD Trillion)
- Table 75 Saudi Arabia ESG investing market, by type, 2018 - 2030 (Market Value, USD Trillion)
- Table 76 Saudi Arabia ESG investing market, by investor types, 2018 - 2030 (Market Value, USD Trillion)
- Table 77 Saudi Arabia ESG investing market, by application, 2018 - 2030 (Market Value, USD Trillion)
- Table 78 South Africa ESG investing market, by type, 2018 - 2030 (Market Value, USD Trillion)
- Table 79 South Africa ESG investing market, by investor types, 2018 - 2030 (Market Value, USD Trillion)
- Table 80 South Africa ESG investing market, by application, 2018 - 2030 (Market Value, USD Trillion)
List of Figures
- Fig. 1 ESG Investing Market Segmentation
- Fig. 2 Market landscape
- Fig. 3 Information Procurement
- Fig. 4 Data Analysis Models
- Fig. 5 Market Formulation and Validation
- Fig. 6 Data Validating & Publishing
- Fig. 7 Market Snapshot
- Fig. 8 Segment Snapshot (1/3)
- Fig. 9 Segment Snapshot (2/3)
- Fig. 10 Segment Snapshot (3/3)
- Fig. 11 Competitive Landscape Snapshot
- Fig. 12 ESG Investing: Value Chain Analysis
- Fig. 13 ESG Investing: Market Dynamics
- Fig. 14 ESG Investing: PORTER's Analysis
- Fig. 15 ESG Investing: PESTEL Analysis
- Fig. 16 ESG Investing Share By Type, 2023 & 2030 (USD Trillion)
- Fig. 17 ESG Investing, By Type: Market Share, 2023 & 2030
- Fig. 18 ESG Integration Market Estimates and Forecasts, 2018 - 2030 (Market Value, USD Trillion)
- Fig. 19 Impact Investing Market Estimates and Forecasts, 2018 - 2030 (Market Value, USD Trillion)
- Fig. 20 Sustainable Funds Market Estimates and Forecasts, 2018 - 2030 (Market Value, USD Trillion)
- Fig. 21 Green Bonds Market Estimates and Forecasts, 2018 - 2030 (Market Value, USD Trillion)
- Fig. 22 Others Market Estimates and Forecasts, 2018 - 2030 (Market Value, USD Trillion)
- Fig. 23 ESG Investing Share by Investor Types, 2023 & 2030 (USD Trillion)
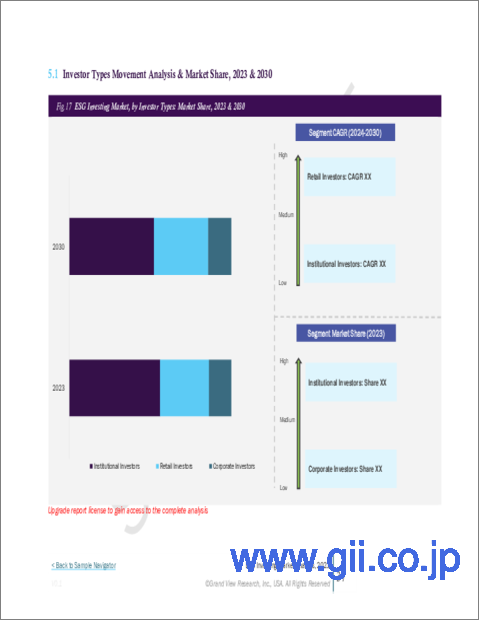
- Fig. 24 ESG Investing Market, by Investor Types: Market Share, 2023 & 2030
- Fig. 25 Institutional Investors Market Estimates and Forecasts, 2018 - 2030 (Market Value, USD Trillion)
- Fig. 26 Retail Investors Market Estimates and Forecasts, 2018 - 2030 (Market Value, USD Trillion)
- Fig. 27 Corporate Investors Estimates and Forecasts, 2018 - 2030 (Market Value, USD Trillion)
- Fig. 28 ESG Investing Share by Application, 2023 & 2030 (USD Trillion)
- Fig. 29 ESG Investing, by Application: Market Share, 2023 & 2030
- Fig. 30 Environmental Market Estimates and Forecasts, 2018 - 2030 (Market Value, USD Trillion)
- Fig. 31 Social Market Estimates and Forecasts, 2018 - 2030 (Market Value, USD Trillion)
- Fig. 32 Governance Market Estimates and Forecasts, 2018 - 2030 (Market Value, USD Trillion)
- Fig. 33 Integrated ESG Market Estimates and Forecasts, 2018 - 2030 (Market Value, USD Trillion)
- Fig. 34 Regional Market place: Key Takeaways
- Fig. 35 North America ESG Investing Market Estimates and Forecasts, 2018 - 2030 (USD Trillion)
- Fig. 36 U.S. ESG Investing Market Estimates and Forecasts, 2018 - 2030 (USD Trillion)
- Fig. 37 Canada ESG Investing Market Estimates and Forecasts, 2018 - 2030 (USD Trillion)
- Fig. 38 Mexico ESG Investing Market Estimates and Forecasts, 2018 - 2030 (USD Trillion)
- Fig. 39 Europe ESG Investing Market Estimates and Forecasts, 2018 - 2030 (USD Trillion)
- Fig. 40 UK ESG Investing Market Estimates and Forecasts, 2018 - 2030,) (USD Trillion)
- Fig. 41 Germany ESG Investing Market Estimates and Forecasts, 2018 - 2030 (USD Trillion)
- Fig. 42 France ESG Investing Market Estimates and Forecasts, 2018 - 2030 (USD Trillion)
- Fig. 43 Asia Pacific ESG Investing Market Estimates and Forecast, 2018 - 2030 (USD Trillion)
- Fig. 44 China ESG Investing Market Estimates and Forecasts, 2018 - 2030 (USD Trillion)
- Fig. 45 India ESG Investing Market Estimates and Forecasts, 2018 - 2030 (USD Trillion)
- Fig. 46 Japan ESG Investing Market Estimates and Forecasts, 2018 - 2030 (USD Trillion)
- Fig. 47 Australia ESG Investing Market Estimates and Forecasts, 2018 - 2030 (USD Trillion)
- Fig. 48 South Korea ESG Investing Market Estimates and Forecasts, 2018 - 2030 (USD Trillion)
- Fig. 49 Latin America ESG Investing Market Estimates and Forecasts, 2018 - 2030 (USD Trillion)
- Fig. 50 Brazil ESG Investing Market Estimates and Forecasts, 2018 - 2030 (USD Trillion)
- Fig. 51 Middle East & Africa ESG Investing Market Estimates and Forecasts, 2018 - 2030 (USD Trillion)
- Fig. 52 Saudi Arabia ESG Investing Market Estimates and Forecasts, 2018 - 2030 (USD Trillion)
- Fig. 53 UAE ESG Investing Market Estimates and Forecasts, 2018 - 2030 (USD Trillion)
- Fig. 54 South Africa ESG Investing Market Estimates and Forecasts, 2018 - 2030 (USD Trillion)
- Fig. 55 Key Company Categorization
- Fig. 56 Company Market Positioning
- Fig. 57 Key Company Market Share Analysis, 2023
- Fig. 58 Strategic Framework
ESG Investing Market Size & Trends
The global ESG investing market size was estimated at USD 25.10 trillion in 2023 and is projected to grow at a CAGR of 18.8% from 2024 to 2030. Over the past decade, there has been a significant increase in public awareness regarding environmental and social issues. Climate change protests, natural disasters, and social justice movements highlighted the urgent need for sustainable practices. Investors are becoming more conscious of their investment choices' impact on the world. This heightened awareness has translated into a greater demand for investment options that align with personal values and contribute positively to environmental sustainability and social equity.
The availability of information about companies' ESG practices has improved significantly. Investors can now access detailed reports, ratings, and analyses that provide insights into a company's environmental impact, social initiatives, and governance practices. This transparency enables investors to make more informed decisions and choose investments that align with their values. The proliferation of ESG data providers and rating agencies has also played a crucial role in standardizing and disseminating this information, making it easier for investors to compare and evaluate ESG performance across different companies and sectors.
Global ESG Investing Market Report Segmentation
This report forecasts market value growth at global, regional, and country levels and provides an analysis of the latest application trends in each of the sub-segments from 2018 to 2030. For this study, Grand View Research has segmented the global ESG investing market report based on type, investor types, application, and region.
- Type Outlook (Market Value, USD Trillion, 2018 - 2030)
- ESG Integration
- Impact Investing
- Sustainable Funds
- Green Bonds
- Others
- Investor Types Outlook (Market Value, USD Trillion, 2018 - 2030)
- Institutional Investors
- Retail Investors
- Corporate Investors
- Application Outlook (Market Value, USD Trillion, 2018 - 2030)
- Environmental
- Social
- Governance
- Integrated ESG
- Regional Outlook (Market Value, USD Trillion, 2018 - 2030)
- North America
U.S.
Canada
Mexico
- Europe
Germany
UK
France
- Asia Pacific
China
India
Japan
South Korea
Australia
- Latin America
Brazil
- Middle East & Africa
UAE
Saudi Arabia
South Africa
Table of Contents
Chapter 1. Methodology and Scope
- 1.1. Market Segmentation and Scope
- 1.2. Market Definitions
- 1.3. Research Methodology
- 1.3.1. Information Procurement
- 1.3.2. Information or Data Analysis
- 1.3.3. Market Formulation & Data Visualization
- 1.3.4. Data Validation & Publishing
- 1.4. Research Scope and Assumptions
- 1.4.1. List of Data Sources
Chapter 2. Executive Summary
- 2.1. Market Outlook
- 2.2. Segment Outlook
- 2.3. Competitive Insights
Chapter 3. ESG Investing Variables, Trends, & Scope
- 3.1. Market Introduction/Lineage Outlook
- 3.2. Application Value Chain Analysis
- 3.3. Market Dynamics
- 3.3.1. Market Drivers Analysis
- 3.3.2. Market Restraints Analysis
- 3.3.3. Application Opportunities
- 3.4. ESG Investing Analysis Tools
- 3.4.1. Porter's Analysis
- 3.4.1.1. Bargaining power of the suppliers
- 3.4.1.2. Bargaining power of the buyers
- 3.4.1.3. Threats of substitution
- 3.4.1.4. Threats from new entrants
- 3.4.1.5. Competitive rivalry
- 3.4.2. PESTEL Analysis
- 3.4.2.1. Political landscape
- 3.4.2.2. Economic and Social landscape
- 3.4.2.3. Technological landscape
- 3.4.2.4. Environmental landscape
- 3.4.2.5. Legal landscape
- 3.4.1. Porter's Analysis
Chapter 4. ESG Investing: Type Estimates & Trend Analysis
- 4.1. Segment Dashboard
- 4.2. ESG Investing: Type Movement Analysis, 2023 & 2030 (USD Trillion)
- 4.3. ESG Integration
- 4.3.1. Market size estimates and forecasts, 2018 - 2030 (USD Trillion)
- 4.4. Impact Investing
- 4.4.1. Market size estimates and forecasts, 2018 - 2030 (USD Trillion)
- 4.5. Sustainable Funds
- 4.5.1. Market size estimates and forecasts, 2018 - 2030 (USD Trillion)
- 4.6. Green Bonds
- 4.6.1. Market size estimates and forecasts, 2018 - 2030 (USD Trillion)
- 4.7. Others
- 4.7.1. Market size estimates and forecasts, 2018 - 2030 (USD Trillion)
Chapter 5. ESG Investing: Investor Types Estimates & Trend Analysis
- 5.1. Segment Dashboard
- 5.2. ESG Investing: Investor Types Movement Analysis, 2023 & 2030 (USD Trillion)
- 5.3. Institutional Investors
- 5.3.1. Market size estimates and forecasts, 2018 - 2030 (USD Trillion)
- 5.4. Retail Investors
- 5.4.1. Market size estimates and forecasts, 2018 - 2030 (USD Trillion)
- 5.5. Corporate Investors
- 5.5.1. Market size estimates and forecasts, 2018 - 2030 (USD Trillion)
Chapter 6. ESG Investing: Application Estimates & Trend Analysis
- 6.1. Segment Dashboard
- 6.2. ESG Investing Share by Application 2023 & 2030 (USD Trillion)
- 6.3. Environmental
- 6.3.1. Market size estimates and forecasts, 2018 - 2030 (USD Trillion)
- 6.4. Social
- 6.4.1. Market estimates and forecast, 2018 - 2030 (USD Trillion)
- 6.5. Governance
- 6.5.1. Market estimates and forecast, 2018 - 2030 (USD Trillion)
- 6.6. Integrated ESG
- 6.6.1. Market estimates and forecast, 2018 - 2030 (USD Trillion)
Chapter 7. ESG Investing Market: Regional Estimates & Trend Analysis
- 7.1. ESG Investing Market Share, By Region, 2023 & 2030 (USD Trillion)
- 7.2. North America
- 7.2.1. Market Estimates and Forecasts, 2018 - 2030 (USD Trillion)
- 7.2.2. Market estimates and forecast, by type, 2018 - 2030 (Market Value, USD Trillion)
- 7.2.3. Market estimates and forecast, by investor types, 2018 - 2030 (Market Value, USD Trillion)
- 7.2.4. Market estimates and forecast, by application, 2018 - 2030 (Market Value, USD Trillion)
- 7.2.5. U.S.
- 7.2.5.1. Market Estimates and Forecasts, 2018 - 2030 (USD Trillion)
- 7.2.5.2. Market estimates and forecast, by type, 2018 - 2030 (Market Value, USD Trillion)
- 7.2.5.3. Market estimates and forecast, by investor types, 2018 - 2030 (Market Value, USD Trillion)
- 7.2.5.4. Market estimates and forecast, by application, 2018 - 2030 (Market Value, USD Trillion)
- 7.2.6. Canada
- 7.2.6.1. Market Estimates and Forecasts, 2018 - 2030 (USD Trillion)
- 7.2.6.2. Market estimates and forecast, by type, 2018 - 2030 (Market Value, USD Trillion)
- 7.2.6.3. Market estimates and forecast, by investor types, 2018 - 2030 (Market Value, USD Trillion)
- 7.2.6.4. Market estimates and forecast, by application, 2018 - 2030 (Market Value, USD Trillion)
- 7.2.7. Mexico
- 7.2.7.1. Market Estimates and Forecasts, 2018 - 2030 (USD Trillion)
- 7.2.7.2. Market estimates and forecast, by type, 2018 - 2030 (Market Value, USD Trillion)
- 7.2.7.3. Market estimates and forecast, by investor types, 2018 - 2030 (Market Value, USD Trillion)
- 7.2.7.4. Market estimates and forecast, by application, 2018 - 2030 (Market Value, USD Trillion)
- 7.3. Europe
- 7.3.1. Market estimates and forecast, by type, 2018 - 2030 (Market Value, USD Trillion)
- 7.3.2. Market estimates and forecast, by investor types, 2018 - 2030 (Market Value, USD Trillion)
- 7.3.3. Market estimates and forecast, by application, 2018 - 2030 (Market Value, USD Trillion)
- 7.3.4. U.K.
- 7.3.4.1. Market Estimates and Forecasts, 2018 - 2030 (USD Trillion)
- 7.3.4.2. Market estimates and forecast, by type, 2018 - 2030 (Market Value, USD Trillion)
- 7.3.4.3. Market estimates and forecast, by investor types, 2018 - 2030 (Market Value, USD Trillion)
- 7.3.4.4. Market estimates and forecast, by application, 2018 - 2030 (Market Value, USD Trillion)
- 7.3.5. Germany
- 7.3.5.1. Market Estimates and Forecasts, 2018 - 2030 (USD Trillion)
- 7.3.5.2. Market estimates and forecast, by type, 2018 - 2030 (Market Value, USD Trillion)
- 7.3.5.3. Market estimates and forecast, by investor types, 2018 - 2030 (Market Value, USD Trillion)
- 7.3.5.4. Market estimates and forecast, by application, 2018 - 2030 (Market Value, USD Trillion)
- 7.3.6. France
- 7.3.6.1. Market Estimates and Forecasts, 2018 - 2030 (USD Trillion)
- 7.3.6.2. Market estimates and forecast, by type, 2018 - 2030 (Market Value, USD Trillion)
- 7.3.6.3. Market estimates and forecast, by investor types, 2018 - 2030 (Market Value, USD Trillion)
- 7.3.6.4. Market estimates and forecast, by application, 2018 - 2030 (Market Value, USD Trillion)
- 7.4. Asia Pacific
- 7.4.1. Market Estimates and Forecasts, 2018 - 2030 (USD Trillion)
- 7.4.2. Market estimates and forecast, by type, 2018 - 2030 (Market Value, USD Trillion)
- 7.4.3. Market estimates and forecast, by investor types, 2018 - 2030 (Market Value, USD Trillion)
- 7.4.4. Market estimates and forecast, by application, 2018 - 2030 (Market Value, USD Trillion)
- 7.4.5. China
- 7.4.5.1. Market Estimates and Forecasts, 2018 - 2030 (USD Trillion)
- 7.4.5.2. Market estimates and forecast, by type, 2018 - 2030 (Market Value, USD Trillion)
- 7.4.5.3. Market estimates and forecast, by investor types, 2018 - 2030 (Market Value, USD Trillion)
- 7.4.5.4. Market estimates and forecast, by application, 2018 - 2030 (Market Value, USD Trillion)
- 7.4.6. India
- 7.4.6.1. Market Estimates and Forecasts, 2018 - 2030 (USD Trillion)
- 7.4.6.2. Market estimates and forecast, by type, 2018 - 2030 (Market Value, USD Trillion)
- 7.4.6.3. Market estimates and forecast, by investor types, 2018 - 2030 (Market Value, USD Trillion)
- 7.4.6.4. Market estimates and forecast, by application, 2018 - 2030 (Market Value, USD Trillion)
- 7.4.7. Japan
- 7.4.7.1. Market Estimates and Forecasts, 2018 - 2030 (USD Trillion)
- 7.4.7.2. Market estimates and forecast, by type, 2018 - 2030 (Market Value, USD Trillion)
- 7.4.7.3. Market estimates and forecast, by investor types, 2018 - 2030 (Market Value, USD Trillion)
- 7.4.7.4. Market estimates and forecast, by application, 2018 - 2030 (Market Value, USD Trillion)
- 7.4.8. Australia
- 7.4.8.1. Market Estimates and Forecasts, 2018 - 2030 (USD Trillion)
- 7.4.8.2. Market estimates and forecast, by type, 2018 - 2030 (Market Value, USD Trillion)
- 7.4.8.3. Market estimates and forecast, by investor types, 2018 - 2030 (Market Value, USD Trillion)
- 7.4.8.4. Market estimates and forecast, by application, 2018 - 2030 (Market Value, USD Trillion)
- 7.4.9. South Korea
- 7.4.9.1. Market Estimates and Forecasts, 2018 - 2030 (USD Trillion)
- 7.4.9.2. Market estimates and forecast, by type, 2018 - 2030 (Market Value, USD Trillion)
- 7.4.9.3. Market estimates and forecast, by investor types, 2018 - 2030 (Market Value, USD Trillion)
- 7.4.9.4. Market estimates and forecast, by application, 2018 - 2030 (Market Value, USD Trillion)
- 7.5. Latin America
- 7.5.1. Market Estimates and Forecasts, 2018 - 2030 (USD Trillion)
- 7.5.2. Market estimates and forecast, by type, 2018 - 2030 (Market Value, USD Trillion)
- 7.5.3. Market estimates and forecast, by investor types, 2018 - 2030 (Market Value, USD Trillion)
- 7.5.4. Market estimates and forecast, by application, 2018 - 2030 (Market Value, USD Trillion)
- 7.5.5. Brazil
- 7.5.5.1. Market Estimates and Forecasts, 2018 - 2030 (USD Trillion)
- 7.5.5.2. Market estimates and forecast, by type, 2018 - 2030 (Market Value, USD Trillion)
- 7.5.5.3. Market estimates and forecast, by investor types, 2018 - 2030 (Market Value, USD Trillion)
- 7.5.5.4. Market estimates and forecast, by application, 2018 - 2030 (Market Value, USD Trillion)
- 7.6. Middle East & Africa
- 7.6.1. Market Estimates and Forecasts, 2018 - 2030 (USD Trillion)
- 7.6.2. Market estimates and forecast, by type, 2018 - 2030 (Market Value, USD Trillion)
- 7.6.3. Market estimates and forecast, by investor types, 2018 - 2030 (Market Value, USD Trillion)
- 7.6.4. Market estimates and forecast, by application, 2018 - 2030 (Market Value, USD Trillion)
- 7.6.5. UAE
- 7.6.5.1. Market Estimates and Forecasts, 2018 - 2030 (USD Trillion)
- 7.6.5.2. Market estimates and forecast, by type, 2018 - 2030 (Market Value, USD Trillion)
- 7.6.5.3. Market estimates and forecast, by investor types, 2018 - 2030 (Market Value, USD Trillion)
- 7.6.5.4. Market estimates and forecast, by application, 2018 - 2030 (Market Value, USD Trillion)
- 7.6.6. Saudi Arabia
- 7.6.6.1. Market Estimates and Forecasts, 2018 - 2030 (USD Trillion)
- 7.6.6.2. Market estimates and forecast, by type, 2018 - 2030 (Market Value, USD Trillion)
- 7.6.6.3. Market estimates and forecast, by investor types, 2018 - 2030 (Market Value, USD Trillion)
- 7.6.6.4. Market estimates and forecast, by application, 2018 - 2030 (Market Value, USD Trillion)
- 7.6.7. South Africa
- 7.6.7.1. Market Estimates and Forecasts, 2018 - 2030 (USD Trillion)
- 7.6.7.2. Market estimates and forecast, by type, 2018 - 2030 (Market Value, USD Trillion)
- 7.6.7.3. Market estimates and forecast, by investor types, 2018 - 2030 (Market Value, USD Trillion)
- 7.6.7.4. Market estimates and forecast, by application, 2018 - 2030 (Market Value, USD Trillion)
Chapter 8. Competitive Landscape
- 8.1. Recent Developments & Impact Analysis by Key Market Participants
- 8.2. Company Categorization
- 8.3. Company Market Share Analysis
- 8.4. Company Heat Map Analysis
- 8.5. Strategy Mapping
- 8.5.1. Expansion
- 8.5.2. Mergers & Acquisition
- 8.5.3. Partnerships & Collaborations
- 8.5.4. New Product Launches
- 8.5.5. Research And Development
- 8.6. Company Profiles
- 8.6.1. BlackRock
- 8.6.1.1. Participant's Overview
- 8.6.1.2. Financial Performance
- 8.6.1.3. Product Benchmarking
- 8.6.1.4. Recent Developments
- 8.6.2. BNP Paribas Asset Management
- 8.6.2.1. Participant's Overview
- 8.6.2.2. Financial Performance
- 8.6.2.3. Product Benchmarking
- 8.6.2.4. Recent Developments
- 8.6.3. Goldman Sachs Asset Management
- 8.6.3.1. Participant's Overview
- 8.6.3.2. Financial Performance
- 8.6.3.3. Product Benchmarking
- 8.6.3.4. Recent Developments
- 8.6.4. J.P. Morgan Asset Management
- 8.6.4.1. Participant's Overview
- 8.6.4.2. Financial Performance
- 8.6.4.3. Product Benchmarking
- 8.6.4.4. Recent Developments
- 8.6.5. Morgan Stanley Investment Management
- 8.6.5.1. Participant's Overview
- 8.6.5.2. Financial Performance
- 8.6.5.3. Product Benchmarking
- 8.6.5.4. Recent Developments
- 8.6.6. Northern Trust Asset Management
- 8.6.6.1. Participant's Overview
- 8.6.6.2. Financial Performance
- 8.6.6.3. Product Benchmarking
- 8.6.6.4. Recent Developments
- 8.6.7. PIMCO
- 8.6.7.1. Participant's Overview
- 8.6.7.2. Financial Performance
- 8.6.7.3. Product Benchmarking
- 8.6.7.4. Recent Developments
- 8.6.8. State Street Global Advisors
- 8.6.8.1. Participant's Overview
- 8.6.8.2. Financial Performance
- 8.6.8.3. Product Benchmarking
- 8.6.8.4. Recent Developments
- 8.6.9. UBS Group
- 8.6.9.1. Participant's Overview
- 8.6.9.2. Financial Performance
- 8.6.9.3. Product Benchmarking
- 8.6.9.4. Recent Developments
- 8.6.10. Vanguard Group
- 8.6.10.1. Participant's Overview
- 8.6.10.2. Financial Performance
- 8.6.10.3. Product Benchmarking
- 8.6.10.4. Recent Developments
- 8.6.1. BlackRock
