|
|
市場調査レポート
商品コード
1529718
歯磨きタブレットの市場規模、シェア、動向分析レポート:製品別、流通チャネル別、地域別、セグメント予測、2024年~2030年Toothpaste Tablet Market Size, Share & Trends Analysis Report By Product (Fluoride-based, Fluoride Free), By Distribution Channel, By Region, And Segment Forecasts, 2024 - 2030 |
||||||
|
|||||||
カスタマイズ可能
|
|||||||

| 歯磨きタブレットの市場規模、シェア、動向分析レポート:製品別、流通チャネル別、地域別、セグメント予測、2024年~2030年 |
|
出版日: 2024年07月09日
発行: Grand View Research
ページ情報: 英文 145 Pages
納期: 2~10営業日
|

全表示
- 概要
- 図表
- 目次
歯磨きタブレット市場の成長と動向:
Grand View Research, Inc.の最新レポートによると、世界の歯磨きタブレット市場規模は2030年までに1億1,830万米ドルに達し、CAGRは8.2%になると予測されています。
歯磨きタブレットの採用は、その利便性、環境への優しさ、携帯性により、特に若い世代で増加傾向にあります。特にミレニアル世代は、持続可能で自然な製品への関心が高まっており、これが歯磨きタブレット市場の成長に寄与しています。
環境意識の高い消費者の増加も、歯磨きタブレットの需要を促進しています。プラスチック廃棄物が環境に与える影響に対する意識が高まるにつれ、人々は従来の歯磨きチューブに代わるものを求めるようになっています。多くの場合、生分解性またはリサイクル可能な材料で包装されている歯磨きタブレットは、従来の歯磨き粉に代わる環境に優しい選択肢を提供します。
デジタル化の動向は歯磨きタブレット市場に大きな影響を与えており、企業はオンライン小売プラットフォームを活用することで、より幅広い顧客層にアプローチしています。この変化により、メーカーは歯磨きタブレットに関する消費者の認知度を高め、売上高の急増につながっています。市場の新たな動向として、eコマースによる定期購入モデルがあります。DENTTABSのような企業は、歯磨きタブレットの定期供給を顧客に提供することで、このアプローチを活用しています。
メーカーにとってのメリットに加え、定期購入モデルは消費者にとってもメリットがあります。顧客は、頻繁に店舗に出向く必要がなく、玄関先まで直接歯磨き粉が届くという利便性を享受できます。このモデルは、特に忙しい個人にとって魅力的であり、必要不可欠な製品を定期的に手元に供給できる手軽さを重視します。
さらに、クリーンラベルやナチュラルなオーラルケア製品に対する需要の高まりから、ナチュラルでオーガニックな選択肢を提供するタブレット型歯磨き粉ブランドが急増しています。このような動向は、消費者が従来の歯磨き粉に代わる、環境に優しく持続可能なものを求めるようになっていることから、歯磨きタブレット市場の成長に寄与しています。歯磨きタブレットに天然成分を使用することは、健康志向の消費者にアピールするだけでなく、環境に優しい製品を求める消費者にもアピールします。天然成分やオーガニック成分を使用した歯磨き粉を選ぶことで、消費者は環境フットプリントを減らし、持続可能な活動を支援することができます。このような天然成分やオーガニック成分配合の歯磨き粉への嗜好の高まりは、より多くのブランドの市場参入を促し、業界における競合の激化と技術革新につながっています。消費者がオーラルケア製品において持続可能性と天然成分を優先する傾向が続いているため、市場の成長は今後も続くと予想されます。
歯磨きタブレット市場レポートハイライト
- フッ素ベースのセグメントは2023年に68.0%の売上シェアを占めました。このセグメントの優位性は、米国歯科医師会(ADA)がフッ化物を含む歯科用洗浄製品にのみ承認シールを付与するという慣行によって強調されており、それによって消費者の間で広く採用され、受け入れられるようになっています。このような規制による承認とフッ素の虫歯予防効果が証明されたことで、フッ素入り歯磨き粉の市場支配力は確固たるものとなった。
- オンラインストアのセグメントは、2023年に49.1%以上の最大の収益シェアを占めました。このセグメントの優位性は、消費者がオーラルケアのニーズをeコマース・プラットフォームに依存する傾向が強まっていることの証左です。オンラインストアが提供する利便性、多様性、競争力のある価格設定は、デンタルケアの消費パターンに大きな影響を与え、業界に新たな基準を打ち立てた。
- Unpaste(Avespan, LLC)を含む歯磨きタブレットメーカーは、百貨店に有利な市場を見出しており、同社の製品は米国内の約200店舗で販売されています。この流通戦略は、百貨店が提供する利便性と多様性を利用したもので、百貨店はオーラルケア製品を求める消費者にとって好ましい買い物先となっています。
- 2023年には、北米が約38.8%の市場シェアを占め、便利で持続可能なオーラルケア製品の需要を牽引しました。この成長は、革新的で環境に優しい歯磨きタブレットが人気を集めている米国が世界市場で大きなシェアを占めていることに起因しています。ミニマリストパッケージの魅力、健康志向の消費者の嗜好、オンライン販売チャネルや歯科専門家とのコラボレーションの可能性が、この地域の市場支配に貢献しています。
目次
第1章 調査手法と範囲
第2章 エグゼクティブサマリー
第3章 世界の歯磨きタブレット市場の変数、動向、範囲
- 市場系統の見通し
- 親市場の見通し
- 関連/付随市場の見通し
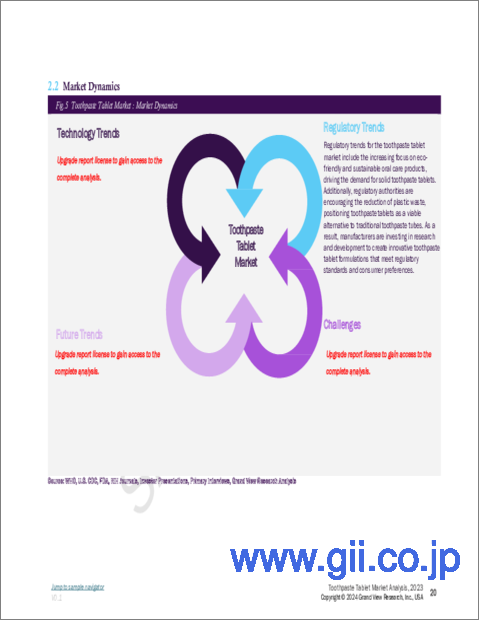
- 市場力学
- 市場牽引要因分析
- 市場抑制要因分析
- 歯磨きタブレット市場分析ツール
- 業界分析- ポーターのファイブフォース分析
- PESTEL分析
第4章 世界の歯磨きタブレット市場:製品別推定・動向分析
- 歯磨きタブレット市場:製品別ダッシュボード
- 歯磨きタブレット市場:製品別変動分析
- 歯磨きタブレット市場の規模と予測および動向分析、製品別、2018~2030年
- フッ素ベース
- フッ素フリー
第5章 世界の歯磨きタブレット市場:流通チャネル別推定・動向分析
- 歯磨きタブレット市場:流通チャネル別ダッシュボード
- 歯磨きタブレット市場:流通チャネル別変動分析
- 歯磨きタブレット市場の規模と予測および動向分析、流通チャネル別、2018~2030年
- スーパーマーケットとハイパーマーケット
- 薬局・ドラッグストア
- オンラインストア
- その他
第6章 世界の歯磨きタブレット市場:国、製品、流通チャネルの地域別推定・動向分析
- 歯磨きタブレット市場:地域別ダッシュボード
- 市場規模と予測動向分析、2018年から2030年
- 北米
- 欧州
- アジア太平洋
- ラテンアメリカ
- 中東・アフリカ
第7章 競合情勢
- 企業/競合の分類
- 市況分析
- 主要企業の市場シェア分析、2023年
- ヒートマップ分析
- 企業プロファイル
- Toothpaste India
- Archtek
- Colgate-Palmolive Company
- The Humble Co.
- Hcp Wellness
- Denttabs
- Germanics
- Parla Toothpaste Tablets
- Dental Lace
- Kaylaan Llc
- Huppy
- Nelson Naturals Inc
List of Tables
- Table 1 List of Secondary Sources
- Table 2 List of Abbreviations
- Table 3 Global toothpaste tablet market, by product, 2018 - 2030 (USD Million)
- Table 4 Global toothpaste tablet market, by distribution channel, 2018 - 2030 (USD Million)
- Table 5 North America toothpaste tablet market, by region, 2018 - 2030 (USD Million)
- Table 6 North America toothpaste tablet market, by product, 2018 - 2030 (USD Million)
- Table 7 North America toothpaste tablet market, by distribution channel, 2018 - 2030 (USD Million)
- Table 8 U.S toothpaste tablet market, by product, 2018 - 2030 (USD Million)
- Table 9 U.S toothpaste tablet market, by distribution channel, 2018 - 2030 (USD Million)
- Table 10 Canada toothpaste tablet market, by product, 2018 - 2030 (USD Million)
- Table 11 Canada toothpaste tablet market, by distribution channel, 2018 - 2030 (USD Million)
- Table 12 Europe toothpaste tablet market, by country, 2018 - 2030 (USD Million)
- Table 13 Europe toothpaste tablet market, by product, 2018 - 2030 (USD Million)
- Table 14 Europe toothpaste tablet market, by distribution channel, 2018 - 2030 (USD Million)
- Table 15 UK toothpaste tablet market, by product, 2018 - 2030 (USD Million)
- Table 16 UK toothpaste tablet market, by distribution channel, 2018 - 2030 (USD Million)
- Table 17 Germany toothpaste tablet market, by product, 2018 - 2030 (USD Million)
- Table 18 Germany toothpaste tablet market, by distribution channel, 2018 - 2030 (USD Million)
- Table 19 France toothpaste tablet market, by product, 2018 - 2030 (USD Million)
- Table 20 France toothpaste tablet market, by distribution channel, 2018 - 2030 (USD Million)
- Table 21 Italy toothpaste tablet market, by product, 2018 - 2030 (USD Million)
- Table 22 Italy toothpaste tablet market, by distribution channel, 2018 - 2030 (USD Million)
- Table 23 Spain toothpaste tablet market, by product, 2018 - 2030 (USD Million)
- Table 24 Spain toothpaste tablet market, by distribution channel, 2018 - 2030 (USD Million)
- Table 25 Norway toothpaste tablet market, by product, 2018 - 2030 (USD Million)
- Table 26 Norway toothpaste tablet market, by distribution channel, 2018 - 2030 (USD Million)
- Table 27 Sweden toothpaste tablet market, by product, 2018 - 2030 (USD Million)
- Table 28 Sweden toothpaste tablet market, by distribution channel, 2018 - 2030 (USD Million)
- Table 29 Denmark toothpaste tablet market, by product, 2018 - 2030 (USD Million)
- Table 30 Denmark toothpaste tablet market, by distribution channel, 2018 - 2030 (USD Million)
- Table 31 Asia Pacific toothpaste tablet market, by country, 2018 - 2030 (USD Million)
- Table 32 Asia Pacific toothpaste tablet market, by product, 2018 - 2030 (USD Million)
- Table 33 Asia Pacific toothpaste tablet market, by distribution channel, 2018 - 2030 (USD Million)
- Table 34 Japan toothpaste tablet market, by product, 2018 - 2030 (USD Million)
- Table 35 Japan toothpaste tablet market, by distribution channel, 2018 - 2030 (USD Million)
- Table 36 China toothpaste tablet market, by product, 2018 - 2030 (USD Million)
- Table 37 China toothpaste tablet market, by distribution channel, 2018 - 2030 (USD Million)
- Table 38 India toothpaste tablet market, by product, 2018 - 2030 (USD Million)
- Table 39 India toothpaste tablet market, by distribution channel, 2018 - 2030 (USD Million)
- Table 40 Australia toothpaste tablet market, by product, 2018 - 2030 (USD Million)
- Table 41 Australia toothpaste tablet market, by distribution channel, 2018 - 2030 (USD Million)
- Table 42 South Korea toothpaste tablet market, by product, 2018 - 2030 (USD Million)
- Table 43 South Korea toothpaste tablet market, by distribution channel, 2018 - 2030 (USD Million)
- Table 44 Thailand toothpaste tablet market, by product, 2018 - 2030 (USD Million)
- Table 45 Thailand toothpaste tablet market, by distribution channel, 2018 - 2030 (USD Million)
- Table 46 Latin America toothpaste tablet market, by country, 2018 - 2030 (USD Million)
- Table 47 Latin America toothpaste tablet market, by product, 2018 - 2030 (USD Million)
- Table 48 Latin America toothpaste tablet market, by distribution channel, 2018 - 2030 (USD Million)
- Table 49 Brazil toothpaste tablet market, by product, 2018 - 2030 (USD Million)
- Table 50 Brazil toothpaste tablet market, by distribution channel, 2018 - 2030 (USD Million)
- Table 51 Mexico toothpaste tablet market, by product, 2018 - 2030 (USD Million)
- Table 52 Mexico toothpaste tablet market, by distribution channel, 2018 - 2030 (USD Million)
- Table 53 Argentina toothpaste tablet market, by product, 2018 - 2030 (USD Million)
- Table 54 Argentina toothpaste tablet market, by distribution channel, 2018 - 2030 (USD Million)
- Table 55 Middle East & Africa toothpaste tablet market, by country, 2018 - 2030 (USD Million)
- Table 56 Middle East & Africa toothpaste tablet market, by product, 2018 - 2030 (USD Million)
- Table 57 Middle East & Africa toothpaste tablet market, by distribution channel, 2018 - 2030 (USD Million)
- Table 58 South Africa toothpaste tablet market, by product, 2018 - 2030 (USD Million)
- Table 59 South Africa toothpaste tablet market, by distribution channel, 2018 - 2030 (USD Million)
- Table 60 Saudi Arabia toothpaste tablet market, by product, 2018 - 2030 (USD Million)
- Table 61 Saudi Arabia toothpaste tablet market, by distribution channel, 2018 - 2030 (USD Million)
- Table 62 UAE toothpaste tablet market, by product, 2018 - 2030 (USD Million)
- Table 63 UAE toothpaste tablet market, by distribution channel, 2018 - 2030 (USD Million)
- Table 64 Kuwait toothpaste tablet market, by product, 2018 - 2030 (USD Million)
- Table 65 Kuwait toothpaste tablet market, by distribution channel, 2018 - 2030 (USD Million)
List of Figures
- Fig. 1 Market research process
- Fig. 2 Information procurement
- Fig. 3 Primary research pattern
- Fig. 4 Market research approaches
- Fig. 5 QFD modelling for market share assessment
- Fig. 6 Market formulation & validation
- Fig. 7 Market outlook
- Fig. 8 Toothpaste tablet market segmentation
- Fig. 9 Penetration & growth prospect mapping
- Fig. 10 Market trends & outlook
- Fig. 11 Market driver relevance analysis (Current & future impact)
- Fig. 12 Market restraint relevance analysis (Current & future impact)
- Fig. 13 Toothpaste tablet market product market share analysis, 2023 & 2030
- Fig. 14 Toothpaste tablet market product market: Product Segment dashboard
- Fig. 15 Fluoride based market, 2018 - 2030 (USD Million)
- Fig. 16 Fluoride free, 2018 - 2030 (USD Million)
- Fig. 17 Toothpaste tablet market by distribution channel market share analysis, 2023 & 2030
- Fig. 18 Toothpaste tablet market by distribution channel market: Segment dashboard
- Fig. 19 Supermarket /Hypermarket, 2018 - 2030 (USD Million)
- Fig. 20 Pharmacy & Drug stores, 2018 - 2030 (USD Million)
- Fig. 21 Online Stores, 2018 - 2030 (USD Million)
- Fig. 22 Others, 2018 - 2030 (USD Million)
- Fig. 23 Toothpaste tablet market by regional market share analysis, 2023 & 2030
- Fig. 24 Toothpaste tablet market: Regional dashboard
- Fig. 25 Regional marketplace: Key takeaways
- Fig. 26 North America toothpaste tablet market, 2018 - 2030 (USD Million)
- Fig. 27 U.S toothpaste tablet market, 2018 - 2030 (USD Million)
- Fig. 28 Canada toothpaste tablet market, 2018 - 2030 (USD Million)
- Fig. 29 Europe toothpaste tablet market, 2018 - 2030 (USD Million)
- Fig. 30 UK toothpaste tablet market, 2018 - 2030 (USD Million)
- Fig. 31 France toothpaste tablet market, 2018 - 2030 (USD Million)
- Fig. 32 Germany toothpaste tablet market, 2018 - 2030 (USD Million)
- Fig. 33 Italy toothpaste tablet market, 2018 - 2030 (USD Million)
- Fig. 34 Spain toothpaste tablet market, 2018 - 2030 (USD Million)
- Fig. 35 Denmark toothpaste tablet market, 2018 - 2030 (USD Million)
- Fig. 36 Norway toothpaste tablet market, 2018 - 2030 (USD Million)
- Fig. 37 Sweden toothpaste tablet market, 2018 - 2030 (USD Million)
- Fig. 38 Asia Pacific toothpaste tablet market, 2018 - 2030 (USD Million)
- Fig. 39 Japan toothpaste tablet market, 2018 - 2030 (USD Million)
- Fig. 40 China toothpaste tablet market, 2018 - 2030 (USD Million)
- Fig. 41 India toothpaste tablet market, 2018 - 2030 (USD Million)
- Fig. 42 Australia toothpaste tablet market, 2018 - 2030 (USD Million)
- Fig. 43 South Korea toothpaste tablet market, 2018 - 2030 (USD Million)
- Fig. 44 Thailand toothpaste tablet market, 2018 - 2030 (USD Million)
- Fig. 45 Latin America toothpaste tablet market, 2018 - 2030 (USD Million)
- Fig. 46 Brazil toothpaste tablet market, 2018 - 2030 (USD Million)
- Fig. 47 Mexico toothpaste tablet market, 2018 - 2030 (USD Million)
- Fig. 48 Argentina toothpaste tablet market, 2018 - 2030 (USD Million)
- Fig. 49 MEA toothpaste tablet market, 2018 - 2030 (USD Million)
- Fig. 50 Saudi Arabia toothpaste tablet market, 2018 - 2030 (USD Million)
- Fig. 51 South Africa toothpaste tablet market, 2018 - 2030 (USD Million)
- Fig. 52 UAE toothpaste tablet market, 2018 - 2030 (USD Million)
- Fig. 53 Kuwait toothpaste tablet market, 2018 - 2030 (USD Million)
- Fig. 54 Company market position analysis
Toothpaste Tablet Market Growth & Trends:
The global toothpaste tablet market size is expected to reach USD 118.3 million by 2030, exhibiting a CAGR of 8.2%, based on a new report by Grand View Research, Inc. The adoption of toothpaste tablets has been on the rise, particularly among younger generations, due to their convenience, eco-friendliness, and portability. Millennials, in particular, have shown a growing interest in sustainable and natural products, which has contributed to the growth of the toothpaste tablet market.
The growing number of environment-conscious consumers is also driving the demand for toothpaste tablets. As people become more aware of the environmental impact of plastic waste, they are looking for alternatives to traditional toothpaste tubes. Toothpaste tablets, which are often packaged in biodegradable or recyclable materials, offer an eco-friendly alternative to traditional toothpaste.
The increasing trend of digitalization has significantly impacted the toothpaste tablet market, with companies leveraging online retail platforms to reach a wider customer base. This shift has allowed manufacturers to increase consumer awareness about toothpaste tablets, leading to a surge in sales. An emerging trend in the market is the e-commerce subscription model. Companies like DENTTABS are taking advantage of this approach by providing customers with a regular supply of toothpaste tablets, which not only helps to increase sales but also fosters customer loyalty.
In addition to the benefits for manufacturers, the subscription model also offers advantages for consumers. Customers can enjoy the convenience of having toothpaste tablets delivered directly to their doorstep, without the need for frequent trips to the store. This model is particularly appealing to busy individuals, who value the ease of having a regular supply of essential products at their fingertips.
Moreover, the rising demand for clean-label and natural oral care products has led to a surge in the number of toothpaste tablet brands offering natural and organic options. This trend has contributed to the growth of the toothpaste tablet market, as consumers increasingly seek out eco-friendly and sustainable alternatives to traditional toothpaste. The use of natural ingredients in toothpaste tablet not only appeals to health-conscious consumers but also to those looking for environmentally friendly products. By choosing toothpaste tablets with natural and organic ingredients, consumers can reduce their environmental footprint and support sustainable practices. This growing preference for natural and organic toothpaste tablets has encouraged more brands to enter the market, leading to increased competition and innovation in the industry. The resulting market growth is expected to continue as consumers continue to prioritize sustainability and natural ingredients in their oral care products.
Toothpaste Tablet Market Report Highlights:
- The fluoride-based segment accounted for a revenue share of 68.0% in 2023. This segment's prominence is underscored by the American Dental Association's (ADA) practice of only granting the Seal of Acceptance to dental cleansing products containing fluoride, thereby ensuring its widespread adoption and acceptance among consumers. This regulatory endorsement, coupled with the fluoride's proven efficacy in preventing tooth decay, has solidified the fluoride-based toothpaste's market dominance.
- The online stores segment held the largest revenue share of over 49.1% in 2023. This segment's prominence is a testament to the growing trend of consumers increasingly relying on e-commerce platforms for their oral care needs. The convenience, variety, and competitive pricing offered by online stores have significantly influenced dental care consumption patterns, setting new standards in the industry.
- Toothpaste tablet manufacturers, including Unpaste (Avespan, LLC), have found a favorable market in department stores, where their products are available in approximately 200 stores across the U.S. This distribution strategy capitalizes on the convenience and variety offered by department stores, making them a preferred shopping destination for consumers seeking oral care products.
- In 2023, North America led the market share of nearly 38.8%, the demand for convenient and sustainable oral care products. This growth is attributed to the U.S. significant share of the global market, where innovative and eco-friendly toothpaste tablets are gaining popularity. The appeal of minimalist packaging, health-conscious consumer preferences, and the potential for online sales channels and collaborations with dental professionals contribute to the region's market dominance.
Table of Contents
Chapter 1. Methodology and Scope
- 1.1. Market Segmentation & Scope
- 1.2. Segment Definitions
- 1.2.1. Product
- 1.2.2. Distribution channel
- 1.2.3. Regional scope
- 1.2.4. Estimates and forecast timeline.
- 1.3. Research Methodology
- 1.4. Information Procurement
- 1.4.1. Purchased database
- 1.4.2. GVR's internal database
- 1.4.3. Secondary sources
- 1.4.4. Primary research
- 1.4.5. Details of primary research
- 1.5. Information or Data Analysis
- 1.5.1. Data analysis models
- 1.6. Market Formulation & Validation
- 1.7. Model Details
- 1.7.1. Commodity flow approach
- 1.8. List of Secondary Sources
- 1.9. List of Primary Sources
- 1.10. Objectives
Chapter 2. Executive Summary
- 2.1. Market Outlook
- 2.2. Segment Outlook
- 2.2.1. Product Segment
- 2.2.2. Distribution Channel Segment
- 2.2.3. Regional Outlook
- 2.3. Competitive Insights
Chapter 3. Global Toothpaste Tablet Market Variables, Trends & Scope
- 3.1. Market Lineage Outlook
- 3.1.1. Parent market outlook
- 3.1.2. Related/ancillary market outlook
- 3.2. Market Dynamics
- 3.2.1. Market driver analysis
- 3.2.2. Market restraint analysis
- 3.3. Toothpaste Tablet Market Analysis Tools
- 3.3.1. Industry Analysis - Porter's Five Forces
- 3.3.1.1. Supplier power
- 3.3.1.2. Buyer power
- 3.3.1.3. Substitution threat
- 3.3.1.4. Threat of new entrant
- 3.3.1.5. Competitive rivalry
- 3.3.2. PESTEL Analysis
- 3.3.2.1. Political landscape
- 3.3.2.2. Technological landscape
- 3.3.2.3. Economic landscape
- 3.3.1. Industry Analysis - Porter's Five Forces
Chapter 4. Global Toothpaste Tablet Market: Product Estimates & Trend Analysis
- 4.1. Toothpaste Tablet Market: Product Dashboard
- 4.2. Toothpaste Tablet Market: Product Movement Analysis
- 4.3. Toothpaste Tablet Market Size & Forecasts and Trend Analysis, by Product, 2018 to 2030 (USD Million)
- 4.4. Fluoride Based
- 4.4.1. Market estimates and forecast 2018 to 2030 (USD Million)
- 4.5. Fluoride-Free
- 4.5.1. Market estimates and forecast 2018 to 2030 (USD Million)
Chapter 5. Global Toothpaste Tablet Market: Distribution Channel Estimates & Trend Analysis
- 5.1. Toothpaste Tablet Market: Distribution Channel Dashboard
- 5.2. Toothpaste Tablet Market: Distribution Channel Movement Analysis
- 5.3. Toothpaste Tablet Market Size & Forecasts and Trend Analysis, by Distribution Channel, 2018 to 2030 (USD Million)
- 5.4. Supermarkets & Hypermarkets
- 5.4.1. Market estimates and forecast 2018 to 2030 (USD Million)
- 5.5. Pharmacy & Drug Stores
- 5.5.1. Market estimates and forecast 2018 to 2030 (USD Million)
- 5.6. Online Stores
- 5.6.1. Market estimates and forecast 2018 to 2030 (USD Million)
- 5.7. Others
- 5.7.1. Market estimates and forecast 2018 to 2030 (USD Million)
Chapter 6. Global Toothpaste Tablet Market: Regional Estimates & Trend Analysis by Country, Product, and Distribution Channel
- 6.1. Toothpaste Tablet Market: Regional Dashboard
- 6.2. Market Size & Forecasts Trend Analysis, 2018 to 2030
- 6.3. North America
- 6.3.1. Market Estimates and Forecasts 2018 to 2030 (USD Million)
- 6.3.2. U.S.
- 6.3.2.1. Key country dynamics
- 6.3.2.2. Regulatory framework/ reimbursement structure
- 6.3.2.3. Competitive scenario
- 6.3.2.4. U.S. market estimates and forecast, 2018 - 2030 (USD Million)
- 6.3.3. Canada
- 6.3.3.1. Key country dynamics
- 6.3.3.2. Regulatory framework/ reimbursement structure
- 6.3.3.3. Competitive scenario
- 6.3.3.4. Canada market estimates and forecast, 2018 - 2030 (USD Million)
- 6.3.4. Mexico
- 6.3.4.1. Key country dynamics
- 6.3.4.2. Regulatory framework/ reimbursement structure
- 6.3.4.3. Competitive scenario
- 6.3.4.4. Mexico market estimates and forecast, 2018 - 2030 (USD Million)
- 6.4. Europe
- 6.4.1. Market Estimates and Forecasts 2018 to 2030 (USD Million)
- 6.4.2. UK
- 6.4.2.1. Key country dynamics
- 6.4.2.2. Regulatory framework/ reimbursement structure
- 6.4.2.3. Competitive scenario
- 6.4.2.4. UK market estimates and forecast, 2018 - 2030 (USD Million)
- 6.4.3. Germany
- 6.4.3.1. Key country dynamics
- 6.4.3.2. Regulatory framework/ reimbursement structure
- 6.4.3.3. Competitive scenario
- 6.4.3.4. Germany market estimates and forecast, 2018 - 2030 (USD Million)
- 6.4.4. France
- 6.4.4.1. Key country dynamics
- 6.4.4.2. Regulatory framework/ reimbursement structure
- 6.4.4.3. Competitive scenario
- 6.4.4.4. France market estimates and forecast, 2018 - 2030 (USD Million)
- 6.4.5. Italy
- 6.4.5.1. Key country dynamics
- 6.4.5.2. Regulatory framework/ reimbursement structure
- 6.4.5.3. Competitive scenario
- 6.4.5.4. Italy market estimates and forecast, 2018 - 2030 (USD Million)
- 6.4.6. Spain
- 6.4.6.1. Key country dynamics
- 6.4.6.2. Regulatory framework/ reimbursement structure
- 6.4.6.3. Competitive scenario
- 6.4.6.4. Spain market estimates and forecast, 2018 - 2030 (USD Million)
- 6.4.7. Sweden
- 6.4.7.1. Key country dynamics
- 6.4.7.2. Regulatory framework/ reimbursement structure
- 6.4.7.3. Competitive scenario
- 6.4.7.4. Sweden market estimates and forecast, 2018 - 2030 (USD Million)
- 6.4.8. Norway
- 6.4.8.1. Key country dynamics
- 6.4.8.2. Regulatory framework/ reimbursement structure
- 6.4.8.3. Competitive scenario
- 6.4.8.4. Norway market estimates and forecast, 2018 - 2030 (USD Million)
- 6.4.9. Denmark
- 6.4.9.1. Key country dynamics
- 6.4.9.2. Regulatory framework/ reimbursement structure
- 6.4.9.3. Competitive scenario
- 6.4.9.4. Denmark market estimates and forecast, 2018 - 2030 (USD Million)
- 6.5. Asia Pacific
- 6.5.1. Market Estimates and Forecasts 2018 to 2030 (USD Million)
- 6.5.2. China
- 6.5.2.1. Key country dynamics
- 6.5.2.2. Regulatory framework/ reimbursement structure
- 6.5.2.3. Competitive scenario
- 6.5.2.4. China market estimates and forecast, 2018 - 2030 (USD Million)
- 6.5.3. Japan
- 6.5.3.1. Key country dynamics
- 6.5.3.2. Regulatory framework/ reimbursement structure
- 6.5.3.3. Competitive scenario
- 6.5.3.4. Japan market estimates and forecast, 2018 - 2030 (USD Million)
- 6.5.4. India
- 6.5.4.1. Key country dynamics
- 6.5.4.2. Regulatory framework/ reimbursement structure
- 6.5.4.3. Competitive scenario
- 6.5.4.4. India market estimates and forecast, 2018 - 2030 (USD Million)
- 6.5.5. Australia
- 6.5.5.1. Key country dynamics
- 6.5.5.2. Regulatory framework/ reimbursement structure
- 6.5.5.3. Competitive scenario
- 6.5.5.4. Australia market estimates and forecast, 2018 - 2030 (USD Million)
- 6.5.6. Thailand
- 6.5.6.1. Key country dynamics
- 6.5.6.2. Regulatory framework/ reimbursement structure
- 6.5.6.3. Competitive scenario
- 6.5.6.4. Thailand market estimates and forecast, 2018 - 2030 (USD Million)
- 6.5.7. South Korea
- 6.5.7.1. Key country dynamics
- 6.5.7.2. Regulatory framework/ reimbursement structure
- 6.5.7.3. Competitive scenario
- 6.5.7.4. South Korea market estimates and forecast, 2018 - 2030 (USD Million)
- 6.6. Latin America
- 6.6.1. Market Estimates and Forecasts 2018 to 2030 (USD Million)
- 6.6.2. Brazil
- 6.6.2.1. Key country dynamics
- 6.6.2.2. Regulatory framework/ reimbursement structure
- 6.6.2.3. Competitive scenario
- 6.6.2.4. Brazil market estimates and forecast, 2018 - 2030 (USD Million)
- 6.6.3. Mexico
- 6.6.3.1. Key country dynamics
- 6.6.3.2. Regulatory framework/ reimbursement structure
- 6.6.3.3. Competitive scenario
- 6.6.3.4. Mexico market estimates and forecast, 2018 - 2030 (USD Million)
- 6.6.4. Argentina
- 6.6.4.1. Key country dynamics
- 6.6.4.2. Regulatory framework/ reimbursement structure
- 6.6.4.3. Competitive scenario
- 6.6.4.4. Argentina market estimates and forecast, 2018 - 2030 (USD Million)
- 6.7. MEA
- 6.7.1. Market Estimates and Forecasts 2018 to 2030 (USD Million)
- 6.7.2. Saudi Arabia
- 6.7.2.1. Key country dynamics
- 6.7.2.2. Regulatory framework/ reimbursement structure
- 6.7.2.3. Competitive scenario
- 6.7.2.4. Saudi Arabia market estimates and forecast, 2018 - 2030 (USD Million)
- 6.7.3. South Africa
- 6.7.3.1. Key country dynamics
- 6.7.3.2. Regulatory framework/ reimbursement structure
- 6.7.3.3. Competitive scenario
- 6.7.3.4. South Africa market estimates and forecast, 2018 - 2030 (USD Million)
- 6.7.4. UAE
- 6.7.4.1. Key country dynamics
- 6.7.4.2. Regulatory framework/ reimbursement structure
- 6.7.4.3. Competitive scenario
- 6.7.4.4. UAE market estimates and forecast, 2018 - 2030 (USD Million)
- 6.7.5. Kuwait
- 6.7.5.1. Key country dynamics
- 6.7.5.2. Regulatory framework/ reimbursement structure
- 6.7.5.3. Competitive scenario
- 6.7.5.4. Kuwait market estimates and forecast, 2018 - 2030 (USD Million)
Chapter 7. Competitive Landscape
- 7.1. Company/Competition Categorization
- 7.2. Market Position Analysis
- 7.2.1. Key company market share analysis, 2023
- 7.2.2. Heat Map Analysis
- 7.3. Company Profiles
- 7.3.1. Toothpaste India
- 7.3.1.1. Company overview
- 7.3.1.2. Financial performance
- 7.3.1.3. Product benchmarking
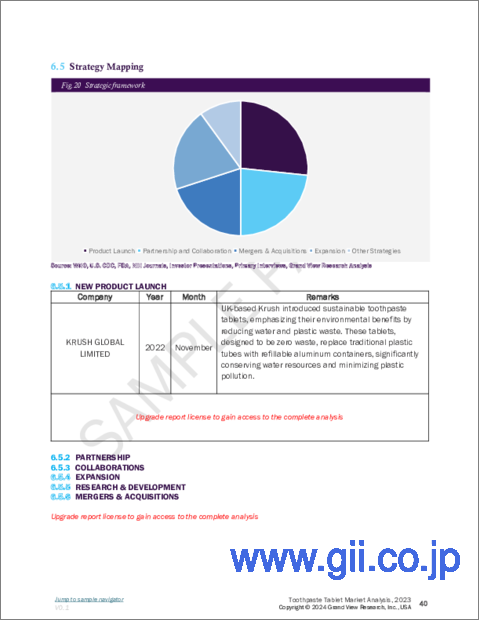
- 7.3.1.4. Strategic initiatives
- 7.3.2. Archtek
- 7.3.2.1. Company overview
- 7.3.2.2. Financial performance
- 7.3.2.3. Product benchmarking
- 7.3.2.4. Strategic initiatives
- 7.3.3. Colgate-Palmolive Company
- 7.3.3.1. Company overview
- 7.3.3.2. Financial performance
- 7.3.3.3. Product benchmarking
- 7.3.3.4. Strategic initiatives
- 7.3.4. The Humble Co.
- 7.3.4.1. Company overview
- 7.3.4.2. Financial performance
- 7.3.4.3. Product benchmarking
- 7.3.4.4. Strategic initiatives
- 7.3.5. Hcp Wellness
- 7.3.5.1. Company overview
- 7.3.5.2. Financial performance
- 7.3.5.3. Product benchmarking
- 7.3.5.4. Strategic initiatives
- 7.3.6. Denttabs
- 7.3.6.1. Company overview
- 7.3.6.2. Financial performance
- 7.3.6.3. Product benchmarking
- 7.3.6.4. Strategic initiatives
- 7.3.7. Germanics
- 7.3.7.1. Company overview
- 7.3.7.2. Financial performance
- 7.3.7.3. Product benchmarking
- 7.3.7.4. Strategic initiatives
- 7.3.8. Parla Toothpaste Tablets
- 7.3.8.1. Company overview
- 7.3.8.2. Financial performance
- 7.3.8.3. Product benchmarking
- 7.3.8.4. Strategic initiatives
- 7.3.9. Dental Lace
- 7.3.9.1. Company overview
- 7.3.9.2. Financial performance
- 7.3.9.3. Product benchmarking
- 7.3.9.4. Strategic initiatives
- 7.3.10. Kaylaan Llc
- 7.3.10.1. Company overview
- 7.3.10.2. Financial performance
- 7.3.10.3. Product benchmarking
- 7.3.10.4. Strategic initiatives
- 7.3.11. Huppy
- 7.3.11.1. Company overview
- 7.3.11.2. Financial performance
- 7.3.11.3. Product benchmarking
- 7.3.11.4. Strategic initiatives
- 7.3.12. Nelson Naturals Inc
- 7.3.12.1. Company overview
- 7.3.12.2. Financial performance
- 7.3.12.3. Product benchmarking
- 7.3.12.4. Strategic initiatives
- 7.3.1. Toothpaste India
