|
|
市場調査レポート
商品コード
1512032
インスリン注射補助器具の市場規模、シェア、動向分析レポート:製品別、最終用途別、地域別、セグメント予測、2024年~2030年Insulin Injection Aids Market Size, Share & Trends Analysis Report By Product (Insulin Vial Aids, Syringe Aids, Injectors, Aids for Kids), By End-use, By Region, And Segment Forecasts, 2024 - 2030 |
||||||
|
|||||||
カスタマイズ可能
|
|||||||

| インスリン注射補助器具の市場規模、シェア、動向分析レポート:製品別、最終用途別、地域別、セグメント予測、2024年~2030年 |
|
出版日: 2024年06月14日
発行: Grand View Research
ページ情報: 英文 160 Pages
納期: 2~10営業日
|

全表示
- 概要
- 図表
- 目次
インスリン注射補助器具市場の成長と動向:
Grand View Research, Inc.の最新レポートによると、世界のインスリン注射補助器具の市場規模は、2024年から2030年までのCAGRで成長し、2030年までに3億7,870万米ドルに達すると予測されています。
インスリン注射補助器具の市場を推進している主な要因は、糖尿病の有病率の上昇です。さらに、インスリンポンプ、注射器、ペンなどの従来のバイアルやシリンジよりも高度なインスリン投与方法への嗜好が高まっていることが、市場に拍車をかけています。
糖尿病有病率の増加は、インスリン注射補助器具の需要増加につながっています。例えば、IDF Diabetes Atlasが発表したレポートによると、2022年には5億3,700万人の成人が糖尿病を患っており、これは10人に1人の割合です。この数は、2030年には6億3,400万人、2045年には7億8,300万人に増加すると予想されています。インスリン注射補助器具が利用できるようになったことで、インスリンの正確で便利な投与が容易になり、より良い糖尿病治療に役立っています。
さらに、技術の進歩も市場の成長を促進する要因の一つです。技術の進歩は、より高度でユーザーフレンドリーなインスリン送達システムの作成を可能にしました。糖尿病患者の経験全体を向上させるために、技術の進歩はインスリン注射補助器具の開発にかなりの影響を与えています。例えば、注射器拡大鏡は、視力の弱い人のために開発されたもので、この装置で注射器のマークや数字を拡大することで、患者が注射器の必要投与量を読み取れるようにします。さらに、Medtronic plcが開発したi-Port Injection Portは、インスリン投与のたびに皮膚に穴が開くのを防ぐため、最大3日間皮膚に装着するポートです。さらに、注射器充填装置、ペン型注射器や自動注射器などの注射器は、より良い糖尿病管理のために人々を助けるように設計されています。
インスリン注射補助器具市場レポートハイライト
- 製品別では、糖尿病有病率の上昇により、シリンジ補助器具分野が2023年に38.77%のシェアで市場を独占しました。
- 最終用途別では、在宅ケア分野が2023年に45.36%のシェアで市場を独占しました。利便性、個別治療、潜在的なコスト削減が最大の市場シェアに貢献しました。
- 北米は、糖尿病患者の増加により、2023年の売上高シェアで市場をリードしました。
目次
第1章 調査手法と範囲
第2章 エグゼクティブサマリー
第3章 インスリン注射補助器具市場の変数、動向、範囲
- 市場系統の見通し
- 親市場の見通し
- 関連/付随市場の見通し
- 市場力学
- 市場牽引要因分析
- 市場抑制要因分析
- インスリン注射補助器具市場分析ツール
- 業界分析- ポーターのファイブフォース分析
- PESTEL分析
第4章 インスリン注射補助器具市場: 製品推定・動向分析
- 製品市場シェア、2023年および2030年
- セグメントダッシュボード
- 世界のインスリン注射補助器具市場:製品別展望
- 2018年から2030年までの市場規模と予測および動向分析
- インスリンバイアル補助器具市場
- 注射器補助器具市場
- インジェクター市場
- エイズ・フォー・キッズ・マーケット
- その他市場
第5章 インスリン注射補助器具市場:最終用途の推定・動向分析
- 最終用途市場シェア、2023年および2030年
- セグメントダッシュボード
- 最終用途別世界のインスリン注射補助器具市場展望
- 2018年から2030年までの市場規模と予測および動向分析
- 病院
- 専門クリニック
- 在宅ケア設定
- その他
第6章 インスリン注射補助器具市場:地域推定・動向分析
- 地域別市場シェア分析、2023年および2030年
- 地域市場ダッシュボード
- 世界地域市場スナップショット
- 市場規模、予測動向分析、2018年から2030年:
- 北米
- 米国
- カナダ
- メキシコ
- 欧州
- 英国
- ドイツ
- フランス
- イタリア
- スペイン
- ノルウェー
- スウェーデン
- デンマーク
- アジア太平洋
- 日本
- 中国
- インド
- オーストラリア
- 韓国
- タイ
- ラテンアメリカ
- ブラジル
- アルゼンチン
- 中東・アフリカ
- 南アフリカ
- サウジアラビア
- アラブ首長国連邦
- クウェート
第7章 競合情勢
- 主要市場参入企業による最近の動向と影響分析
- 企業/競合の分類
- ベンダー情勢
- List of key distributors and channel partners
- Key customers
- Key company market share analysis, 2023
- 企業プロファイル
- Medtronic Plc
- Convatec Inc.
- Becton, Dickinson and Co.
- AmbiMedInc.
- Medicool
- TickleTec Ltd
- Pain Care Labs
- Apothecary Products
- BIONIX LLC
- Prodigy Diabetes Care, LLC
List of Tables
- Table 1 Global insulin injection aids market, by region 2018 - 2030 (USD Million)
- Table 2 Global insulin injection aids market, by product, 2018 - 2030 (USD Million)
- Table 3 Global insulin injection aids market, by end-use, 2018 - 2030 (USD Million)
- Table 4 North America insulin injection aids market, by country, 2018 - 2030 (USD Million)
- Table 5 North America insulin injection aids market, by product, 2018 - 2030 (USD Million)
- Table 6 North America insulin injection aids market, by end-use, 2018 - 2030 (USD Million)
- Table 7 U.S. insulin injection aids market, by product, 2018 - 2030 (USD Million)
- Table 8 U.S. insulin injection aids market, by end-use, 2018 - 2030 (USD Million)
- Table 9 Canada insulin injection aids market, by product, 2018 - 2030 (USD Million)
- Table 10 Canada insulin injection aids market, by end-use, 2018 - 2030 (USD Million)
- Table 11 Mexico insulin injection aids market, by product, 2018 - 2030 (USD Million)
- Table 12 Mexico insulin injection aids market, by end-use, 2018 - 2030 (USD Million)
- Table 13 Mexico insulin injection aids market, by product, 2018 - 2030 (USD Million)
- Table 14 Mexico insulin injection aids market, by end-use, 2018 - 2030 (USD Million)
- Table 15 Europe insulin injection aids market, by country, 2018 - 2030 (USD Million)
- Table 16 Europe insulin injection aids market, by product, 2018 - 2030 (USD Million)
- Table 17 Europe insulin injection aids market, by end-use, 2018 - 2030 (USD Million)
- Table 18 UK. insulin injection aids market, by product, 2018 - 2030 (USD Million)
- Table 19 UK insulin injection aids market, by end-use, 2018 - 2030 (USD Million)
- Table 20 Germany insulin injection aids market, by product, 2018 - 2030 (USD Million)
- Table 21 Germany insulin injection aids market, by end-use, 2018 - 2030 (USD Million)
- Table 22 France insulin injection aids market, by product, 2018 - 2030 (USD Million)
- Table 23 France insulin injection aids market, by end-use, 2018 - 2030 (USD Million)
- Table 24 Italy insulin injection aids market, by product, 2018 - 2030 (USD Million)
- Table 25 Italy insulin injection aids market, by end-use, 2018 - 2030 (USD Million)
- Table 26 Spain insulin injection aids market, by product, 2018 - 2030 (USD Million)
- Table 27 Spain insulin injection aids market, by end-use, 2018 - 2030 (USD Million)
- Table 28 Denmark insulin injection aids market, by product, 2018 - 2030 (USD Million)
- Table 29 Denmark insulin injection aids market, by end-use, 2018 - 2030 (USD Million)
- Table 30 Sweden insulin injection aids market, by product, 2018 - 2030 (USD Million)
- Table 31 Sweden insulin injection aids market, by end-use, 2018 - 2030 (USD Million)
- Table 32 Norway insulin injection aids market, by product, 2018 - 2030 (USD Million)
- Table 33 Norway insulin injection aids market, by end-use, 2018 - 2030 (USD Million)
- Table 34 Asia Pacific insulin injection aids market, by country, 2018 - 2030 (USD Million)
- Table 35 Asia Pacific insulin injection aids market, by product, 2018 - 2030 (USD Million)
- Table 36 Asia Pacific insulin injection aids market, by end-use, 2018 - 2030 (USD Million)
- Table 37 Japan insulin injection aids market, by product, 2018 - 2030 (USD Million)
- Table 38 Japan insulin injection aids market, by end-use, 2018 - 2030 (USD Million)
- Table 39 China insulin injection aids market, by product, 2018 - 2030 (USD Million)
- Table 40 China insulin injection aids market, by end-use, 2018 - 2030 (USD Million)
- Table 41 India insulin injection aids market, by product, 2018 - 2030 (USD Million)
- Table 42 India insulin injection aids market, by end-use, 2018 - 2030 (USD Million)
- Table 43 Australia insulin injection aids market, by product, 2018 - 2030 (USD Million)
- Table 44 Australia insulin injection aids market, by end-use, 2018 - 2030 (USD Million)
- Table 45 Thailand insulin injection aids market, by product, 2018 - 2030 (USD Million)
- Table 46 Thailand insulin injection aids market, by end-use, 2018 - 2030 (USD Million)
- Table 47 South Korea insulin injection aids market, by product, 2018 - 2030 (USD Million)
- Table 48 South Korea insulin injection aids market, by end-use, 2018 - 2030 (USD Million)
- Table 49 Latin America insulin injection aids market, by country, 2018 - 2030 (USD Million)
- Table 50 Latin America insulin injection aids market, by product, 2018 - 2030 (USD Million)
- Table 51 Latin America insulin injection aids market, by end-use, 2018 - 2030 (USD Million)
- Table 52 Brazil insulin injection aids market, by product, 2018 - 2030 (USD Million)
- Table 53 Brazil insulin injection aids market, by end-use, 2018 - 2030 (USD Million)
- Table 54 Argentina insulin injection aids market, by product, 2018 - 2030 (USD Million)
- Table 55 Argentina insulin injection aids market, by end-use, 2018 - 2030 (USD Million)
- Table 56 MEA insulin injection aids market, by country, 2018 - 2030 (USD Million)
- Table 57 MEA insulin injection aids market, by product, 2018 - 2030 (USD Million)
- Table 58 MEA insulin injection aids market, by end-use, 2018 - 2030 (USD Million)
- Table 59 South Africa insulin injection aids market, by product, 2018 - 2030 (USD Million)
- Table 60 South Africa insulin injection aids market, by end-use, 2018 - 2030 (USD Million)
- Table 61 Saudi Arabia insulin injection aids market, by product, 2018 - 2030 (USD Million)
- Table 62 Saudi Arabia insulin injection aids market, by end-use, 2018 - 2030 (USD Million)
- Table 63 UAE insulin injection aids market, by product, 2018 - 2030 (USD Million)
- Table 64 UAE insulin injection aids market, by end-use, 2018 - 2030 (USD Million)
- Table 65 Kuwait insulin injection aids market, by product, 2018 - 2030 (USD Million)
- Table 66 Kuwait insulin injection aids market, by end-use, 2018 - 2030 (USD Million)
- Table 67 Participant's overview
- Table 68 Financial performance
- Table 69 Product benchmarking
- Table 70 Strategic Initiatives
List of Figures
- Fig. 1 Market research process
- Fig. 2 Data triangulation techniques
- Fig. 3 Primary research pattern
- Fig. 4 Market research approaches
- Fig. 5 Value-chain-based sizing & forecasting
- Fig. 6 QFD modeling for market share assessment
- Fig. 7 Market formulation & validation
- Fig. 8 Insulin injection aids market: Market snapshot
- Fig. 9 Insulin injection aids market: Market segmentation
- Fig. 10 Insulin injection aids market Strategy framework
- Fig. 11 Parent market outlook
- Fig. 12 Related/ancillary market outlook
- Fig. 13 Insulin injection aids market driver impact
- Fig. 14 Insulin injection aids market restraint impact
- Fig. 15 Insulin injection aids market porter's five forces analysis
- Fig. 16 Insulin injection aids market PESTEL analysis
- Fig. 17 Insulin injection aids market segment dashboard
- Fig. 18 Insulin injection aids market: Product movement Analysis
- Fig. 19 Insulin vial aids market estimates and forecast, 2018 - 2030 (USD Million)
- Fig. 20 Syringe aids market estimates and forecast, 2018 - 2030 (USD Million)
- Fig. 21 Injectors market estimates and forecast, 2018 - 2030 (USD Million)
- Fig. 22 Aids for kids market estimates and forecast, 2018 - 2030 (USD Million)
- Fig. 23 Others market estimates and forecast, 2018 - 2030 (USD Million)
- Fig. 24 Insulin injection aids market: End Use movement Analysis
- Fig. 25 Hospitals market estimates and forecast, 2018 - 2030 (USD Million)
- Fig. 26 Specialty Clinics market estimates and forecast, 2018 - 2030 (USD Million)
- Fig. 27 Homecare Settings market estimates and forecast, 2018 - 2030 (USD Million)
- Fig. 28 Others market estimates and forecast, 2018 - 2030 (USD Million)
- Fig. 29 Global insulin injection aids market: Regional movement analysis
- Fig. 30 Global insulin injection aids market: Regional outlook and key takeaways
- Fig. 31 Global market share, by Region
- Fig. 32 North America market estimates and forecast, 2018 - 2030 (USD Million)
- Fig. 33 U.S. market estimates and forecast, 2018 - 2030 (USD Million)
- Fig. 34 Canada market estimates and forecast, 2018 - 2030 (USD Million)
- Fig. 35 Mexico market estimates and forecast, 2018 - 2030 (USD Million)
- Fig. 36 Europe market estimates and forecast, 2018 - 2030 (USD Million)
- Fig. 37 UK market estimates and forecast, 2018 - 2030 (USD Million)
- Fig. 38 Germany market estimates and forecast, 2018 - 2030 (USD Million)
- Fig. 39 France market estimates and forecast, 2018 - 2030 (USD Million)
- Fig. 40 Italy market estimates and forecast, 2018 - 2030 (USD Million)
- Fig. 41 Spain market estimates and forecast, 2018 - 2030 (USD Million)
- Fig. 42 Denmark market estimates and forecast, 2018 - 2030 (USD Million)
- Fig. 43 Sweden market estimates and forecast, 2018 - 2030 (USD Million)
- Fig. 44 Norway market estimates and forecast, 2018 - 2030 (USD Million)
- Fig. 45 Asia Pacific market estimates and forecast, 2018 - 2030 (USD Million)
- Fig. 46 Japan market estimates and forecast, 2018 - 2030 (USD Million)
- Fig. 47 China market estimates and forecast, 2018 - 2030 (USD Million)
- Fig. 48 India market estimates and forecast, 2018 - 2030 (USD Million)
- Fig. 49 Australia market estimates and forecast, 2018 - 2030 (USD Million)
- Fig. 50 Thailand market estimates and forecast, 2018 - 2030 (USD Million)
- Fig. 51 South Korea market estimates and forecast, 2018 - 2030 (USD Million)
- Fig. 52 Latin America market estimates and forecast, 2018 - 2030 (USD Million)
- Fig. 53 Brazil market estimates and forecast, 2018 - 2030 (USD Million)
- Fig. 54 Mexico market estimates and forecast, 2018 - 2030 (USD Million)
- Fig. 55 Argentina market estimates and forecast, 2018 - 2030 (USD Million)
- Fig. 56 Middle East and Africa. market estimates and forecast, 2018 - 2030 (USD Million)
- Fig. 57 South Africa market estimates and forecast, 2018 - 2030 (USD Million)
- Fig. 58 Saudi Arabia market estimates and forecast, 2018 - 2030 (USD Million)
- Fig. 59 UAE market estimates and forecast, 2018 - 2030 (USD Million)
- Fig. 60 Kuwait market estimates and forecast, 2018 - 2030 (USD Million)
- Fig. 61 Market participant categorization
- Fig. 62 Heat map analysis
Insulin Injection Aids Market Growth & Trends:
The global insulin injection aids market size is anticipated to reach USD 378.7 million by 2030, growing at a CAGR of from 2024 to 2030, according to a new report by Grand View Research, Inc. A major factor propelling the market for insulin injection aids is the rising prevalence of diabetes. Furthermore, increasing preference for advanced insulin administration methods over conventional vials and syringes, such as insulin pumps, injectors, and pens is fueling the market.
Growing prevalence of diabetes is leading to the higher demand for the insulin injection aids. For instance, according to the report published by IDF Diabetes Atlas, in 2022, 537 Million adults had diabetes - 1 in 10. This number is expected to rise to 634 Million by 2030 and 783 Million by 2045. The availability of insulin injection aids makes it easier to administer insulin precisely and conveniently, which helps with better diabetes care.
Additionally, technological advancements are another factor driving the growth of the market. Technological advancements have enabled the creation of more advanced and user-friendly insulin delivery systems. To enhance the entire experience for individuals with diabetes, technological advancements have had a considerable impact on the development of insulin injection aids. For instance, syringe magnifiers are developed for the people with poor vision, the markings and number on the syringe are enlarged with this device to help the patients read the dosage requirements on the syringe. Moreover, I-Port Injection Port developed by Medtronic plc is a port that should be worn for up to three days on the skin to avoid skin puncture at every insulin dose. Additionally, syringe filling devices, injectors such as pen or auto injectors are designed to help people for better diabetes management.
Insulin Injection Aids Market Report Highlights:
- Based on products, syringe aids segment dominated the market in 2023, with a share of 38.77% owing to the rising prevalence of diabetes
- Based on end-use, home care settings segment dominated the market with a share of 45.36% in 2023. The convenience, individualized treatments, and potential cost savings contributed to its largest market share.
- North America led the market with the maximum revenue share in 2023, owing to the increasing number of patients suffering from diabetes.
Table of Contents
Chapter 1. Methodology and Scope
- 1.1. Market Segmentation & Scope
- 1.2. Segment Definitions
- 1.2.1. Product
- 1.2.2. End-use
- 1.2.3. Regional scope
- 1.2.4. Estimates and forecasts timeline
- 1.3. Research Methodology
- 1.4. Information Procurement
- 1.4.1. Purchased database
- 1.4.2. GVR's internal database
- 1.4.3. Secondary sources
- 1.4.4. Primary research
- 1.4.5. Details of primary research
- 1.4.5.1. Data for primary interviews in North America
- 1.4.5.2. Data for primary interviews in Europe
- 1.4.5.3. Data for primary interviews in Asia Pacific
- 1.4.5.4. Data for primary interviews in Latin America
- 1.4.5.5. Data for Primary interviews in MEA
- 1.5. Information or Data Analysis
- 1.5.1. Data analysis models
- 1.6. Market Formulation & Validation
- 1.7. Model Details
- 1.7.1. Commodity flow analysis (Model 1)
- 1.7.2. Approach 1: Commodity flow approach
- 1.7.3. Volume price analysis (Model 2)
- 1.7.4. Approach 2: Volume price analysis
- 1.8. List of Secondary Sources
- 1.9. List of Primary Sources
- 1.10. Objectives
Chapter 2. Executive Summary
- 2.1. Market Outlook
- 2.2. Segment Outlook
- 2.2.1. Product outlook
- 2.2.2. End Use outlook
- 2.2.3. Regional outlook
- 2.3. Competitive Insights
Chapter 3. Insulin Injection Aids Market Variables, Trends & Scope
- 3.1. Market Lineage Outlook
- 3.1.1. Parent market outlook
- 3.1.2. Related/ancillary market outlook
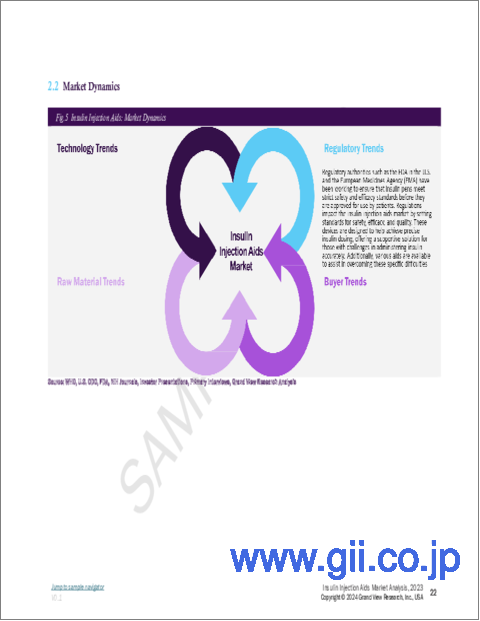
- 3.2. Market Dynamics
- 3.2.1. Market driver analysis
- 3.2.1.1. Rising prevalence of diabetes globally
- 3.2.1.2. Growing geriatric population
- 3.2.1.3. Growing awareness and education about diabetes management
- 3.2.1.4. Expansion of healthcare infrastructure
- 3.2.2. Market restraint analysis
- 3.2.2.1. Lack of awareness in emerging markets
- 3.2.2.2. Poor reimbursement scenarios
- 3.2.1. Market driver analysis
- 3.3. Insulin Injection Aids Market Analysis Tools
- 3.3.1. Industry Analysis - Porter's
- 3.3.1.1. Supplier power
- 3.3.1.2. Buyer power
- 3.3.1.3. Substitution threat
- 3.3.1.4. Threat of new entrant
- 3.3.1.5. Competitive rivalry
- 3.3.2. PESTEL Analysis
- 3.3.2.1. Political landscape
- 3.3.2.2. Economic landscape
- 3.3.2.3. Social landscape
- 3.3.2.4. Technological landscape
- 3.3.2.5. Environmental landscape
- 3.3.2.6. Legal landscape
- 3.3.1. Industry Analysis - Porter's
Chapter 4. Insulin Injection Aids Market: Product Estimates & Trend Analysis
- 4.1. Product Market Share, 2023 & 2030
- 4.2. Segment Dashboard
- 4.3. Global Insulin Injection Aids Market by Product Outlook
- 4.4. Market Size & Forecasts and Trend Analyses, 2018 to 2030 for the following
- 4.5. Insulin Vial Aids Market
- 4.5.1. Market estimates and forecasts 2018 to 2030 (USD Million)
- 4.6. Syringe Aids Market
- 4.6.1. Market estimates and forecasts 2018 to 2030 (USD Million)
- 4.7. Injectors Market
- 4.7.1. Market estimates and forecasts 2018 to 2030 (USD Million)
- 4.8. Aids for Kids Market
- 4.8.1. Market estimates and forecasts 2018 to 2030 (USD Million)
- 4.9. Others Market
- 4.9.1. Market estimates and forecasts 2018 to 2030 (USD Million)
Chapter 5. Insulin Injection Aids Market: End-use Estimates & Trend Analysis
- 5.1. End-use Market Share, 2023 & 2030
- 5.2. Segment Dashboard
- 5.3. Global Insulin Injection Aids Market by End-use Outlook
- 5.4. Market Size & Forecasts and Trend Analyses, 2018 to 2030 for the following
- 5.5. Hospitals
- 5.5.1. Market estimates and forecasts 2018 to 2030 (USD Million)
- 5.6. Specialty Clinics
- 5.6.1. Market estimates and forecasts 2018 to 2030 (USD Million)
- 5.7. Home Care Settings
- 5.7.1. Market estimates and forecasts 2018 to 2030 (USD Million)
- 5.8. Others
- 5.8.1. Market estimates and forecasts 2018 to 2030 (USD Million)
Chapter 6. Insulin Injection Aids Market: Regional Estimates & Trend Analysis
- 6.1. Regional Market Share Analysis, 2023 & 2030
- 6.2. Regional Market Dashboard
- 6.3. Global Regional Market Snapshot
- 6.4. Market Size, & Forecasts Trend Analysis, 2018 to 2030:
- 6.5. North America
- 6.5.1. U.S.
- 6.5.1.1. Key country dynamics
- 6.5.1.2. Regulatory framework/ reimbursement structure
- 6.5.1.3. Competitive scenario
- 6.5.1.4. U.S. market estimates and forecasts 2018 to 2030 (USD Million)
- 6.5.2. Canada
- 6.5.2.1. Key country dynamics
- 6.5.2.2. Regulatory framework/ reimbursement structure
- 6.5.2.3. Competitive scenario
- 6.5.2.4. Canada market estimates and forecasts 2018 to 2030 (USD Million)
- 6.5.3. Mexico
- 6.5.3.1. Key country dynamics
- 6.5.3.2. Regulatory framework/ reimbursement structure
- 6.5.3.3. Competitive scenario
- 6.5.3.4. Mexico market estimates and forecasts 2018 to 2030 (USD Million)
- 6.5.1. U.S.
- 6.6. Europe
- 6.6.1. UK
- 6.6.1.1. Key country dynamics
- 6.6.1.2. Regulatory framework/ reimbursement structure
- 6.6.1.3. Competitive scenario
- 6.6.1.4. UK market estimates and forecasts 2018 to 2030 (USD Million)
- 6.6.2. Germany
- 6.6.2.1. Key country dynamics
- 6.6.2.2. Regulatory framework/ reimbursement structure
- 6.6.2.3. Competitive scenario
- 6.6.2.4. Germany market estimates and forecasts 2018 to 2030 (USD Million)
- 6.6.3. France
- 6.6.3.1. Key country dynamics
- 6.6.3.2. Regulatory framework/ reimbursement structure
- 6.6.3.3. Competitive scenario
- 6.6.3.4. France market estimates and forecasts 2018 to 2030 (USD Million)
- 6.6.4. Italy
- 6.6.4.1. Key country dynamics
- 6.6.4.2. Regulatory framework/ reimbursement structure
- 6.6.4.3. Competitive scenario
- 6.6.4.4. Italy market estimates and forecasts 2018 to 2030 (USD Million)
- 6.6.5. Spain
- 6.6.5.1. Key country dynamics
- 6.6.5.2. Regulatory framework/ reimbursement structure
- 6.6.5.3. Competitive scenario
- 6.6.5.4. Spain market estimates and forecasts 2018 to 2030 (USD Million)
- 6.6.6. Norway
- 6.6.6.1. Key country dynamics
- 6.6.6.2. Regulatory framework/ reimbursement structure
- 6.6.6.3. Competitive scenario
- 6.6.6.4. Norway market estimates and forecasts 2018 to 2030 (USD Million)
- 6.6.7. Sweden
- 6.6.7.1. Key country dynamics
- 6.6.7.2. Regulatory framework/ reimbursement structure
- 6.6.7.3. Competitive scenario
- 6.6.7.4. Sweden market estimates and forecasts 2018 to 2030 (USD Million)
- 6.6.8. Denmark
- 6.6.8.1. Key country dynamics
- 6.6.8.2. Regulatory framework/ reimbursement structure
- 6.6.8.3. Competitive scenario
- 6.6.8.4. Denmark market estimates and forecasts 2018 to 2030 (USD Million)
- 6.6.1. UK
- 6.7. Asia Pacific
- 6.7.1. Japan
- 6.7.1.1. Key country dynamics
- 6.7.1.2. Regulatory framework/ reimbursement structure
- 6.7.1.3. Competitive scenario
- 6.7.1.4. Japan market estimates and forecasts 2018 to 2030 (USD Million)
- 6.7.2. China
- 6.7.2.1. Key country dynamics
- 6.7.2.2. Regulatory framework/ reimbursement structure
- 6.7.2.3. Competitive scenario
- 6.7.2.4. China market estimates and forecasts 2018 to 2030 (USD Million)
- 6.7.3. India
- 6.7.3.1. Key country dynamics
- 6.7.3.2. Regulatory framework/ reimbursement structure
- 6.7.3.3. Competitive scenario
- 6.7.3.4. India market estimates and forecasts 2018 to 2030 (USD Million)
- 6.7.4. Australia
- 6.7.4.1. Key country dynamics
- 6.7.4.2. Regulatory framework/ reimbursement structure
- 6.7.4.3. Competitive scenario
- 6.7.4.4. Australia market estimates and forecasts 2018 to 2030 (USD Million)
- 6.7.5. South Korea
- 6.7.5.1. Key country dynamics
- 6.7.5.2. Regulatory framework/ reimbursement structure
- 6.7.5.3. Competitive scenario
- 6.7.5.4. South Korea market estimates and forecasts 2018 to 2030 (USD Million)
- 6.7.6. Thailand
- 6.7.6.1. Key country dynamics
- 6.7.6.2. Regulatory framework/ reimbursement structure
- 6.7.6.3. Competitive scenario
- 6.7.6.4. Thailand market estimates and forecasts 2018 to 2030 (USD Million)
- 6.7.1. Japan
- 6.8. Latin America
- 6.8.1. Brazil
- 6.8.1.1. Key country dynamics
- 6.8.1.2. Regulatory framework/ reimbursement structure
- 6.8.1.3. Competitive scenario
- 6.8.1.4. Brazil market estimates and forecasts 2018 to 2030 (USD Million)
- 6.8.2. Argentina
- 6.8.2.1. Key country dynamics
- 6.8.2.2. Regulatory framework/ reimbursement structure
- 6.8.2.3. Competitive scenario
- 6.8.2.4. Argentina market estimates and forecasts 2018 to 2030 (USD Million)
- 6.8.1. Brazil
- 6.9. MEA
- 6.9.1. South Africa
- 6.9.1.1. Key country dynamics
- 6.9.1.2. Regulatory framework/ reimbursement structure
- 6.9.1.3. Competitive scenario
- 6.9.1.4. South Africa market estimates and forecasts 2018 to 2030 (USD Million)
- 6.9.2. Saudi Arabia
- 6.9.2.1. Key country dynamics
- 6.9.2.2. Regulatory framework/ reimbursement structure
- 6.9.2.3. Competitive scenario
- 6.9.2.4. Saudi Arabia market estimates and forecasts 2018 to 2030 (USD Million)
- 6.9.3. UAE
- 6.9.3.1. Key country dynamics
- 6.9.3.2. Regulatory framework/ reimbursement structure
- 6.9.3.3. Competitive scenario
- 6.9.3.4. UAE market estimates and forecasts 2018 to 2030 (USD Million)
- 6.9.4. Kuwait
- 6.9.4.1. Key country dynamics
- 6.9.4.2. Regulatory framework/ reimbursement structure
- 6.9.4.3. Competitive scenario
- 6.9.4.4. Kuwait market estimates and forecasts 2018 to 2030 (USD Million)
- 6.9.1. South Africa
Chapter 7. Competitive Landscape
- 7.1. Recent Developments & Impact Analysis, By Key Market Participants
- 7.2. Company/Competition Categorization
- 7.3. Vendor Landscape
- 7.3.1. List of key distributors and channel partners
- 7.3.2. Key customers
- 7.3.3. Key company market share analysis, 2023
- 7.4. Company Profiles
- 7.4.1. Medtronic Plc
- 7.4.1.1. Company overview
- 7.4.1.2. Financial performance
- 7.4.1.3. Product benchmarking
- 7.4.1.4. Strategic initiatives
- 7.4.2. Convatec Inc.
- 7.4.2.1. Company overview
- 7.4.2.2. Financial performance
- 7.4.2.3. Product benchmarking
- 7.4.2.4. Strategic initiatives
- 7.4.3. Becton, Dickinson and Co.
- 7.4.3.1. Company overview
- 7.4.3.2. Financial performance
- 7.4.3.3. Product benchmarking
- 7.4.3.4. Strategic initiatives
- 7.4.4. AmbiMedInc.
- 7.4.4.1. Company overview
- 7.4.4.2. Financial performance
- 7.4.4.3. Product benchmarking
- 7.4.4.4. Strategic initiatives
- 7.4.5. Medicool
- 7.4.5.1. Company overview
- 7.4.5.2. Financial performance
- 7.4.5.3. Product benchmarking
- 7.4.5.4. Strategic initiatives
- 7.4.6. TickleTec Ltd
- 7.4.6.1. Company overview
- 7.4.6.2. Financial performance
- 7.4.6.3. Product benchmarking
- 7.4.6.4. Strategic initiatives
- 7.4.7. Pain Care Labs
- 7.4.7.1. Company overview
- 7.4.7.2. Financial performance
- 7.4.7.3. Product benchmarking
- 7.4.7.4. Strategic initiatives
- 7.4.8. Apothecary Products
- 7.4.8.1. Company overview
- 7.4.8.2. Financial performance
- 7.4.8.3. Product benchmarking
- 7.4.8.4. Strategic initiatives
- 7.4.9. BIONIX LLC
- 7.4.9.1. Company overview
- 7.4.9.2. Financial performance
- 7.4.9.3. Product benchmarking
- 7.4.9.4. Strategic initiatives
- 7.4.10. Prodigy Diabetes Care, LLC
- 7.4.10.1. Company overview
- 7.4.10.2. Financial performance
- 7.4.10.3. Product benchmarking
- 7.4.10.4. Strategic initiatives
- 7.4.1. Medtronic Plc
