|
|
市場調査レポート
商品コード
1511843
フローダイバーターの市場規模、シェア、動向分析レポート:直径サイズ別、地域別、セグメント予測、2024年~2030年Flow Diverters Market Size, Share & Trends Analysis Report By Diameter Size (2-3 mm, 3-4 mm, 4-5 mm, >5 mm), By Region (North America, Europe), And Segment Forecasts, 2024 - 2030 |
||||||

|
|||||||
カスタマイズ可能
|
|||||||

| フローダイバーターの市場規模、シェア、動向分析レポート:直径サイズ別、地域別、セグメント予測、2024年~2030年 |
|
出版日: 2024年06月12日
発行: Grand View Research
ページ情報: 英文 300 Pages
納期: 2~10営業日
|

全表示
- 概要
- 図表
- 目次
フローダイバーター市場の成長と動向:
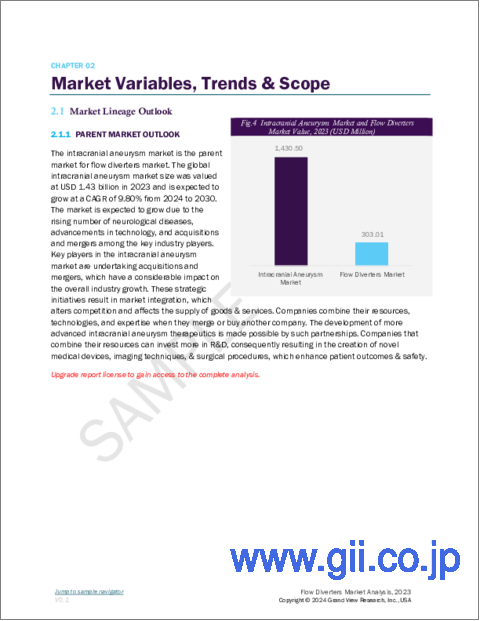
Grand View Research, Inc.の最新レポートによると、世界のフローダイバーター市場規模は、2024年から2030年にかけて13.29%のCAGRを記録し、2030年には7億2,259万米ドルに達すると予測されています。
脳動脈瘤治療分野における研究活動の活発化とともに、低侵襲治療の選択肢、規制当局の承認、共同研究、パートナーシップに関する意識の高まりが市場成長を促進しています。
高血圧に罹患する患者の増加は脳動脈瘤のリスクを著しく増加させる。例えば、2022年のBarcelona Institute for Global Health(ISGlobal)によると、高血圧は世界の死因の上位の1つであり、毎年全死亡者の12.8%を占めています。さらに、2023年のWHOによると、世界では30~79歳の推定12億8,000万人が高血圧であり、その大半(3分の2)は中低所得国に住んでいます。これらの要因により、今後数年間は需要が増加すると予想されます。
脳動脈瘤に関する国民の意識向上と治療改善のために各国政府が開始したいくつかのイニシアチブは、近い将来の需要に拍車をかけると予想されます。例えば、カナダの脳動脈瘤財団は、脳動脈瘤に関する認知の普及と教育に向けて活動しています。このプログラムには、脳動脈瘤の有病率を強調するための毎月の教育ウェビナーへの早期アクセスやソーシャルメディアキャンペーンが含まれます。
新興国市場では、より多くの顧客を獲得するため、各社が技術的に先進的な製品を開発・発売しています。例えば、2020年1月、MicroVention, Inc.(テルモ株式会社の子会社)は、脳動脈瘤の治療に使用されるFREDのFDA市販前クリアランスを取得しました。このFREDは、自己拡張性のニチノール製メッシュを使用して血流を迂回させ、動脈瘤の閉鎖を促進するもので、近い将来の需要拡大が期待されています。
フローダイバーター市場レポートハイライト
- 直径サイズに基づくと、巨大で幅の広い頭蓋内動脈瘤(血管直径10mm以上)の治療における需要と用途の増加により、2023年には5mm超のフローダイバーターセグメントが市場全体を支配しました。
- 北米は、脳動脈瘤の有病率の高さとこの地域の主要市場プレイヤーの存在により、2023年に35.98%のシェアで最も高い収益を上げ、市場を独占しました。
- アジア太平洋地域は、2024年から2030年にかけて最も速いCAGRで成長すると予測されています。これは、対象人口が多く、ヘルスケア支出が増加しているためです。
目次
第1章 調査手法と範囲
第2章 エグゼクティブサマリー
第3章 フローダイバーター市場の変数、動向、範囲
- 市場系統の見通し
- 補助市場の見通し
- 市場力学
- 市場 促進要因分析
- 市場抑制要因分析
- 市場機会分析
- 市場課題分析
- フローダイバーター市場分析ツール
- 業界分析- ポーターのファイブフォース分析
- PESTEL分析
第4章 フローダイバーター市場:直径サイズの推定・動向分析
- セグメントダッシュボード
- フローダイバーター市場の直径サイズの変動分析
- フローダイバーター市場規模と動向分析、直径サイズ別、2018年~2030年
- 2~3mm
- 3~4mm
- 4~5mm
- >5mm
第5章 フローダイバーター市場:地域推定・動向分析
- 地域ダッシュボード
- 市場規模と予測および動向分析、2018年から2030年
- 北米
- 欧州
- アジア太平洋
- ラテンアメリカ
- 中東・アフリカ
第6章 競合情勢
- 市場参入企業の分類
- 主要企業プロファイル
- Stryker
- Medtronic
- MicroVention, Inc.(Terumo Corporation)
- Balt
- MicroPort Scientific Corporation
- CERENOVUS(Johnson &Johnson Services, Inc.)
- phenox GmbH
- Acandis GmbH
- InspireMD, Inc.
- ヒートマップ分析/企業市況分析
- 2023年の企業市場シェアの推定分析
- その他の主要市場プレーヤーのリスト
List of Tables
- Table 1 List of Secondary Sources
- Table 2 List of Abbreviations
- Table 3 Global Flow Diverters Market, by Region, 2018 - 2030 (USD Million)
- Table 4 Global Flow Diverters Market, by Diameter Size, 2018 - 2030 (USD Million)
- Table 5 North America Flow Diverters Market, by Country, 2018 - 2030 (USD Million)
- Table 6 North America Flow Diverters Market, by Diameter Size, 2018 - 2030 (USD Million)
- Table 7 US Flow Diverters Market, by Diameter Size, 2018 - 2030 (USD Million)
- Table 8 Canada Flow Diverters Market, by Diameter Size, 2018 - 2030 (USD Million)
- Table 9 Mexico Flow Diverters Market, by Diameter Size, 2018 - 2030 (USD Million)
- Table 10 Europe Flow Diverters Market, by Country, 2018 - 2030 (USD Million)
- Table 11 Europe Flow Diverters Market, by Diameter Size, 2018 - 2030 (USD Million)
- Table 12 Germany Flow Diverters Market, by Diameter Size, 2018 - 2030 (USD Million)
- Table 13 UK Flow Diverters Market, by Diameter Size, 2018 - 2030 (USD Million)
- Table 14 France Flow Diverters Market, by Diameter Size, 2018 - 2030 (USD Million)
- Table 15 Italy Flow Diverters Market, by Diameter Size, 2018 - 2030 (USD Million)
- Table 16 Spain Flow Diverters Market, by Diameter Size, 2018 - 2030 (USD Million)
- Table 17 Denmark Flow Diverters Market, by Diameter Size, 2018 - 2030 (USD Million)
- Table 18 Sweden Flow Diverters Market, by Diameter Size, 2018 - 2030 (USD Million)
- Table 19 Norway Flow Diverters Market, by Diameter Size, 2018 - 2030 (USD Million)
- Table 20 Asia Pacific Flow Diverters Market, by Country, 2018 - 2030 (USD Million)
- Table 21 Asia Pacific Flow Diverters Market, by Diameter Size, 2018 - 2030 (USD Million)
- Table 22 China Flow Diverters Market, by Diameter Size, 2018 - 2030 (USD Million)
- Table 23 Japan Flow Diverters Market, by Diameter Size, 2018 - 2030 (USD Million)
- Table 24 India Flow Diverters Market, by Diameter Size, 2018 - 2030 (USD Million)
- Table 25 South Korea Flow Diverters Market, by Diameter Size, 2018 - 2030 (USD Million)
- Table 26 Australia Flow Diverters Market, by Diameter Size, 2018 - 2030 (USD Million)
- Table 27 Thailand Flow Diverters Market, by Diameter Size, 2018 - 2030 (USD Million)
- Table 28 Latin America Flow Diverters Market, by Country, 2018 - 2030 (USD Million)
- Table 29 Latin America Flow Diverters Market, by Diameter Size, 2018 - 2030 (USD Million)
- Table 30 Brazil Flow Diverters Market, by Diameter Size, 2018 - 2030 (USD Million)
- Table 31 Argentina Flow Diverters Market, by Diameter Size, 2018 - 2030 (USD Million)
- Table 32 Middle East & Africa Flow Diverters Market, by Country, 2018 - 2030 (USD Million)
- Table 33 Middle East & Africa Flow Diverters Market, by Diameter Size, 2018 - 2030 (USD Million)
- Table 34 South Africa Flow Diverters Market, by Diameter Size, 2018 - 2030 (USD Million)
- Table 35 Saudi Arabia Flow Diverters Market, by Diameter Size, 2018 - 2030 (USD Million)
- Table 36 UAE Flow Diverters Market, by Diameter Size, 2018 - 2030 (USD Million)
- Table 37 Kuwait Flow Diverters Market, by Diameter Size, 2018 - 2030 (USD Million)
- Table 38 Participant's Overview
- Table 39 Financial Performance
- Table 40 Product Benchmarking
- Table 41 Strategic Initiatives
List of Figures
- Fig. 1 Information Procurement
- Fig. 2 Primary Research Pattern
- Fig. 3 Market Research Approaches
- Fig. 4 Value Chain-Based Sizing & Forecasting
- Fig. 5 Market Formulation & Validation
- Fig. 6 Flow Diverters Market, Market Segmentation
- Fig. 7 Market Driver Analysis (Current & Future Impact)
- Fig. 8 Market Restraint Analysis (Current & Future Impact)
- Fig. 9 Market Opportunity Analysis (Current & Future Impact)
- Fig. 10 Market Challenge Analysis (Current & Future Impact)
- Fig. 11 SWOT Analysis, By Factor (Political & Legal, Economic and Technological)
- Fig. 12 Porter's Five Forces Analysis
- Fig. 13 Regional Marketplace: Key Takeaways
- Fig. 14 Global Flow Diverters Market, for 2-3mm, 2018 - 2030 (USD Million)
- Fig. 15 Global Flow Diverters Market, for 3-4mm, 2018 - 2030 (USD Million)
- Fig. 16 Global Flow Diverters Market, for 4-5mm, 2018 - 2030 (USD Million)
- Fig. 17 Global Flow Diverters Market, for >5mm, 2018 - 2030 (USD Million)
- Fig. 18 Regional Outlook, 2023 & 2030
- Fig. 19 North America Flow Diverters Market, 2018 - 2030 (USD Million)
- Fig. 20 U.S. Flow Diverters Market, 2018 - 2030 (USD Million)
- Fig. 21 Canada Flow Diverters Market, 2018 - 2030 (USD Million)
- Fig. 22 Mexico Flow Diverters Market, 2018 - 2030 (USD Million)
- Fig. 23 Europe Flow Diverters Market, 2018 - 2030 (USD Million)
- Fig. 24 Germany Flow Diverters Market, 2018 - 2030 (USD Million)
- Fig. 25 UK Flow Diverters Market, 2018 - 2030 (USD Million)
- Fig. 26 France Flow Diverters Market, 2018 - 2030 (USD Million)
- Fig. 27 Italy Flow Diverters Market, 2018 - 2030 (USD Million)
- Fig. 28 Spain Flow Diverters Market, 2018 - 2030 (USD Million)
- Fig. 29 Denmark Flow Diverters Market, 2018 - 2030 (USD Million)
- Fig. 30 Sweden Flow Diverters Market, 2018 - 2030 (USD Million)
- Fig. 31 Norway Flow Diverters Market, 2018 - 2030 (USD Million)
- Fig. 32 Asia Pacific Flow Diverters Market, 2018 - 2030 (USD Million)
- Fig. 33 Japan Flow Diverters Market, 2018 - 2030 (USD Million)
- Fig. 34 China Flow Diverters Market, 2018 - 2030 (USD Million)
- Fig. 35 India Flow Diverters Market, 2018 - 2030 (USD Million)
- Fig. 36 Australia Flow Diverters Market, 2018 - 2030 (USD Million)
- Fig. 37 South Korea Flow Diverters Market, 2018 - 2030 (USD Million)
- Fig. 38 Thailand Flow Diverters Market, 2018 - 2030 (USD Million)
- Fig. 39 Latin America Flow Diverters Market, 2018 - 2030 (USD Million)
- Fig. 40 Brazil Flow Diverters Market, 2018 - 2030 (USD Million)
- Fig. 41 Argentina Flow Diverters Market, 2018 - 2030 (USD Million)
- Fig. 42 Middle East and Africa Flow Diverters Market, 2018 - 2030 (USD Million)
- Fig. 43 South Africa Flow Diverters Market, 2018 - 2030 (USD Million)
- Fig. 44 Saudi Arabia Flow Diverters Market, 2018 - 2030 (USD Million)
- Fig. 45 UAE Flow Diverters Market, 2018 - 2030 (USD Million)
- Fig. 46 Kuwait Flow Diverters Market, 2018 - 2030 (USD Million)
Flow Diverters Market Growth & Trends:
The global flow diverters market size is expected to reach USD 722.59 million by 2030, registering a CAGR of 13.29% from 2024 to 2030, according to a new report by Grand View Research, Inc. Rising awareness about minimally invasive treatment option, regulatory approvals, collaboration and partnerships, along with growing research activity in the field of brain aneurysm treatment are driving the market growth.
Increasing number of patients suffering from hypertension significantly increases the risk of brain aneurysm. For instance, as per the Barcelona Institute for Global Health (ISGlobal) in 2022, Hypertension is one of the top causes of death worldwide, accounting for 12.8% of all fatalities each year. Furthermore, as per the WHO in 2023, worldwide, an estimated 1.28 billion persons aged 30-79 years have hypertension, with the majority (two-thirds) living in middle and low income nations. These factors are expected to increase the demand in the coming years.
Several initiatives launched by the government of various countries to improve public awareness and treatment related to cerebral aneurysm are anticipated to spur the demand in near future. For instance, the Brain Aneurysm Foundation of Canada works toward spreading awareness and educating about brain aneurysm. This programs include and social media campaigns early access to monthly educational webinars for highlighting the prevalence of brain aneurysm.
Companies are developing and launching technologically advanced products for attracting more customers in the market. For instance, in January 2020, MicroVention, Inc. (a subsidiary of Terumo Corporation) has gained FDA Premarket Clearance for their FRED, which is used to treat cerebral aneurysms. It makes use of a self-expanding, woven nitinol mesh to reroute blood flow and facilitate aneurysm closure which is expected to boost the demand in the near future.
Flow Diverters Market Report Highlights:
- Based on diameter size, >5 mm flow diverter segment dominated the overall market in 2023 owing to their increasing demand and application in treating giant and wide intracranial aneurysms (>10 mm vessel diameter).
- North America dominated the market with the highest revenue with a share of 35.98% in 2023 owing to high prevalence rate of brain aneurysm and presence of key market players in this region.
- Asia Pacific region is anticipated to grow at the fastest CAGR from 2024 to 2030 owing to the presence of large target population, and increasing healthcare spending in the region.
Table of Contents
Chapter 1. Methodology and Scope
- 1.1. Market Segmentation and Scope
- 1.2. Research Methodology
- 1.3. Information Procurement
- 1.4. Information or Data Analysis
- 1.5. Market Formulation & Validation
- 1.6. Model Details
- 1.7. List of Data Sources
Chapter 2. Executive Summary
- 2.1. Market Outlook
- 2.2. Segment Outlook
- 2.3. Competitive Insights
Chapter 3. Flow Diverters Market Variables, Trends, & Scope
- 3.1. Market Lineage Outlook
- 3.1.1. Ancillary Market Outlook
- 3.2. Market Dynamics
- 3.2.1. Market Driver Analysis
- 3.2.1.1. Technological Advancements
- 3.2.1.2. Increasing Prevalence Brain Aneurysm
- 3.2.1.3. Mergers And Acquisition Among Industry Key Players
- 3.2.2. Market Restraint Analysis
- 3.2.2.1. Lack Of Skilled Healthcare Professionals
- 3.2.2.2. High Cost of Treatment
- 3.2.3. Market Opportunities Analysis
- 3.2.3.1. Increasing Clinical Studies for The Treatment of Brain Aneurysm
- 3.2.4. Market Challenge Analysis
- 3.2.4.1. Complex Regulatory Framework
- 3.2.1. Market Driver Analysis
- 3.3. Flow Diverters Market Analysis Tools
- 3.3.1. Industry Analysis - Porter's
- 3.3.1.1. Bargaining power of suppliers
- 3.3.1.2. Bargaining power of buyers
- 3.3.1.3. Threat of substitutes
- 3.3.1.4. Threat of new entrants
- 3.3.1.5. Competitive rivalry
- 3.3.2. PESTEL Analysis
- 3.3.2.1. Political & Legal Landscape
- 3.3.2.2. Economic and Social Landscape
- 3.3.2.3. Technological landscape
- 3.3.1. Industry Analysis - Porter's
Chapter 4. Flow Diverters Market: Diameter Size Estimates & Trend Analysis
- 4.1. Segment Dashboard
- 4.2. Flow Diverters Market Diameter Size Movement Analysis
- 4.3. Flow Diverters Market Size & Trend Analysis, by Diameter Size, 2018 to 2030 (USD Million)
- 4.4. 2-3 mm
- 4.4.1. 2-3 mm Flow Diverters Market Revenue Estimates and Forecasts, 2018 - 2030 (USD Million)
- 4.5. 3-4mm
- 4.5.1. 3-4 mm Flow Diverters Market Revenue Estimates and Forecasts, 2018 - 2030 (USD Million)
- 4.6. 4-5mm
- 4.6.1. 4-5 mm Flow Diverters Market Revenue Estimates and Forecasts, 2018 - 2030 (USD Million)
- 4.7. >5 mm
- 4.7.1. >5 mm Flow Diverters Market Revenue Estimates and Forecasts, 2018 - 2030 (USD Million)
Chapter 5. Flow Diverters Market: Regional Estimates & Trend Analysis By Diameter Size
- 5.1. Regional Dashboard
- 5.2. Market Size & Forecasts and Trend Analysis, 2018 to 2030
- 5.3. North America
- 5.3.1. North America Flow Diverters Market Estimates and Forecasts, 2018 - 2030 (USD Million)
- 5.3.2. U.S.
- 5.3.2.1. Key Country Dynamics
- 5.3.2.2. Competitive Scenario
- 5.3.2.3. Regulatory Scenario
- 5.3.2.4. Reimbursement Scenario
- 5.3.2.5. U.S. Flow Diverters Market Estimates and Forecasts, 2018 - 2030 (USD Million)
- 5.3.3. Canada
- 5.3.3.1. Key Country Dynamics
- 5.3.3.2. Competitive Scenario
- 5.3.3.3. Regulatory Scenario
- 5.3.3.4. Reimbursement Scenario
- 5.3.3.5. Canada Flow Diverters Market Estimates and Forecasts, 2018 - 2030 (USD Million)
- 5.3.4. Mexico
- 5.3.4.1. Key Country Dynamics
- 5.3.4.2. Competitive Scenario
- 5.3.4.3. Regulatory Scenario
- 5.3.4.4. Reimbursement Scenario
- 5.3.4.5. Mexico Flow Diverters Market Estimates and Forecasts, 2018 - 2030 (USD Million)
- 5.4. Europe
- 5.4.1. Europe Flow Diverters Market Estimates and Forecasts, 2018 - 2030 (USD Million)
- 5.4.2. UK
- 5.4.2.1. Key Country Dynamics
- 5.4.2.2. Competitive Scenario
- 5.4.2.3. Regulatory Scenario
- 5.4.2.4. Reimbursement Scenario
- 5.4.2.5. UK Flow Diverters Market Estimates and Forecasts, 2018 - 2030 (USD Million)
- 5.4.3. Germany
- 5.4.3.1. Key Country Dynamics
- 5.4.3.2. Competitive Scenario
- 5.4.3.3. Regulatory Scenario
- 5.4.3.4. Reimbursement Scenario
- 5.4.3.5. Germany Flow Diverters Market Estimates and Forecasts, 2018 - 2030 (USD Million)
- 5.4.4. France
- 5.4.4.1. Key Country Dynamics
- 5.4.4.2. Competitive Scenario
- 5.4.4.3. Regulatory Scenario
- 5.4.4.4. Reimbursement Scenario
- 5.4.4.5. France Flow Diverters Market Estimates and Forecasts, 2018 - 2030 (USD Million)
- 5.4.5. Italy
- 5.4.5.1. Key Country Dynamics
- 5.4.5.2. Competitive Scenario
- 5.4.5.3. Regulatory Scenario
- 5.4.5.4. Reimbursement Scenario
- 5.4.5.5. Italy Flow Diverters Market Estimates and Forecasts, 2018 - 2030 (USD Million)
- 5.4.6. Spain
- 5.4.6.1. Key Country Dynamics
- 5.4.6.2. Competitive Scenario
- 5.4.6.3. Regulatory Scenario
- 5.4.6.4. Reimbursement Scenario
- 5.4.6.5. Spain Flow Diverters Market Estimates and Forecasts, 2018 - 2030 (USD Million)
- 5.4.7. Denmark
- 5.4.7.1. Key Country Dynamics
- 5.4.7.2. Competitive Scenario
- 5.4.7.3. Regulatory Scenario
- 5.4.7.4. Reimbursement Scenario
- 5.4.7.5. Denmark Flow Diverters Market Estimates and Forecasts, 2018 - 2030 (USD Million)
- 5.4.8. Sweden
- 5.4.8.1. Key Country Dynamics
- 5.4.8.2. Competitive Scenario
- 5.4.8.3. Regulatory Scenario
- 5.4.8.4. Reimbursement Scenario
- 5.4.8.5. Sweden Flow Diverters Market Estimates and Forecasts, 2018 - 2030 (USD Million)
- 5.4.9. Norway
- 5.4.9.1. Key Country Dynamics
- 5.4.9.2. Competitive Scenario
- 5.4.9.3. Regulatory Scenario
- 5.4.9.4. Reimbursement Scenario
- 5.4.9.5. Norway Flow Diverters Market Estimates and Forecasts, 2018 - 2030 (USD Million)
- 5.5. Asia Pacific
- 5.5.1. Asia Pacific Flow Diverters Market Estimates and Forecasts, 2018 - 2030 (USD Million)
- 5.5.2. Japan
- 5.5.2.1. Key Country Dynamics
- 5.5.2.2. Competitive Scenario
- 5.5.2.3. Regulatory Scenario
- 5.5.2.4. Reimbursement Scenario
- 5.5.2.5. Japan Flow Diverters Market Estimates and Forecasts, 2018 - 2030 (USD Million)
- 5.5.3. China
- 5.5.3.1. Key Country Dynamics
- 5.5.3.2. Competitive Scenario
- 5.5.3.3. Regulatory Scenario
- 5.5.3.4. Reimbursement Scenario
- 5.5.3.5. China Flow Diverters Market Estimates and Forecasts, 2018 - 2030 (USD Million)
- 5.5.4. India
- 5.5.4.1. Key Country Dynamics
- 5.5.4.2. Competitive Scenario
- 5.5.4.3. Regulatory Scenario
- 5.5.4.4. Reimbursement Scenario
- 5.5.4.5. India Flow Diverters Market Estimates and Forecasts, 2018 - 2030 (USD Million)
- 5.5.5. South Korea
- 5.5.5.1. Key Country Dynamics
- 5.5.5.2. Competitive Scenario
- 5.5.5.3. Regulatory Scenario
- 5.5.5.4. Reimbursement Scenario
- 5.5.5.5. South Korea Flow Diverters Market Estimates and Forecasts, 2018 - 2030 (USD Million)
- 5.5.6. Australia
- 5.5.6.1. Key Country Dynamics
- 5.5.6.2. Competitive Scenario
- 5.5.6.3. Regulatory Scenario
- 5.5.6.4. Reimbursement Scenario
- 5.5.6.5. Australia Flow Diverters Market Estimates and Forecasts, 2018 - 2030 (USD Million)
- 5.5.7. Thailand
- 5.5.7.1. Key Country Dynamics
- 5.5.7.2. Competitive Scenario
- 5.5.7.3. Regulatory Scenario
- 5.5.7.4. Reimbursement Scenario
- 5.5.7.5. Thailand Flow Diverters Market Estimates and Forecasts, 2018 - 2030 (USD Million)
- 5.6. Latin America
- 5.6.1. Latin America Flow Diverters Market Estimates and Forecasts, 2018 - 2030 (USD Million)
- 5.6.2. Brazil
- 5.6.2.1. Key Country Dynamics
- 5.6.2.2. Competitive Scenario
- 5.6.2.3. Regulatory Scenario
- 5.6.2.4. Reimbursement Scenario
- 5.6.2.5. Brazil Flow Diverters Market Estimates and Forecasts, 2018 - 2030 (USD Million)
- 5.6.3. Argentina
- 5.6.3.1. Key Country Dynamics
- 5.6.3.2. Competitive Scenario
- 5.6.3.3. Regulatory Scenario
- 5.6.3.4. Reimbursement Scenario
- 5.6.3.5. Argentina Flow Diverters Market Estimates and Forecasts, 2018 - 2030 (USD Million)
- 5.7. Middle East & Africa
- 5.7.1. Middle East & Africa Flow Diverters Market Estimates and Forecasts, 2018 - 2030 (USD Million)
- 5.7.2. South Africa
- 5.7.2.1. Key Country Dynamics
- 5.7.2.2. Competitive Scenario
- 5.7.2.3. Regulatory Scenario
- 5.7.2.4. Reimbursement Scenario
- 5.7.2.5. South Africa Flow Diverters Market Estimates and Forecasts, 2018 - 2030 (USD Million)
- 5.7.3. Saudi Arabia
- 5.7.3.1. Key Country Dynamics
- 5.7.3.2. Competitive Scenario
- 5.7.3.3. Regulatory Scenario
- 5.7.3.4. Reimbursement Scenario
- 5.7.3.5. Saudi Arabia Flow Diverters Market Estimates and Forecasts, 2018 - 2030 (USD Million)
- 5.7.4. UAE
- 5.7.4.1. Key Country Dynamics
- 5.7.4.2. Competitive Scenario
- 5.7.4.3. Regulatory Scenario
- 5.7.4.4. Reimbursement Scenario
- 5.7.4.5. UAE Flow Diverters Market Estimates and Forecasts, 2018 - 2030 (USD Million)
- 5.7.5. Kuwait
- 5.7.5.1. Key Country Dynamics
- 5.7.5.2. Competitive Scenario
- 5.7.5.3. Regulatory Scenario
- 5.7.5.4. Reimbursement Scenario
- 5.7.6. Kuwait Flow Diverters Market Estimates and Forecasts, 2018 - 2030 (USD Million)
Chapter 6. Competitive Landscape
- 6.1. Market Participant Categorization
- 6.2. Key Company Profiles
- 6.2.1. Stryker
- 6.2.1.1. Company Overview
- 6.2.1.2. Financial Performance
- 6.2.1.3. Product Benchmarking
- 6.2.1.4. Strategic Initiatives
- 6.2.2. Medtronic
- 6.2.2.1. Company Overview
- 6.2.2.2. Financial Performance
- 6.2.2.3. Product Benchmarking
- 6.2.2.4. Strategic Initiatives
- 6.2.3. MicroVention, Inc. (Terumo Corporation)
- 6.2.3.1. Company Overview
- 6.2.3.2. Financial Performance
- 6.2.3.3. Product Benchmarking
- 6.2.3.4. Strategic Initiatives
- 6.2.4. Balt
- 6.2.4.1. Company Overview
- 6.2.4.2. Financial Performance
- 6.2.4.3. Product Benchmarking
- 6.2.4.4. Strategic Initiatives
- 6.2.5. MicroPort Scientific Corporation
- 6.2.5.1. Company Overview
- 6.2.5.2. Financial Performance
- 6.2.5.3. Product Benchmarking
- 6.2.5.4. Strategic Initiatives
- 6.2.6. CERENOVUS (Johnson & Johnson Services, Inc.)
- 6.2.6.1. Company Overview
- 6.2.6.2. Financial Performance
- 6.2.6.3. Product Benchmarking
- 6.2.6.4. Strategic Initiatives
- 6.2.7. phenox GmbH
- 6.2.7.1. Company Overview
- 6.2.7.2. Financial Performance
- 6.2.7.3. Product Benchmarking
- 6.2.7.4. Strategic Initiatives
- 6.2.8. Acandis GmbH
- 6.2.8.1. Company Overview
- 6.2.8.2. Financial Performance
- 6.2.8.3. Product Benchmarking
- 6.2.8.4. Strategic Initiatives
- 6.2.9. InspireMD, Inc.
- 6.2.9.1. Company Overview
- 6.2.9.2. Financial Performance
- 6.2.9.3. Product Benchmarking
- 6.2.9.4. Strategic Initiatives
- 6.2.1. Stryker
- 6.3. Heat Map Analysis/ Company Market Position Analysis
- 6.4. Estimated Company Market Share Analysis, 2023
- 6.5. List of Other Key Market Players
