|
|
市場調査レポート
商品コード
1511799
変形性関節症用注射剤市場規模、シェア、動向分析レポート:注射剤タイプ別、解剖学別、最終用途別、およびセグメント予測、2024年~2030年Osteoarthritis Injectables Market Size, Share & Trends Analysis Report By Injection Type (Hyaluronic Acid Injections, Corticosteroids Injections), By Anatomy (Knee Osteoarthritis, Hip Osteoarthritis), By End-use, And Segment Forecasts, 2024 - 2030 |
||||||

|
|||||||
カスタマイズ可能
|
|||||||

| 変形性関節症用注射剤市場規模、シェア、動向分析レポート:注射剤タイプ別、解剖学別、最終用途別、およびセグメント予測、2024年~2030年 |
|
出版日: 2024年06月04日
発行: Grand View Research
ページ情報: 英文 137 Pages
納期: 2~10営業日
|

全表示
- 概要
- 図表
- 目次
変形性関節症用注射剤市場の成長と動向:
Grand View Research, Inc.の最新レポートによると、変形性関節症用注射剤の世界市場規模は、2024年から2030年にかけて6.82%のCAGRを示し、2030年には114億2,000万米ドルに達すると予測されています。
同市場は、いくつかの重要な要因の影響を受けて成長を遂げています。2021年1月のArthritis-healthのデータで強調されているように、50歳から60歳の女性は、ホルモンの変化や筋骨格系の違いにより、男性に比べて手や膝の変形性関節症(OA)を発症しやすいです。さらに、米国国立衛生研究所によれば、肥満率は女性の方が高く、リスクをさらに高めています。米国だけでも、変形性関節症の患者数は2040年までに7,000万人に達すると予測されています。
高齢者人口の増加は、市場拡大の大きな要因です。2023年5月にNCBIが発表したレポートでは、高齢化と肥満の組み合わせにより、変形性関節症の患者数は2030年までに2倍以上の6,700万人に達すると予測しています。2024年3月にCDCが支援したOAAAの研究によると、症例の大半は65歳以上で発生すると予想され、現在の変形性関節症患者の45%がこの年齢層に該当します。この人口動態の変化は生産性に影響を与え、作業効率を低下させ、疾病負担を増大させる。
研究開発活動も変形性関節症の注射剤市場の成長を後押ししており、製薬会社や研究機関はOA管理のための新薬開発に注力しています。バイオセニックが2024年1月に発表した、膝OAの革新的治療薬JTA-004の第3相試験に関する発表は、治療選択肢の拡大に対する業界のコミットメントを示しています。学術研究機関も新規治療法の開発に積極的に取り組んでいます。例えば、2023年3月に報告されたGP130の治験薬は、炎症と疼痛の管理に有望です。さらに、Kolon TissueGene, Inc.の股関節OAにおけるTG-Cの第2相臨床試験は、疼痛とQOLの改善を評価することを目的としています。
OA治療のための経口薬、手術、ジン漬けレーズンや銅ブレスレットの着用といった家庭療法の採用は、市場成長に悪影響を及ぼすと予想されます。鎮痛剤、NSAIDs、コルチコステロイドなどの経口・局所治療薬の採用は、患者中心のアプローチと使いやすさから増加しています。さらに、OAによる炎症や疼痛を管理するための新規経口薬を開発する研究活動の増加は、今後数年間のOA注射薬の市場拡大を妨げると予想されます。例えば、2022年2月、Medivir ABは、MIV-711の無作為化第2a相臨床試験の事後解析と、OAの疼痛管理に対するその症状的および構造的な利点を発表しました。MIV-711は、骨吸収と軟骨分解の両方を標的とする経口投与薬です。
変形性関節症用注射剤市場レポートハイライト:
- ヒアルロン酸(HA)注射は、OAにおける処方率が高いことから、2023年の市場を独占しました。
- 2023年は変形性膝関節症分野が市場を席巻。膝の変形性関節症は、特に高齢者に多くみられる疾患で、米国では50歳以上の男性で第2位の原因となっています。
- 2023年は病院薬局セグメントが市場を席巻病院薬局は、変形性関節症の管理において極めて重要な役割を果たしています。
目次
第1章 調査手法と範囲
第2章 エグゼクティブサマリー
第3章 世界の変形性関節症用注射剤市場の変数、動向、範囲
- 市場系統の見通し
- 親市場の見通し
- 関連/付随市場の見通し
- 市場力学
- 市場牽引要因分析
- 市場抑制要因分析
- 世界の変形性関節症用注射剤市場分析ツール
- 業界分析- ポーターのファイブフォース分析
- PESTEL分析
- 価格分析
第4章 世界の変形性関節症用注射剤市場:注射剤タイプの推定・動向分析
- 注射タイプの市場シェア、2023年と2030年
- セグメントダッシュボード
- 注射剤タイプ別世界変形性関節症用注射剤市場の展望
- 2018年~2030年の市場規模と予測および動向分析
第5章 世界の変形性関節症用注射剤市場:解剖学的推定・動向分析
- 解剖学の市場シェア、2023年と2030年
- セグメントダッシュボード
- 解剖学的展望による世界の変形性関節症用注射剤市場
- 2018年~2030年の市場規模と予測および動向分析
第6章 世界の変形性関節症用注射剤市場:最終用途の推定・動向分析
- 最終用途市場シェア、2023年および2030年
- セグメントダッシュボード
- 最終用途別世界変形性関節症用注射剤市場展望
- 2018年~2030年の市場規模と予測および動向分析
第7章 世界の変形性関節症用注射剤市場:地域推定・動向分析
- 地域市場ダッシュボード
- 市場規模、予測動向分析、2018年~2030年:
- 北米
- 欧州
- アジア太平洋
- ラテンアメリカ
- 中東・アフリカ
第8章 競合情勢
- 主要市場参入企業による最近の動向と影響分析
- 企業/競合の分類
- ベンダー情勢
- List of key distributors and channel partners
- Key customers
- Key company market share analysis, 2023
- Anika Therapeutics, Inc.
- Bioventus.
- Ferring Pharmaceuticals Inc.
- Sanofi SA
- Flexion Therapeutics, Inc.
- Zimmer Biomet
- Arthrex, Inc.
- Royal Biologics
- Teva Pharmaceutical Industries Ltd.
第9章 結論とアナリストの視点
List of Tables
- Table 1 List of key distributors and channel partners
- Table 2 List of key emerging companies'/technology disruptors/innovators
- Table 3 North America Osteoarthritis injectables Market, by country, 2018 - 2030 (USD Million)
- Table 4 North America Osteoarthritis injectables Market, by Injection Type, 2018 - 2030 (USD Million)
- Table 5 North America Osteoarthritis injectables Market, by Anatomy, 2018 - 2030 (USD Million)
- Table 6 North America Osteoarthritis injectables Market, by End Use, 2018 - 2030 (USD Million)
- Table 7 U.S. Osteoarthritis injectables Market, by Injection Type, 2018 - 2030 (USD Million)
- Table 8 U.S. Osteoarthritis injectables Market, by Anatomy, 2018 - 2030 (USD Million)
- Table 9 U.S. Osteoarthritis injectables Market, by End Use, 2018 - 2030 (USD Million)
- Table 10 Canada Osteoarthritis injectables Market, by Injection Type, 2018 - 2030 (USD Million)
- Table 11 Canada Osteoarthritis injectables Market, by Anatomy, 2018 - 2030 (USD Million)
- Table 12 Canada Osteoarthritis injectables Market, by End Use, 2018 - 2030 (USD Million)
- Table 13 Europe Osteoarthritis injectables Market, by country, 2018 - 2030 (USD Million)
- Table 14 Europe Osteoarthritis injectables Market, by Injection Type, 2018 - 2030 (USD Million)
- Table 15 Europe Osteoarthritis injectables Market, by Anatomy, 2018 - 2030 (USD Million)
- Table 16 Europe Osteoarthritis injectables Market, by End Use, 2018 - 2030 (USD Million)
- Table 17 Germany Osteoarthritis injectables Market, by Injection Type, 2018 - 2030 (USD Million)
- Table 18 Germany Osteoarthritis injectables Market, by Anatomy, 2018 - 2030 (USD Million)
- Table 19 Germany Osteoarthritis injectables Market, by End Use, 2018 - 2030 (USD Million)
- Table 20 UK Osteoarthritis injectables Market, by Injection Type, 2018 - 2030 (USD Million)
- Table 21 UK Osteoarthritis injectables Market, by Anatomy, 2018 - 2030 (USD Million)
- Table 22 UK Osteoarthritis injectables Market, by End Use, 2018 - 2030 (USD Million)
- Table 23 France Osteoarthritis injectables Market, by Injection Type, 2018 - 2030 (USD Million)
- Table 24 France Osteoarthritis injectables Market, by Anatomy, 2018 - 2030 (USD Million)
- Table 25 France Osteoarthritis injectables Market, by End Use, 2018 - 2030 (USD Million)
- Table 26 Italy Osteoarthritis injectables Market, by Injection Type, 2018 - 2030 (USD Million)
- Table 27 Italy Osteoarthritis injectables Market, by Anatomy, 2018 - 2030 (USD Million)
- Table 28 Italy Osteoarthritis injectables Market, by End Use, 2018 - 2030 (USD Million)
- Table 29 Spain Osteoarthritis injectables Market, by Injection Type, 2018 - 2030 (USD Million)
- Table 30 Spain Osteoarthritis injectables Market, by Anatomy, 2018 - 2030 (USD Million)
- Table 31 Sapin Osteoarthritis injectables Market, by End Use, 2018 - 2030 (USD Million)
- Table 32 Denmark Osteoarthritis injectables Market, by Injection Type, 2018 - 2030 (USD Million)
- Table 33 Denmark Osteoarthritis injectables Market, by Anatomy, 2018 - 2030 (USD Million)
- Table 34 Denmark Osteoarthritis injectables Market, by End Use, 2018 - 2030 (USD Million)
- Table 35 Sweden Osteoarthritis injectables Market, by Injection Type, 2018 - 2030 (USD Million)
- Table 36 Sweden Osteoarthritis injectables Market, by Anatomy, 2018 - 2030 (USD Million)
- Table 37 Sweden Osteoarthritis injectables Market, by End Use, 2018 - 2030 (USD Million)
- Table 38 Norway Osteoarthritis injectables Market, by Injection Type, 2018 - 2030 (USD Million)
- Table 39 Norway Osteoarthritis injectables Market, by Anatomy, 2018 - 2030 (USD Million)
- Table 40 Norway Osteoarthritis injectables Market, by End Use, 2018 - 2030 (USD Million)
- Table 41 Asia Pacific Osteoarthritis injectables Market, by country, 2018 - 2030 (USD Million)
- Table 42 Asia Pacific Osteoarthritis injectables Market, by Injection Type, 2018 - 2030 (USD Million)
- Table 43 Asia Pacific Osteoarthritis injectables Market, by Anatomy, 2018 - 2030 (USD Million)
- Table 44 Asia Pacific Osteoarthritis injectables Market, by End Use, 2018 - 2030 (USD Million)
- Table 45 Japan Osteoarthritis injectables Market, by Injection Type, 2018 - 2030 (USD Million)
- Table 46 Japan Osteoarthritis injectables Market, by Anatomy, 2018 - 2030 (USD Million)
- Table 47 Japan Osteoarthritis injectables Market, by End Use, 2018 - 2030 (USD Million)
- Table 48 China Osteoarthritis injectables Market, by Injection Type, 2018 - 2030 (USD Million)
- Table 49 China Osteoarthritis injectables Market, by Anatomy, 2018 - 2030 (USD Million)
- Table 50 China Osteoarthritis injectables Market, by End Use, 2018 - 2030 (USD Million)
- Table 51 India Osteoarthritis injectables Market, by Injection Type, 2018 - 2030 (USD Million)
- Table 52 India Osteoarthritis injectables Market, by Anatomy, 2018 - 2030 (USD Million)
- Table 53 India Osteoarthritis injectables Market, by End Use, 2018 - 2030 (USD Million)
- Table 54 Australia Osteoarthritis injectables Market, by Injection Type, 2018 - 2030 (USD Million)
- Table 55 Australia Osteoarthritis injectables Market, by Anatomy, 2018 - 2030 (USD Million)
- Table 56 Australia Osteoarthritis injectables Market, by End Use, 2018 - 2030 (USD Million)
- Table 57 South Korea Osteoarthritis injectables Market, by End Use, 2018 - 2030 (USD Million)
- Table 58 Thailand Osteoarthritis injectables Market, by Injection Type, 2018 - 2030 (USD Million)
- Table 59 Thailand Osteoarthritis injectables Market, by Anatomy, 2018 - 2030 (USD Million)
- Table 60 Thailand Osteoarthritis injectables Market, by End Use, 2018 - 2030 (USD Million)
- Table 61 Latin America Osteoarthritis injectables Market, by country, 2018 - 2030 (USD Million)
- Table 62 Latin America Osteoarthritis injectables Market, by Injection Type, 2018 - 2030 (USD Million)
- Table 63 Latin America Osteoarthritis injectables Market, by Anatomy, 2018 - 2030 (USD Million)
- Table 64 Latin America Osteoarthritis injectables Market, by End Use, 2018 - 2030 (USD Million)
- Table 65 Brazil Osteoarthritis injectables Market, by Injection Type, 2018 - 2030 (USD Million)
- Table 66 Brazil Osteoarthritis injectables Market, by Anatomy, 2018 - 2030 (USD Million)
- Table 67 Brazil Osteoarthritis injectables Market, by End Use, 2018 - 2030 (USD Million)
- Table 68 Mexico Osteoarthritis injectables Market, by Injection Type, 2018 - 2030 (USD Million)
- Table 69 Mexico Osteoarthritis injectables Market, by Anatomy, 2018 - 2030 (USD Million)
- Table 70 Mexico Osteoarthritis injectables Market, by End Use, 2018 - 2030 (USD Million)
- Table 71 Argentina Osteoarthritis injectables Market, by Injection Type, 2018 - 2030 (USD Million)
- Table 72 Argentina Osteoarthritis injectables Market, by Anatomy, 2018 - 2030 (USD Million)
- Table 73 Argentina Osteoarthritis injectables Market, by End Use, 2018 - 2030 (USD Million)
- Table 74 MEA Osteoarthritis injectables Market, by country, 2018 - 2030 (USD Million)
- Table 75 MEA Osteoarthritis injectables Market, by Injection Type, 2018 - 2030 (USD Million)
- Table 76 MEA Osteoarthritis injectables Market, by Anatomy, 2018 - 2030 (USD Million)
- Table 77 MEA Osteoarthritis injectables Market, by End Use, 2018 - 2030 (USD Million)
- Table 78 South Africa Osteoarthritis injectables Market, by Injection Type, 2018 - 2030 (USD Million)
- Table 79 South Africa Osteoarthritis injectables Market, by Anatomy, 2018 - 2030 (USD Million)
- Table 80 South Africa Osteoarthritis injectables Market, by End Use, 2018 - 2030 (USD Million)
- Table 81 Saudi Arabia Osteoarthritis injectables Market, by Injection Type, 2018 - 2030 (USD Million)
- Table 82 Saudi Arabia Osteoarthritis injectables Market, by Anatomy, 2018 - 2030 (USD Million)
- Table 83 Saudi Arabia Osteoarthritis injectables Market, by End Use, 2018 - 2030 (USD Million)
- Table 84 UAE Osteoarthritis injectables Market, by Injection Type, 2018 - 2030 (USD Million)
- Table 85 UAE Osteoarthritis injectables Market, by Anatomy, 2018 - 2030 (USD Million)
- Table 86 UAE Osteoarthritis injectables Market, by End Use, 2018 - 2030 (USD Million)
- Table 87 Kuwait Osteoarthritis injectables Market, by Injection Type, 2018 - 2030 (USD Million)
- Table 88 Kuwait Osteoarthritis injectables Market, by Anatomy, 2018 - 2030 (USD Million)
- Table 89 Kuwait Osteoarthritis injectables Market, by End Use, 2018 - 2030 (USD Million)
List of Figures
- Fig. 1 Market research process
- Fig. 2 Data triangulation techniques
- Fig. 3 Primary research pattern
- Fig. 4 Market research approaches
- Fig. 5 Value-chain-based sizing & forecasting
- Fig. 6 QFD modeling for market share assessment
- Fig. 7 Market formulation & validation
- Fig. 8 Global Osteoarthritis Injectables market: market outlook
- Fig. 9 Global Osteoarthritis Injectables competitive insights
- Fig. 10 Parent market outlook
- Fig. 11 Related/ancillary market outlook
- Fig. 12 Penetration and growth prospect mapping
- Fig. 13 Industry value chain analysis
- Fig. 14 Global Osteoarthritis Injectables market driver impact
- Fig. 15 Global Osteoarthritis Injectables market restraint impact
- Fig. 16 Global Osteoarthritis Injectables market strategic initiatives analysis
- Fig. 17 Global Osteoarthritis Injectables market: Injection Type movement analysis
- Fig. 18 Global Osteoarthritis Injectables market: Injection Type outlook and key takeaways
- Fig. 19 Hyaluronic Acid Injections market estimates and forecast, 2018 - 2030 (USD Million)
- Fig. 20 Corticosteroid Injections market estimates and forecast, 2018 - 2030 (USD Million)
- Fig. 21 Platelet-rich Plasma (PRP) Injections market estimates and forecast, 2018 - 2030 (USD Million)
- Fig. 22 Placental Tissue Matrix (PTM) Injections market estimates and forecast, 2018 - 2030 (USD Million)
- Fig. 23 Acetylsalicylic Acid (ASA) Injections market estimates and forecast, 2018 - 2030 (USD Million)
- Fig. 24 Others market estimates and forecast, 2018 - 2030 (USD Million)
- Fig. 25 Global Osteoarthritis Injectables market: Anatomy movement analysis
- Fig. 26 Global Osteoarthritis Injectables market: Anatomy outlook and key takeaways
- Fig. 27 Knee Osteoarthritis market estimates and forecasts, 2018 - 2030 (USD Million)
- Fig. 28 Hip Osteoarthritis market estimates and forecasts, 2018 - 2030 (USD Million)
- Fig. 29 Hand Osteoarthritis market estimates and forecasts, 2018 - 2030 (USD Million)
- Fig. 30 Others market estimates and forecasts, 2018 - 2030 (USD Million)
- Fig. 31 Global Osteoarthritis Injectables market: End-use movement analysis
- Fig. 32 Global Osteoarthritis Injectables market: End-use outlook and key takeaways
- Fig. 33 Hospital Pharmacies market estimates and forecasts, 2018 - 2030 (USD Million)
- Fig. 34 Retail Pharmacies market estimates and forecasts, 2018 - 2030 (USD Million)
- Fig. 35 Others market estimates and forecasts, 2018 - 2030 (USD Million)
- Fig. 36 Market share of key market players- Global Osteoarthritis Injectables market
- Fig. 37 North America market size, & forecasts and trend analysis, 2018 to 2030 (USD Million)
- Fig. 38 U.S. market size, & forecasts and trend analysis, 2018 to 2030 (USD Million)
- Fig. 39 Canada market size, & forecasts and trend analysis, 2018 to 2030 (USD Million)
- Fig. 40 Europe market size, & forecasts and trend analysis, 2018 to 2030 (USD Million)
- Fig. 41 UK market size, & forecasts and trend analysis, 2018 to 2030 (USD Million)
- Fig. 42 Germany market size, & forecasts and trend analysis, 2018 to 2030 (USD Million)
- Fig. 43 Spain market size, & forecasts and trend analysis, 2018 to 2030 (USD Million)
- Fig. 44 France market size, & forecasts and trend analysis, 2018 to 2030 (USD Million)
- Fig. 45 Italy market size, & forecasts and trend analysis, 2018 to 2030 (USD Million)
- Fig. 46 Sweden market size, & forecasts and trend analysis, 2018 to 2030 (USD Million)
- Fig. 47 Denmark market size, & forecasts and trend analysis, 2018 to 2030 (USD Million)
- Fig. 48 Norway market size, & forecasts and trend analysis, 2018 to 2030 (USD Million)
- Fig. 49 Asia Pacific market size, & forecasts and trend analysis, 2018 to 2030 (USD Million)
- Fig. 50 China market size, & forecasts and trend analysis, 2018 to 2030 (USD Million)
- Fig. 51 Japan market size, & forecasts and trend analysis, 2018 to 2030 (USD Million)
- Fig. 52 India market size, & forecasts and trend analysis, 2018 to 2030 (USD Million)
- Fig. 53 Australia market size, & forecasts and trend analysis, 2018 to 2030 (USD Million)
- Fig. 54 South Korea market size, & forecasts and trend analysis, 2018 to 2030 (USD Million)
- Fig. 55 Thailand market size, & forecasts and trend analysis, 2018 to 2030 (USD Million)
- Fig. 56 Latin America market size, & forecasts and trend analysis, 2018 to 2030 (USD Million)
- Fig. 57 Brazil market size, & forecasts and trend analysis, 2018 to 2030 (USD Million)
- Fig. 58 Mexico market size, & forecasts and trend analysis, 2018 to 2030 (USD Million)
- Fig. 59 Argentina market size, & forecasts and trend analysis, 2018 to 2030 (USD Million))
- Fig. 60 Middle East and Africa market size, & forecasts and trend analysis, 2018 to 2030 (USD Million)
- Fig. 61 South Africa market size, & forecasts and trend analysis, 2018 to 2030 (USD Million)
- Fig. 62 Saudi Arabia market size, & forecasts and trend analysis, 2018 to 2030 (USD Million)
- Fig. 63 UAE market size, & forecasts and trend analysis, 2018 to 2030 (USD Million)
- Fig. 64 Kuwait market size, & forecasts and trend analysis, 2018 to 2030 (USD Million)
Osteoarthritis Injectables Market Growth & Trends:
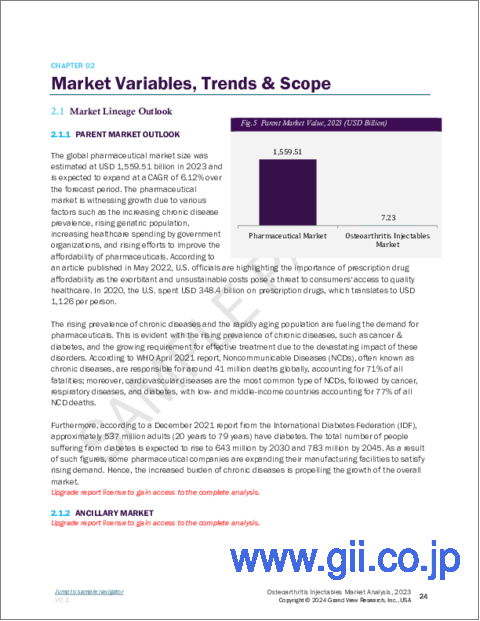
The global osteoarthritis injectables market size is anticipated to reach USD 11.42 billion by 2030, exhibiting a CAGR of 6.82% from 2024 to 2030, according to a new report by Grand View Research, Inc. The market is experiencing growth, influenced by several key factors. Women aged 50 to 60 are more susceptible to developing hand and knee osteoarthritis (OA) compared to men, due to hormonal changes and musculoskeletal differences, as highlighted by Arthritis-health data from January 2021. Additionally, obesity rates, higher among women according to the National Institutes of Health, further increase the risk. In the U.S. alone, it is projected that the number of osteoarthritis patients will reach 70 million by 2040.
The growing geriatric population is a significant driver for market expansion. An NCBI report from May 2023 predicts that the combination of an aging population and obesity will more than double the number of osteoarthritis patients to 67 million by 2030. The majority of cases are expected to occur in individuals aged 65 and above, with 45% of current osteoarthritis patients falling into this age group, according to an OAAA study supported by the CDC in March 2024. This demographic shift impacts productivity, reducing work efficiency and increasing the disease burden.
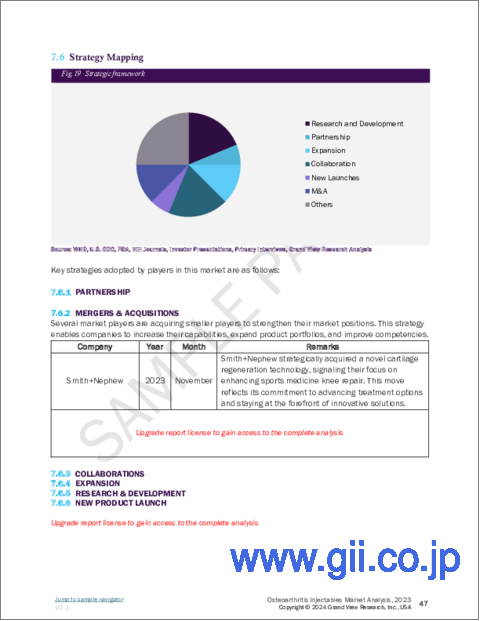
Research and development activities are also boosting the osteoarthritis injectables market growth, with pharmaceutical companies and research institutes focusing on the development of novel drugs for OA management. BioSenic's announcement in January 2024 regarding the phase 3 study of JTA-004, an innovative treatment for knee OA, demonstrates the industry's commitment to advancing treatment options. Academic and research institutes are also actively involved in developing novel therapies. For instance, a GP130 investigational drug, reported in March 2023, shows promise in managing inflammation and pain. Additionally, Kolon TissueGene, Inc.'s Phase 2 clinical trial for TG-C in hip OA aims to evaluate pain and quality-of-life improvements.
The adoption of oral drugs, surgery, and home remedies such as gin-soaked raisins or wearing copper bracelets for the treatment of OA is expected to adversely affect market growth. The adoption of oral and topical treatment drugs such as analgesics, NSAIDs, and corticosteroids, is increasing due to the patient-centric approach and ease of use. Moreover, increase in research activities to develop novel oral drugs to manage inflammation and pain due to OA is anticipated to hinder the market expansion of OA injectable drugs in the coming years. For instance, in February 2022, Medivir AB published the post-hoc analysis of a randomized phase 2a clinical trial of MIV-711 and its symptomatic and structural benefits for pain management of OA. MIV-711 is an orally administered drug targeting both bone resorption and cartilage degradation.
Osteoarthritis Injectables Market Report Highlights:
- Hyaluronic Acid (HA) injections segment dominated the market in 2023, owing to its high prescription rate in OA.
- Knee osteoarthritis segment dominated the market in 2023. Knee OA is a prevalent condition particularly affecting older individuals, with the U.S. witnessing it as the second leading cause of incapacity among men aged 50 years and above.
- Hospital pharmacies segment dominated the market in 2023. Hospital pharmacies play a pivotal role in osteoarthritis management, owing to factors such as higher number of treatments performed in the hospital setting.
Table of Contents
Chapter 1. Methodology and Scope
- 1.1. Market Segmentation & Scope
- 1.2. Segment Definitions
- 1.2.1. Injection Type
- 1.2.2. End-use
- 1.2.3. Regional scope
- 1.2.4. Estimates and forecasts timeline
- 1.3. Research Methodology
- 1.4. Information Procurement
- 1.4.1. Purchased database
- 1.4.2. GVR's internal database
- 1.4.3. Secondary sources
- 1.4.4. Primary research
- 1.4.5. Details of primary research
- 1.4.5.1. Data for primary interviews in North America
- 1.4.5.2. Data for primary interviews in Europe
- 1.4.5.3. Data for primary interviews in Asia Pacific
- 1.4.5.4. Data for primary interviews in Latin America
- 1.4.5.5. Data for primary interviews in MEA
- 1.5. Information or Data Analysis
- 1.5.1. Data analysis models
- 1.6. Market Formulation & Validation
- 1.7. Model Details
- 1.7.1. Commodity flow analysis (Model 1)
- 1.7.2. Approach 1: Commodity flow approach
- 1.7.3. Volume price analysis (Model 2)
- 1.7.4. Approach 2: Volume price analysis
- 1.8. List of Secondary Sources
- 1.9. List of Primary Sources
- 1.10. Objectives
Chapter 2. Executive Summary
- 2.1. Market Outlook
- 2.2. Segment Outlook
- 2.2.1. Injection Type
- 2.2.2. End-use
- 2.2.3. Regional outlook
- 2.3. Competitive Insights
Chapter 3. Global Osteoarthritis Injectables Market Variables, Trends & Scope
- 3.1. Market Lineage Outlook
- 3.1.1. Parent market outlook
- 3.1.2. Related/ancillary market outlook
- 3.2. Market Dynamics
- 3.2.1. Market driver analysis
- 3.2.1.1. Increasing prevalence of osteoarthritis
- 3.2.1.2. Growing geriatric population susceptible to osteoarthritis
- 3.2.1.3. Increase in R&D activities for injectable drug development
- 3.2.2. Market restraint analysis
- 3.2.2.1. Adoption of other treatment options
- 3.2.2.2. High cost of treatment
- 3.2.1. Market driver analysis
- 3.3. Global Osteoarthritis Injectables Market Analysis Tools
- 3.3.1. Industry Analysis - Porter's Five Forces
- 3.3.1.1. Supplier power
- 3.3.1.2. Buyer power
- 3.3.1.3. Substitution threat
- 3.3.1.4. Threat of new entrant
- 3.3.1.5. Competitive rivalry
- 3.3.2. PESTEL Analysis
- 3.3.2.1. Political landscape
- 3.3.2.2. Technological landscape
- 3.3.2.3. Economic landscape
- 3.3.2.4. Pricing Analysis
- 3.3.3. Pricing Analysis
- 3.3.1. Industry Analysis - Porter's Five Forces
Chapter 4. Global Osteoarthritis Injectables Market: Injection Type Estimates & Trend Analysis
- 4.1. Injection Type Market Share, 2023 & 2030
- 4.2. Segment Dashboard
- 4.3. Global Osteoarthritis Injectables Market by Injection Type Outlook
- 4.4. Market Size & Forecasts and Trend Analyses, 2018 to 2030 for the following
- 4.4.1. Hyaluronic Acid Injections
- 4.4.1.1. Market estimates and forecasts 2018 to 2030 (USD Million)
- 4.4.2. Corticosteroid Injections
- 4.4.2.1. Market estimates and forecasts 2018 to 2030 (USD Million)
- 4.4.3. Platelet-rich Plasma (PRP) Injections
- 4.4.3.1. Market estimates and forecasts 2018 to 2030 (USD Million)
- 4.4.4. Placental Tissue Matrix (PTM) Injections
- 4.4.4.1. Market estimates and forecasts 2018 to 2030 (USD Million)
- 4.4.5. Acetylsalicylic Acid (ASA) Injections
- 4.4.5.1. Market estimates and forecasts 2018 to 2030 (USD Million)
- 4.4.6. Others
- 4.4.6.1. Market estimates and forecasts 2018 to 2030 (USD Million)
- 4.4.1. Hyaluronic Acid Injections
Chapter 5. Global Osteoarthritis Injectables Market: Anatomy Estimates & Trend Analysis
- 5.1. Anatomy Market Share, 2023 & 2030
- 5.2. Segment Dashboard
- 5.3. Global Osteoarthritis Injectables Market by Anatomy Outlook
- 5.4. Market Size & Forecasts and Trend Analyses, 2018 to 2030 for the following
- 5.4.1. Knee Osteoarthritis
- 5.4.1.1. Market estimates and forecasts 2018 to 2030 (USD Million)
- 5.4.2. Hip Osteoarthritis
- 5.4.2.1. Market estimates and forecasts 2018 to 2030 (USD Million)
- 5.4.3. Hand Osteoarthritis
- 5.4.3.1. Market estimates and forecasts 2018 to 2030 (USD Million)
- 5.4.4. Others
- 5.4.4.1. Market estimates and forecasts 2018 to 2030 (USD Million)
- 5.4.1. Knee Osteoarthritis
Chapter 6. Global Osteoarthritis Injectables Market: End-use Estimates & Trend Analysis
- 6.1. End-use Market Share, 2023 & 2030
- 6.2. Segment Dashboard
- 6.3. Global Osteoarthritis Injectables Market by End-use Outlook
- 6.4. Market Size & Forecasts and Trend Analyses, 2018 to 2030 for the following
- 6.4.1. Hospital Pharmacies
- 6.4.1.1. Market estimates and forecasts 2018 to 2030 (USD Million)
- 6.4.2. Retail Pharmacies
- 6.4.2.1. Market estimates and forecasts 2018 to 2030 (USD Million)
- 6.4.3. Others
- 6.4.3.1. Market estimates and forecasts 2018 to 2030 (USD Million)
- 6.4.1. Hospital Pharmacies
Chapter 7. Global Osteoarthritis Injectables Market: Regional Estimates & Trend Analysis by
- 7.1. Regional Market Dashboard
- 7.2. Market Size, & Forecasts Trend Analysis, 2018 to 2030:
- 7.3. North America
- 7.3.1. U.S.
- 7.3.1.1. Key country dynamics
- 7.3.1.2. Regulatory framework/ reimbursement structure
- 7.3.1.3. Competitive scenario
- 7.3.1.4. U.S. market estimates and forecasts 2018 to 2030 (USD Million)
- 7.3.2. Canada
- 7.3.2.1. Key country dynamics
- 7.3.2.2. Regulatory framework/ reimbursement structure
- 7.3.2.3. Competitive scenario
- 7.3.2.4. Canada market estimates and forecasts 2018 to 2030 (USD Million)
- 7.3.1. U.S.
- 7.4. Europe
- 7.4.1. UK
- 7.4.1.1. Key country dynamics
- 7.4.1.2. Regulatory framework/ reimbursement structure
- 7.4.1.3. Competitive scenario
- 7.4.1.4. UK market estimates and forecasts 2018 to 2030 (USD Million)
- 7.4.2. Germany
- 7.4.2.1. Key country dynamics
- 7.4.2.2. Regulatory framework/ reimbursement structure
- 7.4.2.3. Competitive scenario
- 7.4.2.4. Germany market estimates and forecasts 2018 to 2030 (USD Million)
- 7.4.3. France
- 7.4.3.1. Key country dynamics
- 7.4.3.2. Regulatory framework/ reimbursement structure
- 7.4.3.3. Competitive scenario
- 7.4.3.4. France market estimates and forecasts 2018 to 2030 (USD Million)
- 7.4.4. Italy
- 7.4.4.1. Key country dynamics
- 7.4.4.2. Regulatory framework/ reimbursement structure
- 7.4.4.3. Competitive scenario
- 7.4.4.4. Italy market estimates and forecasts 2018 to 2030 (USD Million)
- 7.4.5. Spain
- 7.4.5.1. Key country dynamics
- 7.4.5.2. Regulatory framework/ reimbursement structure
- 7.4.5.3. Competitive scenario
- 7.4.5.4. Spain market estimates and forecasts 2018 to 2030 (USD Million)
- 7.4.6. Norway
- 7.4.6.1. Key country dynamics
- 7.4.6.2. Regulatory framework/ reimbursement structure
- 7.4.6.3. Competitive scenario
- 7.4.6.4. Norway market estimates and forecasts 2018 to 2030 (USD Million)
- 7.4.7. Sweden
- 7.4.7.1. Key country dynamics
- 7.4.7.2. Regulatory framework/ reimbursement structure
- 7.4.7.3. Competitive scenario
- 7.4.7.4. Sweden market estimates and forecasts 2018 to 2030 (USD Million)
- 7.4.8. Denmark
- 7.4.8.1. Key country dynamics
- 7.4.8.2. Regulatory framework/ reimbursement structure
- 7.4.8.3. Competitive scenario
- 7.4.8.4. Denmark market estimates and forecasts 2018 to 2030 (USD Million)
- 7.4.1. UK
- 7.5. Asia Pacific
- 7.5.1. Japan
- 7.5.1.1. Key country dynamics
- 7.5.1.2. Regulatory framework/ reimbursement structure
- 7.5.1.3. Competitive scenario
- 7.5.1.4. Japan market estimates and forecasts 2018 to 2030 (USD Million)
- 7.5.2. China
- 7.5.2.1. Key country dynamics
- 7.5.2.2. Regulatory framework/ reimbursement structure
- 7.5.2.3. Competitive scenario
- 7.5.2.4. China market estimates and forecasts 2018 to 2030 (USD Million)
- 7.5.3. India
- 7.5.3.1. Key country dynamics
- 7.5.3.2. Regulatory framework/ reimbursement structure
- 7.5.3.3. Competitive scenario
- 7.5.3.4. India market estimates and forecasts 2018 to 2030 (USD Million)
- 7.5.4. Australia
- 7.5.4.1. Key country dynamics
- 7.5.4.2. Regulatory framework/ reimbursement structure
- 7.5.4.3. Competitive scenario
- 7.5.4.4. Australia market estimates and forecasts 2018 to 2030 (USD Million)
- 7.5.5. South Korea
- 7.5.5.1. Key country dynamics
- 7.5.5.2. Regulatory framework/ reimbursement structure
- 7.5.5.3. Competitive scenario
- 7.5.5.4. South Korea market estimates and forecasts 2018 to 2030 (USD Million)
- 7.5.6. Thailand
- 7.5.6.1. Key country dynamics
- 7.5.6.2. Regulatory framework/ reimbursement structure
- 7.5.6.3. Competitive scenario
- 7.5.6.4. Thailand market estimates and forecasts 2018 to 2030 (USD Million)
- 7.5.1. Japan
- 7.6. Latin America
- 7.6.1. Brazil
- 7.6.1.1. Key country dynamics
- 7.6.1.2. Regulatory framework/ reimbursement structure
- 7.6.1.3. Competitive scenario
- 7.6.1.4. Brazil market estimates and forecasts 2018 to 2030 (USD Million)
- 7.6.2. Mexico
- 7.6.2.1. Key country dynamics
- 7.6.2.2. Regulatory framework/ reimbursement structure
- 7.6.2.3. Competitive scenario
- 7.6.2.4. Mexico market estimates and forecasts 2018 to 2030 (USD Million)
- 7.6.3. Argentina
- 7.6.3.1. Key country dynamics
- 7.6.3.2. Regulatory framework/ reimbursement structure
- 7.6.3.3. Competitive scenario
- 7.6.3.4. Argentina market estimates and forecasts 2018 to 2030 (USD Million)
- 7.6.1. Brazil
- 7.7. MEA
- 7.7.1. South Africa
- 7.7.1.1. Key country dynamics
- 7.7.1.2. Regulatory framework/ reimbursement structure
- 7.7.1.3. Competitive scenario
- 7.7.1.4. South Africa market estimates and forecasts 2018 to 2030 (USD Million)
- 7.7.2. Saudi Arabia
- 7.7.2.1. Key country dynamics
- 7.7.2.2. Regulatory framework/ reimbursement structure
- 7.7.2.3. Competitive scenario
- 7.7.2.4. Saudi Arabia market estimates and forecasts 2018 to 2030 (USD Million)
- 7.7.3. UAE
- 7.7.3.1. Key country dynamics
- 7.7.3.2. Regulatory framework/ reimbursement structure
- 7.7.3.3. Competitive scenario
- 7.7.3.4. UAE market estimates and forecasts 2018 to 2030 (USD Million)
- 7.7.4. Kuwait
- 7.7.4.1. Key country dynamics
- 7.7.4.2. Regulatory framework/ reimbursement structure
- 7.7.4.3. Competitive scenario
- 7.7.4.4. Kuwait market estimates and forecasts 2018 to 2030 (USD Million)
- 7.7.1. South Africa
Chapter 8. Competitive Landscape
- 8.1. Recent Developments & Impact Analysis, By Key Market Participants
- 8.2. Company/Competition Categorization
- 8.3. Vendor Landscape
- 8.3.1. List of key distributors and channel partners
- 8.3.2. Key customers
- 8.3.3. Key company market share analysis, 2023
- 8.3.4. Anika Therapeutics, Inc.
- 8.3.4.1. Company overview
- 8.3.4.2. Financial performance
- 8.3.4.3. Injection Type benchmarking
- 8.3.4.4. Strategic initiatives
- 8.3.5. Bioventus.
- 8.3.5.1. Company overview
- 8.3.5.2. Financial performance
- 8.3.5.3. Injection Type benchmarking
- 8.3.5.4. Strategic initiatives
- 8.3.6. Ferring Pharmaceuticals Inc.
- 8.3.6.1. Company overview
- 8.3.6.2. Financial performance
- 8.3.6.3. Injection Type benchmarking
- 8.3.6.4. Strategic initiatives
- 8.3.7. Sanofi S.A.
- 8.3.7.1. Company overview
- 8.3.7.2. Financial performance
- 8.3.7.3. Injection Type benchmarking
- 8.3.7.4. Strategic initiatives
- 8.3.8. Flexion Therapeutics, Inc.
- 8.3.8.1. Company overview
- 8.3.8.2. Financial performance
- 8.3.8.3. Injection Type benchmarking
- 8.3.8.4. Strategic initiatives
- 8.3.9. Zimmer Biomet
- 8.3.9.1. Company overview
- 8.3.9.2. Financial performance
- 8.3.9.3. Injection Type benchmarking
- 8.3.9.4. Strategic initiatives
- 8.3.10. Arthrex, Inc.
- 8.3.10.1. Company overview
- 8.3.10.2. Financial performance
- 8.3.10.3. Injection Type benchmarking
- 8.3.10.4. Strategic initiatives
- 8.3.11. Royal Biologics
- 8.3.11.1. Company overview
- 8.3.11.2. Financial performance
- 8.3.11.3. Injection Type benchmarking
- 8.3.11.4. Strategic initiatives
- 8.3.12. Teva Pharmaceutical Industries Ltd.
- 8.3.12.1. Company overview
- 8.3.12.2. Financial performance
- 8.3.12.3. Injection Type benchmarking
- 8.3.12.4. Strategic initiatives

