|
|
市場調査レポート
商品コード
1493453
半導体用化学品の市場規模、シェア、動向分析レポート:用途別、タイプ別、地域別、セグメント予測、2024~2030年Semiconductor Chemicals Market Size, Share & Trends Analysis Report By End-use (Discrete Semiconductor, Optoelectronics), By Type (High-performance Polymers, Adhesives, Solvents), By Region, And Segment Forecasts, 2024 - 2030 |
||||||
|
|||||||
カスタマイズ可能
|
|||||||

| 半導体用化学品の市場規模、シェア、動向分析レポート:用途別、タイプ別、地域別、セグメント予測、2024~2030年 |
|
出版日: 2024年05月16日
発行: Grand View Research
ページ情報: 英文 120 Pages
納期: 2~10営業日
|

全表示
- 概要
- 図表
- 目次
半導体用化学品市場の成長と動向:
Grand View Research, Inc.の最新レポートによると、世界の半導体用化学品市場規模は、2024年から2030年にかけて11.9%のCAGRを記録し、2030年には280億米ドルに達すると予測されています。
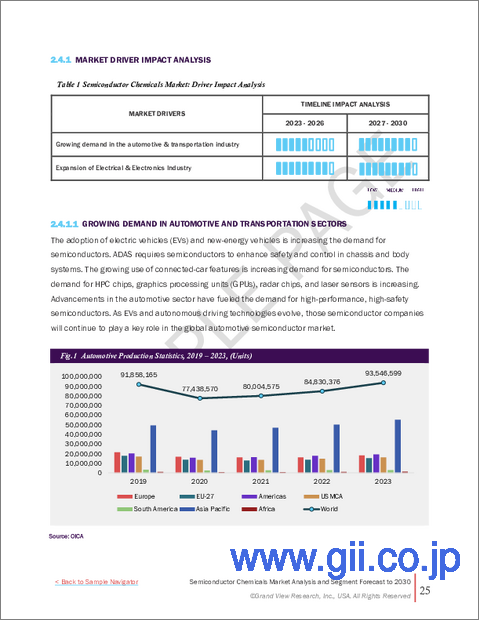
この成長の背景には、自動車などの最終用途製品やタブレット、携帯電話などの消費者向け電子製品に対する需要の増加があります。モノのインターネット(IoT)、人工知能(AI)、自律走行車、5G通信などの新しい技術やアプリケーションの出現が、半導体薬品の需要を押し上げています。これらの技術は、その機能を実現するために高度なマイクロプロセッサー・チップを必要とします。
例えば、AIやIoTデバイスはセンサー、プロセッサー、メモリーチップに依存しており、これらの製造には特殊な化学薬品が必要となります。様々な産業でこれらの技術の採用が増加しているため、半導体化学メーカーには需要の増加に対応する機会が生まれています。持続可能性は市場の重要な動向となっています。企業は環境への影響を軽減するため、環境にやさしく持続可能な材料の開発にますます力を入れるようになっています。これには、グリーン溶剤の使用、廃棄物発生量の削減、よりクリーンな製造プロセスの採用などが含まれます。
また、資源消費と廃棄物発生を最小限に抑えるため、リサイクルや循環型経済への取り組みも模索されています。北米地域の半導体用化学品市場は、同地域の強固な研究開発能力、強力な知的財産権保護、高度な製造技術へのアクセスから恩恵を受けています。技術革新を重視するこの地域は、高度に熟練した労働力と相まって、マイクロプロセッサチップ用化学品市場の成長と競争力向上に貢献しています。加えて、北米はアジア太平洋などの半導体サプライチェーンにおける他地域との緊密な連携により、世界市場での地位をさらに強化しています。
半導体用化学品市場レポートハイライト
- 高性能ポリマー分野は、熱安定性、耐薬品性、機械的強度など、これらのポリマーの優れた特性により、多様な用途での使用が可能になるため、2024年から2030年にかけてCAGR 12%以上で最も急速に成長すると推定されます。
- オプトエレクトロニクス分野は、通信、自動車、ヘルスケアなどの分野での消費拡大により、2024年から2030年までのCAGRが約12.4%と最も速くなると予想されています。
- 北米は、エレクトロニクス、自動車、その他の産業分野などのエンドユーザー産業の著しい成長により、2024年から2030年にかけて最も速いCAGR 12.8%を記録すると予想されます。
- 半導体産業の新しい国や地域への進出は、サプライチェーンの安全性、持続可能性、補助金などの要因に影響されます。企業は、単一市場への依存を避けるため、サプライチェーンの強靭性を向上させ、世界な足跡を拡大しようとしています。
目次
第1章 調査手法と範囲
第2章 エグゼクティブサマリー
第3章 半導体用化学品市場の変数、動向、範囲
- 市場系統の見通し
- 世界の化学品市場の見通し
- 業界バリューチェーン分析
- 流通チャネル分析
- 原材料の動向
- 技術概要
- 規制の枠組み
- 市場力学
- 市場 促進要因分析
- 市場抑制要因分析
- 業界の課題
- 業界の機会
- 業界分析ツール
- ポーターのファイブフォース分析
- マクロ環境分析
第4章 半導体用化学品市場:タイプ推定・動向分析
- タイプ変動分析と市場シェア、2023年と2030年
- タイプ別、2018年から2030年
- 高性能ポリマー
- 酸・塩基化学薬品
- 接着剤
- 溶剤
- その他
第5章 半導体用化学品市場:最終用途の推定・動向分析
- 最終用途変動分析と市場シェア、2023年と2030年
- 最終用途別、2018年から2030年
- 集積回路
- ディスクリート半導体
- オプトエレクトロニクス
- センサー
第6章 半導体用化学品市場:地域推定・動向分析
- 地域変動分析と市場シェア、2023年と2030年
- 北米
- 北米の半導体用化学品市場の推定・予測、2018年-2030年
- 米国
- カナダ
- メキシコ
- 欧州
- 欧州の半導体用化学品市場の推定・予測、2018年-2030年
- ドイツ
- 英国
- フランス
- イタリア
- スペイン
- アジア太平洋地域
- アジア太平洋地域の半導体用化学品市場の推定・予測、2018年-2030年
- 中国
- 日本
- インド
- 韓国
- 台湾
- 中南米
- 中南米の半導体用化学品市場の推定・予測、2018年-2030年
- ブラジル
- アルゼンチン
- 中東・アフリカ
- 中東およびアフリカの半導体用化学品市場の推定・予測、2018年-2030年
- サウジアラビア
- 南アフリカ
第7章 半導体用化学品市場-競合情勢
- 主要市場参入企業による最近の動向と影響分析
- 企業分類
- 企業の市場シェア/ポジション分析、2023年
- 企業ヒートマップ分析
- 戦略マッピング
- 拡大
- 合併と買収
- パートナーシップとコラボレーション
- 新しいタイプの発売
- 研究開発
- 企業プロファイル
- Taiwan Semiconductor Integrated Circuits Company Limited
- BASF SE
- Eastman Chemical Company
- FUJIFILM Corporation
- Honeywell International Inc.
- Linde PLC
- Solvay
- VWR International, LLC.
- Entegris
- SK Inc.
List of Tables
- Table 1 List of abbreviations
- Table 2 Global chemicals market, 2018 - 2030 (Kilo Tons) (USD Million)
- Table 3 Global semiconductor chemicals market estimates and forecasts by type, 2018 - 2030 (Kilo Tons)
- Table 4 Global semiconductor chemicals market estimates and forecasts by type, 2018 - 2030 (USD Million)
- Table 5 Global semiconductor chemicals market estimates and forecasts by end-use, 2018 - 2030 (Kilo Tons)
- Table 6 Global semiconductor chemicals market estimates and forecasts by end-use, 2018 - 2030 (USD Million)
- Table 7 Global semiconductor chemicals market estimates and forecasts by region, 2018 - 2030 (Kilo Tons)
- Table 8 Global semiconductor chemicals market estimates and forecasts by region, 2018 - 2030 (USD Million)
- Table 9 North America semiconductor chemicals market by type, 2018 - 2030 (Kilo Tons)
- Table 10 North America semiconductor chemicals market by type, 2018 - 2030 (USD Million)
- Table 11 North America semiconductor chemicals market by end-use, 2018 - 2030 (Kilo Tons)
- Table 12 North America semiconductor chemicals market by end-use, 2018 - 2030 (USD Million)
- Table 13 U.S. semiconductor chemicals market by type, 2018 - 2030 (Kilo Tons)
- Table 14 U.S. semiconductor chemicals market by type, 2018 - 2030 (USD Million)
- Table 15 U.S. semiconductor chemicals market by end-use, 2018 - 2030 (Kilo Tons)
- Table 16 U.S. semiconductor chemicals market by end-use, 2018 - 2030 (USD Million)
- Table 17 Canada semiconductor chemicals market by type, 2018 - 2030 (Kilo Tons)
- Table 18 Canada semiconductor chemicals market by type, 2018 - 2030 (USD Million)
- Table 19 Canada semiconductor chemicals market by end-use, 2018 - 2030 (Kilo Tons)
- Table 20 Canada semiconductor chemicals market by end-use, 2018 - 2030 (USD Million)
- Table 21 Mexico semiconductor chemicals market by type, 2018 - 2030 (Kilo Tons)
- Table 22 Mexico semiconductor chemicals market by type, 2018 - 2030 (USD Million)
- Table 23 Mexico semiconductor chemicals market by end-use, 2018 - 2030 (Kilo Tons)
- Table 24 Mexico semiconductor chemicals market by end-use, 2018 - 2030 (USD Million)
- Table 25 Europe semiconductor chemicals market by type, 2018 - 2030 (Kilo Tons)
- Table 26 Europe semiconductor chemicals market by type, 2018 - 2030 (USD Million)
- Table 27 Europe semiconductor chemicals market by end-use, 2018 - 2030 (Kilo Tons)
- Table 28 Europe semiconductor chemicals market by end-use, 2018 - 2030 (USD Million)
- Table 29 Germany semiconductor chemicals market by type, 2018 - 2030 (Kilo Tons)
- Table 30 Germany semiconductor chemicals market by type, 2018 - 2030 (USD Million)
- Table 31 Germany semiconductor chemicals market by end-use, 2018 - 2030 (Kilo Tons)
- Table 32 Germany semiconductor chemicals market by end-use, 2018 - 2030 (USD Million)
- Table 33 UK semiconductor chemicals market by type, 2018 - 2030 (Kilo Tons)
- Table 34 UK semiconductor chemicals market by type, 2018 - 2030 (USD Million)
- Table 35 UK semiconductor chemicals market by end-use, 2018 - 2030 (Kilo Tons)
- Table 36 UK semiconductor chemicals market by end-use, 2018 - 2030 (USD Million)
- Table 37 France semiconductor chemicals market by type, 2018 - 2030 (Kilo Tons)
- Table 38 France semiconductor chemicals market by type, 2018 - 2030 (USD Million)
- Table 39 France semiconductor chemicals market by end-use, 2018 - 2030 (Kilo Tons)
- Table 40 France semiconductor chemicals market by end-use, 2018 - 2030 (USD Million)
- Table 41 Italy semiconductor chemicals market by type, 2018 - 2030 (Kilo Tons)
- Table 42 Italy semiconductor chemicals market by type, 2018 - 2030 (USD Million)
- Table 43 Italy semiconductor chemicals market by end-use, 2018 - 2030 (Kilo Tons)
- Table 44 Italy semiconductor chemicals market by end-use, 2018 - 2030 (USD Million)
- Table 45 Spain semiconductor chemicals market by type, 2018 - 2030 (Kilo Tons)
- Table 46 Spain semiconductor chemicals market by type, 2018 - 2030 (USD Million)
- Table 47 Spain semiconductor chemicals market by end-use, 2018 - 2030 (Kilo Tons)
- Table 48 Spain semiconductor chemicals market by end-use, 2018 - 2030 (USD Million)
- Table 49 Asia Pacific semiconductor chemicals market by type, 2018 - 2030 (Kilo Tons)
- Table 50 Asia Pacific semiconductor chemicals market by type, 2018 - 2030 (USD Million)
- Table 51 Asia Pacific semiconductor chemicals market by end-use, 2018 - 2030 (Kilo Tons)
- Table 52 Asia Pacific semiconductor chemicals market by end-use, 2018 - 2030 (USD Million)
- Table 53 China semiconductor chemicals market by type, 2018 - 2030 (Kilo Tons)
- Table 54 China semiconductor chemicals market by type, 2018 - 2030 (USD Million)
- Table 55 China semiconductor chemicals market by end-use, 2018 - 2030 (Kilo Tons)
- Table 56 China semiconductor chemicals market by end-use, 2018 - 2030 (USD Million)
- Table 57 India semiconductor chemicals market by type, 2018 - 2030 (Kilo Tons)
- Table 58 India semiconductor chemicals market by type, 2018 - 2030 (USD Million)
- Table 59 India semiconductor chemicals market by end-use, 2018 - 2030 (Kilo Tons)
- Table 60 India semiconductor chemicals market by end-use, 2018 - 2030 (USD Million)
- Table 61 Japan semiconductor chemicals market by type, 2018 - 2030 (Kilo Tons)
- Table 62 Japan semiconductor chemicals market by type, 2018 - 2030 (USD Million)
- Table 63 Japan semiconductor chemicals market by end-use, 2018 - 2030 (Kilo Tons)
- Table 64 Japan semiconductor chemicals market by end-use, 2018 - 2030 (USD Million)
- Table 65 South Korea semiconductor chemicals market by type, 2018 - 2030 (Kilo Tons)
- Table 66 South Korea semiconductor chemicals market by type, 2018 - 2030 (USD Million)
- Table 67 South Korea semiconductor chemicals market by end-use, 2018 - 2030 (Kilo Tons)
- Table 68 South Korea semiconductor chemicals market by end-use, 2018 - 2030 (USD Million)
- Table 69 Taiwan semiconductor chemicals market by type, 2018 - 2030 (Kilo Tons)
- Table 70 Taiwan semiconductor chemicals market by type, 2018 - 2030 (USD Million)
- Table 71 Taiwan semiconductor chemicals market by end-use, 2018 - 2030 (Kilo Tons)
- Table 72 Taiwan semiconductor chemicals market by end-use, 2018 - 2030 (USD Million)
- Table 73 Central & South America semiconductor chemicals market by type, 2018 - 2030 (Kilo Tons)
- Table 74 Central & South America semiconductor chemicals market by type, 2018 - 2030 (USD Million)
- Table 75 Central & South America semiconductor chemicals market by end-use, 2018 - 2030 (Kilo Tons)
- Table 76 Central & South America semiconductor chemicals market by end-use, 2018 - 2030 (USD Million)
- Table 77 Brazil semiconductor chemicals market by type, 2018 - 2030 (Kilo Tons)
- Table 78 Brazil semiconductor chemicals market by type, 2018 - 2030 (USD Million)
- Table 79 Brazil semiconductor chemicals market by end-use, 2018 - 2030 (Kilo Tons)
- Table 80 Brazil semiconductor chemicals market by end-use, 2018 - 2030 (USD Million)
- Table 81 Argentina semiconductor chemicals market by type, 2018 - 2030 (Kilo Tons)
- Table 82 Argentina semiconductor chemicals market by type, 2018 - 2030 (USD Million)
- Table 83 Argentina semiconductor chemicals market by end-use, 2018 - 2030 (Kilo Tons)
- Table 84 Argentina semiconductor chemicals market by end-use, 2018 - 2030 (USD Million)
- Table 85 Middle East & Africa semiconductor chemicals market by type, 2018 - 2030 (Kilo Tons)
- Table 86 Middle East & Africa semiconductor chemicals market by type, 2018 - 2030 (USD Million)
- Table 87 Middle East & Africa semiconductor chemicals market by end-use, 2018 - 2030 (Kilo Tons)
- Table 88 Middle East & Africa semiconductor chemicals market by end-use, 2018 - 2030 (USD Million)
- Table 89 Saudi Arabia semiconductor chemicals market by type, 2018 - 2030 (Kilo Tons)
- Table 90 Saudi Arabia semiconductor chemicals market by type, 2018 - 2030 (USD Million)
- Table 91 Saudi Arabia semiconductor chemicals market by end-use, 2018 - 2030 (Kilo Tons)
- Table 92 Saudi Arabia semiconductor chemicals market by end-use, 2018 - 2030 (USD Million)
- Table 93 South Africa semiconductor chemicals market by type, 2018 - 2030 (Kilo Tons)
- Table 94 South Africa semiconductor chemicals market by type, 2018 - 2030 (USD Million)
- Table 95 South Africa semiconductor chemicals market by end-use, 2018 - 2030 (Kilo Tons)
- Table 96 South Africa semiconductor chemicals market by end-use, 2018 - 2030 (USD Million)
List of Figures
- Fig. 1 Market research end-use
- Fig. 2 Data triangulation techniques
- Fig. 3 Primary research pattern
- Fig. 4 Market research approaches
- Fig. 5 QFD modeling for market share assessment
- Fig. 6 Information Optoelectronics
- Fig. 7 Market Formulation and Validation
- Fig. 8 Data Validating & Publishing
- Fig. 9 Market Segmentation & Scope
- Fig. 10 Semiconductor Chemicals Market Snapshot
- Fig. 11 Segment Snapshot (1/2)
- Fig. 12 Segment Snapshot (2/2)
- Fig. 13 Competitive Landscape Snapshot
- Fig. 14 Chemicals market outlook
- Fig. 15 Semiconductor Chemicals Market Value, 2023 (USD Million)
- Fig. 16 Semiconductor Chemicals Market - Value Chain Analysis
- Fig. 17 Semiconductor Chemicals Market - Price Trend Analysis 2018 - 2030 (USD/Kg)
- Fig. 18 Semiconductor Chemicals Market - Market Dynamics
- Fig. 19 Semiconductor Chemicals Market - PORTER's Analysis
- Fig. 20 Semiconductor Chemicals Market - PESTEL Analysis
- Fig. 21 Semiconductor Chemicals Market Estimates & Forecasts, By Type: Key Takeaways
- Fig. 22 Semiconductor Chemicals Market Share, By Type, 2023 & 2030
- Fig. 23 Semiconductor Chemicals Market Estimates & Forecasts, 2018 - 2030 (Kilo Tons) (USD Million)
- Fig. 24 High Performance Polymers Market Estimates & Forecasts, 2018 - 2030 (Kilo Tons) (USD Million)
- Fig. 25 Acid & Base Chemicals Market Estimates & Forecasts, 2018 - 2030 (Kilo Tons) (USD Million)
- Fig. 26 Adhesives Market Estimates & Forecasts, 2018 - 2030 (Kilo Tons) (USD Million)
- Fig. 27 Solvents Market Estimates & Forecasts, 2018 - 2030 (Kilo Tons) (USD Million)
- Fig. 28 Other Semiconductor Chemicals Market Estimates & Forecasts, 2018 - 2030 (Kilo Tons) (USD Million)
- Fig. 29 Semiconductor Chemicals Market Estimates & Forecasts, By End-Use: Key Takeaways
- Fig. 30 Semiconductor Chemicals Market Share, By End-Use, 2023 & 2030
- Fig. 31 Semiconductor Chemicals Market Estimates & Forecasts, in Integrated Circuits, 2018 - 2030 (Kilo Tons) (USD Million)
- Fig. 32 Semiconductor Chemicals Market Estimates & Forecasts, in Discrete Semiconductor, 2018 - 2030 (Kilo Tons) (USD Million)
- Fig. 33 Semiconductor Chemicals Market Estimates & Forecasts, in Optoelectronics, 2018 - 2030 (Kilo Tons) (USD Million)
- Fig. 34 Semiconductor Chemicals Market Estimates & Forecasts, in Sensors, 2018 - 2030 (Kilo Tons) (USD Million)
- Fig. 35 Semiconductor Chemicals Market Revenue, By Region, 2023 & 2030 (USD Million)
- Fig. 36 North America Semiconductor Chemicals Market Estimates & Forecasts, 2018 - 2030 (Kilo Tons) (USD Million)
- Fig. 37 U.S. Semiconductor Chemicals Market Estimates & Forecasts, 2018 - 2030 (Kilo Tons) (USD Million)
- Fig. 38 Canada Semiconductor Chemicals Market Estimates & Forecasts, 2018 - 2030 (Kilo Tons) (USD Million)
- Fig. 39 Mexico Semiconductor Chemicals Market Estimates & Forecasts, 2018 - 2030 (Kilo Tons) (USD Million)
- Fig. 40 Europe Semiconductor Chemicals Market Estimates & Forecasts, 2018 - 2030 (Kilo Tons) (USD Million)
- Fig. 41 Germany Semiconductor Chemicals Market Estimates & Forecasts, 2018 - 2030 (Kilo Tons) (USD Million)
- Fig. 42 UK Semiconductor Chemicals Market Estimates & Forecasts, 2018 - 2030 (Kilo Tons) (USD Million)
- Fig. 43 France Semiconductor Chemicals Market Estimates & Forecasts, 2018 - 2030 (Kilo Tons) (USD Million)
- Fig. 44 Italy Semiconductor Chemicals Market Estimates & Forecasts, 2018 - 2030 (Kilo Tons) (USD Million)
- Fig. 45 Spain Semiconductor Chemicals Market Estimates & Forecasts, 2018 - 2030 (Kilo Tons) (USD Million)
- Fig. 46 Asia Pacific Semiconductor Chemicals Market Estimates & Forecasts, 2018 - 2030 (Kilo Tons) (USD Million)
- Fig. 47 China Semiconductor Chemicals Market Estimates & Forecasts, 2018 - 2030 (Kilo Tons) (USD Million)
- Fig. 48 India Semiconductor Chemicals Market Estimates & Forecasts, 2018 - 2030 (Kilo Tons) (USD Million)
- Fig. 49 Japan Semiconductor Chemicals Market Estimates & Forecasts, 2018 - 2030 (Kilo Tons) (USD Million)
- Fig. 50 South Korea Semiconductor Chemicals Market Estimates & Forecasts, 2018 - 2030 (Kilo Tons) (USD Million)
- Fig. 51 Taiwan Semiconductor Chemicals Market Estimates & Forecasts, 2018 - 2030 (Kilo Tons) (USD Million)
- Fig. 52 Central & South America Semiconductor Chemicals Market Estimates & Forecasts, 2018 - 2030 (Kilo Tons) (USD Million)
- Fig. 53 Brazil Semiconductor Chemicals Market Estimates & Forecasts, 2018 - 2030 (Kilo Tons) (USD Million)
- Fig. 54 Argentina Semiconductor Chemicals Market Estimates & Forecasts, 2018 - 2030 (Kilo Tons) (USD Million)
- Fig. 55 Middle East & Africa Semiconductor Chemicals Market Estimates & Forecasts, 2018 - 2030 (Kilo Tons) (USD Million)
- Fig. 56 Saudi Arabia Semiconductor Chemicals Market Estimates & Forecasts, 2018 - 2030 (Kilo Tons) (USD Million)
- Fig. 57 South Africa Semiconductor Chemicals Market Estimates & Forecasts, 2018 - 2030 (Kilo Tons) (USD Million)
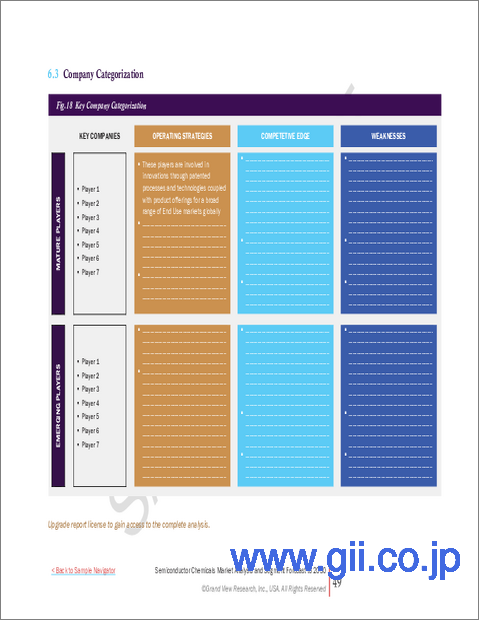
- Fig. 58 Key Company Categorization
- Fig. 59 Company Market Positioning
- Fig. 60 Key Company Market Share Analysis, 2023
- Fig. 61 Strategy Mapping
Semiconductor Chemicals Market Growth & Trends:
The global semiconductor chemicals market size is anticipated to reach USD 28.0 billion by 2030, registering a CAGR of 11.9% from 2024 to 2030, according to a new report by Grand View Research, Inc. The growth is attributed to the growing demand for end-use products, such as automotive, and consumer electronic products, such as tablets and mobile phones. The emergence of new technologies and applications, such as the Internet of Things (IoT), artificial intelligence (AI), autonomous vehicles, and 5G communication, is driving the demand for semiconductor chemicals. These technologies require advanced microprocessor chips to enable their functionality.
For example, AI and IoT devices rely on sensors, processors, and memory chips, all of which require specialized chemicals for their fabrication. The increasing adoption of these technologies across various industries creates opportunities for semiconductor chemical manufacturers to cater to the growing demand. Sustainability has become a key trend in the market. Companies are increasingly focusing on developing environmentally friendly and sustainable materials to reduce their environmental impact. This includes the use of green solvents, reducing waste generation, and adopting cleaner manufacturing processes.
The industry is also exploring recycling and circular economy initiatives to minimize resource consumption and waste generation. The North America regional market for semiconductor chemicals benefits from the region's robust R&D capabilities, strong intellectual property protection, and access to advanced manufacturing technologies. The region's emphasis on innovation, coupled with a highly skilled workforce, contributes to the growth and competitiveness of the microprocessor chips chemicals market. In addition, North America's close collaboration with other regions, such as Asia Pacific, in the semiconductor supply chain further strengthens its position in the global market.
Semiconductor Chemicals Market Report Highlights:
- The high-performance polymers segment is estimated to grow at the fastest CAGR of more than 12% from 2024 to 2030 owing to the exceptional properties of these polymers, such as thermal stability, chemical resistance, and mechanical strength, enabling them to be used in diverse applications
- The optoelectronics segment is expected to witness the fastest CAGR of approximately 12.4% from 2024 to 2030 due to the growing consumption in sectors, such as telecommunications, automotive, and healthcare
- North America is expected to register the fastest CAGR of 12.8% from 2024 to 2030 due to the significant growth in end-user industries, such as electronics, automotive, and other industrial sectors
- The semiconductor industry's expansion into new countries or regions is influenced by factors, such as supply chain security, sustainability, and subsidies. Companies are seeking to improve their supply chain resilience and expand their global footprint to avoid dependence on a single market
Table of Contents
Chapter 1. Methodology and Scope
- 1.1. Market Segmentation & Scope
- 1.2. Market Definition
- 1.3. Information Optoelectronics
- 1.3.1. Purchased Database
- 1.3.2. GVR's Internal Database
- 1.3.3. Secondary Sources & Third-Party Perspectives
- 1.3.4. Primary Research
- 1.4. Information Analysis
- 1.4.1. Data Analysis Models
- 1.5. Market Formulation & Data Visualization
- 1.6. Data Validation & Publishing
Chapter 2. Executive Summary
- 2.1. Market Snapshot
- 2.2. Segment Snapshot
- 2.3. Competitive Landscape Snapshot
Chapter 3. Semiconductor Chemicals Market Variables, Trends & Scope
- 3.1. Market Lineage Outlook
- 3.1.1. Global Chemicals Market Outlook
- 3.2. Industry Value Chain Analysis
- 3.2.1. Distribution Channel Analysis
- 3.2.2. Raw Material Trends
- 3.2.3. Technological Overview
- 3.3. Regulatory Framework
- 3.4. Market Dynamics
- 3.4.1. Market Driver Analysis
- 3.4.2. Market Restraint Analysis
- 3.4.3. Industry Challenges
- 3.4.4. Industry Opportunities
- 3.5. Industry Analysis Tools
- 3.5.1. Porter's Five Forces Analysis
- 3.5.2. Macro-environmental Analysis
Chapter 4. Semiconductor Chemicals Market: Type Estimates & Trend Analysis
- 4.1. Type Movement Analysis & Market Share, 2023 & 2030
- 4.2. Semiconductor Chemicals Market Estimates & Forecast, By Type, 2018 to 2030 (Kilo Tons) (USD Million)
- 4.3. High-performance Polymers
- 4.3.1. High-performance Polymers Market Estimates and Forecasts, 2018 - 2030 (Kilo Tons) (USD Million)
- 4.4. Acid & Base Chemicals
- 4.4.1. Acid & Base Chemicals Market Estimates and Forecasts, 2018 - 2030 (Kilo Tons) (USD Million)
- 4.5. Adhesives
- 4.5.1. Adhesives Market Estimates and Forecasts, 2018 - 2030 (Kilo Tons) (USD Million)
- 4.6. Solvents
- 4.6.1. Solvents Market Estimates and Forecasts, 2018 - 2030 (Kilo Tons) (USD Million)
- 4.7. Others
- 4.7.1. Other Semiconductor Chemicals Market Estimates and Forecasts, 2018 - 2030 (Kilo Tons) (USD Million)
Chapter 5. Semiconductor Chemicals Market: End-use Estimates & Trend Analysis
- 5.1. End-use Movement Analysis & Market Share, 2023 & 2030
- 5.2. Semiconductor Chemicals Market Estimates & Forecast, By End-use, 2018 to 2030 (Kilo Tons) (USD Million)
- 5.3. Integrated Circuits
- 5.3.1. Semiconductor Chemicals Market Estimates and Forecasts in Integrated Circuits, 2018 - 2030 (Kilo Tons) (USD Million)
- 5.4. Discrete Semiconductor
- 5.4.1. Semiconductor Chemicals Market Estimates and Forecasts in Discrete Semiconductor, 2018 - 2030 (Kilo Tons) (USD Million)
- 5.5. Optoelectronics
- 5.5.1. Semiconductor Chemicals Market Estimates and Forecasts in Optoelectronics, 2018 - 2030 (Kilo Tons) (USD Million)
- 5.6. Sensors
- 5.6.1. Semiconductor Chemicals Market Estimates and Forecasts in Sensors, 2018 - 2030 (Kilo Tons) (USD Million)
Chapter 6. Semiconductor Chemicals Market: Regional Estimates & Trend Analysis
- 6.1. Regional Movement Analysis & Market Share, 2023 & 2030
- 6.2. North America
- 6.2.1. North America Semiconductor Chemicals Market Estimates & Forecast, 2018 - 2030 (Kilo Tons) (USD Million)
- 6.2.2. U.S.
- 6.2.2.1. Key country dynamics
- 6.2.2.2. U.S. Semiconductor Chemicals Market Estimates & Forecast, 2018 - 2030 (Kilo Tons) (USD Million)
- 6.2.3. Canada
- 6.2.3.1. Key Country Dynamics
- 6.2.3.2. Canada Semiconductor Chemicals Market Estimates & Forecast, 2018 - 2030 (Kilo Tons) (USD Million)
- 6.2.4. Mexico
- 6.2.4.1. Key Country Dynamics
- 6.2.4.2. Mexico Semiconductor Chemicals Market Estimates & Forecast, 2018 - 2030 (Kilo Tons) (USD Million)
- 6.3. Europe
- 6.3.1. Europe Semiconductor Chemicals Market Estimates & Forecast, 2018 - 2030 (Kilo Tons) (USD Million)
- 6.3.2. Germany
- 6.3.2.1. Key Country Dynamics
- 6.3.2.2. Germany Semiconductor Chemicals Market Estimates & Forecast, 2018 - 2030 (Kilo Tons) (USD Million)
- 6.3.3. UK
- 6.3.3.1. Key Country Dynamics
- 6.3.3.2. UK Semiconductor Chemicals Market Estimates & Forecast, 2018 - 2030 (Kilo Tons) (USD Million)
- 6.3.4. France
- 6.3.4.1. Key Country Dynamics
- 6.3.4.2. France Semiconductor Chemicals Market Estimates & Forecast, 2018 - 2030 (Kilo Tons) (USD Million)
- 6.3.5. Italy
- 6.3.5.1. Key Country Dynamics
- 6.3.5.2. Italy Semiconductor Chemicals Market Estimates & Forecast, 2018 - 2030 (Kilo Tons) (USD Million)
- 6.3.6. Spain
- 6.3.6.1. Key Country Dynamics
- 6.3.6.2. Spain Semiconductor Chemicals Market Estimates & Forecast, 2018 - 2030 (Kilo Tons) (USD Million)
- 6.4. Asia Pacific
- 6.4.1. Asia Pacific Semiconductor Chemicals Market Estimates & Forecast, 2018 - 2030 (Kilo Tons) (USD Million)
- 6.4.2. China
- 6.4.2.1. Key Country Dynamics
- 6.4.2.2. China Semiconductor Chemicals Market Estimates & Forecast, 2018 - 2030 (Kilo Tons) (USD Million)
- 6.4.3. Japan
- 6.4.3.1. Key Country Dynamics
- 6.4.3.2. Japan Semiconductor Chemicals Market Estimates & Forecast, 2018 - 2030 (Kilo Tons) (USD Million)
- 6.4.4. India
- 6.4.4.1. Key Country Dynamics
- 6.4.4.2. India Semiconductor Chemicals Market Estimates & Forecast, 2018 - 2030 (Kilo Tons) (USD Million)
- 6.4.5. South Korea
- 6.4.5.1. Key Country Dynamics
- 6.4.5.2. South Korea Semiconductor Chemicals Market Estimates & Forecast, 2018 - 2030 (Kilo Tons) (USD Million)
- 6.4.6. Taiwan
- 6.4.6.1. Key Country Dynamics
- 6.4.6.2. Taiwan Semiconductor Chemicals Market Estimates & Forecast, 2018 - 2030 (Kilo Tons) (USD Million)
- 6.5. Central & South America
- 6.5.1. Central & South America Semiconductor Chemicals Market Estimates & Forecast, 2018 - 2030 (Kilo Tons) (USD Million)
- 6.5.2. Brazil
- 6.5.2.1. Key Country Dynamics
- 6.5.2.2. Brazil Semiconductor Chemicals Market Estimates & Forecast, 2018 - 2030 (Kilo Tons) (USD Million)
- 6.5.3. Argentina
- 6.5.3.1. Key Country Dynamics
- 6.5.3.2. Argentina Semiconductor Chemicals Market Estimates & Forecast, 2018 - 2030 (Kilo Tons) (USD Million)
- 6.6. Middle East & Africa
- 6.6.1. Middle East & Africa Semiconductor Chemicals Market Estimates & Forecast, 2018 - 2030 (Kilo Tons) (USD Million)
- 6.6.2. Saudi Arabia
- 6.6.2.1. Key Country Dynamics
- 6.6.2.2. Saudi Arabia Semiconductor Chemicals Market Estimates & Forecast, 2018 - 2030 (Kilo Tons) (USD Million)
- 6.6.3. South Africa
- 6.6.3.1. Key Country Dynamics
- 6.6.3.2. South Africa Semiconductor Chemicals Market Estimates & Forecast, 2018 - 2030 (Kilo Tons) (USD Million)
Chapter 7. Semiconductor Chemicals Market - Competitive Landscape
- 7.1. Recent Developments & Impact Analysis, By Key Market Participants
- 7.2. Company Categorization
- 7.3. Company Market Share/Position Analysis, 2023
- 7.4. Company Heat Map Analysis
- 7.5. Strategy Mapping
- 7.5.1. Expansion
- 7.5.2. Mergers & Acquisition
- 7.5.3. Partnerships & Collaborations
- 7.5.4. New Type Launches
- 7.5.5. Research And Development
- 7.6. Company Profiles
- 7.6.1. Taiwan Semiconductor Integrated Circuits Company Limited
- 7.6.1.1. Participant's overview
- 7.6.1.2. Financial performance
- 7.6.1.3. Type benchmarking
- 7.6.1.4. Recent developments
- 7.6.2. BASF SE
- 7.6.2.1. Participant's overview
- 7.6.2.2. Financial performance
- 7.6.2.3. Type benchmarking
- 7.6.2.4. Recent developments
- 7.6.3. Eastman Chemical Company
- 7.6.3.1. Participant's overview
- 7.6.3.2. Financial performance
- 7.6.3.3. Type benchmarking
- 7.6.3.4. Recent developments
- 7.6.4. FUJIFILM Corporation
- 7.6.4.1. Participant's overview
- 7.6.4.2. Financial performance
- 7.6.4.3. Type benchmarking
- 7.6.4.4. Recent developments
- 7.6.5. Honeywell International Inc.
- 7.6.5.1. Participant's overview
- 7.6.5.2. Financial performance
- 7.6.5.3. Type benchmarking
- 7.6.5.4. Recent developments
- 7.6.6. Linde PLC
- 7.6.6.1. Participant's overview
- 7.6.6.2. Financial performance
- 7.6.6.3. Type benchmarking
- 7.6.6.4. Recent developments
- 7.6.7. Solvay
- 7.6.7.1. Participant's overview
- 7.6.7.2. Financial performance
- 7.6.7.3. Type benchmarking
- 7.6.7.4. Recent developments
- 7.6.8. VWR International, LLC.
- 7.6.8.1. Participant's overview
- 7.6.8.2. Financial performance
- 7.6.8.3. Type benchmarking
- 7.6.8.4. Recent developments
- 7.6.9. Entegris
- 7.6.9.1. Participant's overview
- 7.6.9.2. Financial performance
- 7.6.9.3. Type benchmarking
- 7.6.9.4. Recent developments
- 7.6.10. SK Inc.
- 7.6.10.1. Participant's overview
- 7.6.10.2. Financial performance
- 7.6.10.3. Type benchmarking
- 7.6.10.4. Recent developments
- 7.6.1. Taiwan Semiconductor Integrated Circuits Company Limited

