|
|
市場調査レポート
商品コード
1493450
シンクライアントの市場規模、シェア、動向分析レポート:タイプ別、フォームファクター別、用途別、地域別、セグメント予測、2024年~2030年Thin Client Market Size, Share & Trends Analysis Report By Type (Hardware, Software, Services), By Form Factor (Standalone, With Monitor, Mobile), By Application, By Region, And Segment Forecasts, 2024 - 2030 |
||||||

|
|||||||
カスタマイズ可能
|
|||||||

| シンクライアントの市場規模、シェア、動向分析レポート:タイプ別、フォームファクター別、用途別、地域別、セグメント予測、2024年~2030年 |
|
出版日: 2024年05月15日
発行: Grand View Research
ページ情報: 英文 120 Pages
納期: 2~10営業日
|

全表示
- 概要
- 図表
- 目次
シンクライアント市場の成長と動向:
Grand View Research, Inc.の最新レポートによると、世界のシンクライアント市場規模は2030年までに19億7,000万米ドルに達し、2024年から2030年までのCAGRは3.0%で拡大すると予測されています。
サイバーセキュリティとデータ保護への関心の高まりが、シンクライアント技術の採用を促進しています。サイバー脅威の頻度と巧妙さが増す中、企業は機密情報を保護する安全なコンピューティング・ソリューションを優先しています。シンクライアント技術は、データの集中保存、セキュアなブートプロセス、リモート管理機能など、強化されたセキュリティ機能を提供し、不正アクセスやデータ漏洩のリスクを低減します。サイバーセキュリティへの関心の高まりは、規制要件やデータ保護法に合致しており、さまざまな業界でシンクライアント・ソリューションの需要を促進しています。
さらに、クラウド・コンピューティングと仮想化技術の普及が、市場の技術革新を促進しています。企業がITインフラをクラウドに移行し、デスクトップ仮想化ソリューションを採用することで、シンクライアントはクラウドでホストされるアプリケーションや仮想デスクトップ環境にアクセスできるようになります。最新のシンクライアント・デバイスは、処理能力の向上、グラフィック機能の改善、高速ワイヤレス接続のサポートを提供し、シンクライアント・エンドポイントからデスクトップと同様の体験をユーザーに提供します。このクラウド・コンピューティングとシンクライアント技術の融合は、デジタルトランスフォーメーションの取り組みをサポートし、さまざまな分野での採用を促進します。
規制コンプライアンスに関連するアプリケーション近代化の重要な側面には、近代化されたアプリケーションがHIPAA、PCI DSS、GDPR、その他の地域または部門固有の規制などの関連法規に準拠しなければならない互換性の確保、近代化イニシアチブが機密データを保護し不正アクセスを防止するための堅牢な対策を組み込む必要があるデータプライバシーと保護などがあります。
シンクライアント市場レポートハイライト
- タイプ別では、アプリケーションハードウェアセグメントが2023年に38.4%の最高収益シェアを占め、予測期間中もその地位を維持すると予測されます。シンクライアントハードウェアは、クラウドコンピューティングや仮想化技術との互換性があるため、クラウドホスト型アプリケーションや仮想デスクトップ環境へのアクセスが可能になり、採用が進んでいます。
- フォームファクター別では、2023年にモバイル・セグメントが市場を席巻し、予測期間中も大幅なCAGRで成長する見込みです。主要なエンドポイントとしてモバイルデバイスの採用が増加しているため、モバイルプラットフォーム向けにカスタマイズされたシンクライアントソリューションの需要が高まっており、生産性を維持しながらデスクトップ環境とモバイル環境のシームレスな移行が可能になっています。
- アプリケーション別では、ヘルスケア分野が予測期間中に大きく成長する見込みです。遠隔医療や遠隔患者モニタリングの採用拡大が、ヘルスケアにおけるシンクライアント・ソリューションの需要を促進しており、データのプライバシーと機密性を確保しながら、遠隔地からの仮想診察や患者データへの安全なアクセスを可能にしています。
目次
第1章 調査手法と範囲
第2章 エグゼクティブサマリー
第3章 シンクライアント市場の変数、動向、範囲
- 市場系統の見通し
- 親市場の見通し
- 関連/付随市場の見通し
- 市場力学
- 市場牽引要因分析
- 市場抑制要因分析
- 市場機会分析
- シンクライアント市場分析ツール
- 業界分析- ポーターのファイブフォース分析
- PESTEL分析
第4章 シンクライアント市場:タイプの推定・動向分析
- セグメントダッシュボード
- シンクライアント市場:タイプの変動分析、2023年および2030年
- ハードウェア
- ソフトウェア
- サービス
第5章 シンクライアント市場: フォームファクタの推定・動向分析
- セグメントダッシュボード
- シンクライアント市場:フォームファクタ変動分析、2023年および2030年
- スタンドアロン
- モニター付き
- モバイル
第6章 シンクライアント市場: 用途の推定・動向分析
- セグメントダッシュボード
- シンクライアント市場:用途変動分析、2023年および2030年
- ヘルスケア
- 小売り
- 教育
- BFSI
- 政府
- その他
第7章 シンクライアント市場:地域推定・動向分析
- 地域別市場シェア分析、2023年および2030年
- 地域市場ダッシュボード
- 地域市場のスナップショット
- 市場規模と予測動向分析、2017年から2030年
- 北米
- シンクライアント市場推計・予測、2017年-2030年
- 米国
- カナダ
- 欧州
- 欧州のシンクライアント市場推計・予測、2017年-2030年
- 英国
- ドイツ
- フランス
- イタリア
- スペイン
- オランダ
- アジア太平洋地域
- アジア太平洋地域のシンクライアント市場推計・予測、2017年-2030年
- 中国
- 日本
- インド
- 韓国
- オーストラリア
- ラテンアメリカ
- ラテンアメリカのシンクライアント市場推計・予測、2017年-2030年
- ブラジル
- メキシコ
- アルゼンチン
- 中東・アフリカ
- 中東およびアフリカのシンクライアント市場推計・予測、2017年-2030年
- アラブ首長国連邦
- サウジアラビア
- 南アフリカ
第8章 競合情勢
- 主要市場参入企業による最近の動向と影響分析
- 企業分類
- 企業の市場ポジショニング
- 企業ヒートマップ分析
- 戦略マッピング
- 拡大
- 合併と買収
- パートナーシップとコラボレーション
- 新製品の発売
- 研究開発
- 企業プロファイル
- IBM
- Accenture
- Infosys
- Cognizant
- Capgemini
- Tata Consultancy Services
- DXC Technology
- HCL Technologies
- Wipro
- NTT DATA Corporation
List of Tables
- Table 1 List of abbreviations
- Table 2 Global thin client market 2017 - 2030 (USD Million)
- Table 3 Global thin client market estimates and forecasts by region, 2017 - 2030 (USD Million)
- Table 4 Global thin client market estimates and forecasts by type, 2017 - 2030 (USD Million)
- Table 5 Global thin client market estimates and forecasts by form factor, 2017 - 2030 (USD Million)
- Table 6 Global thin client market estimates and forecasts by application, 2017 - 2030 (USD Million)
- Table 7 North America thin client market, by region, 2017 - 2030 (USD Million)
- Table 8 North America thin client market, by type, 2017 - 2030 (USD Million)
- Table 9 North America thin client market, by form factor, 2017 - 2030 (USD Million)
- Table 10 North America thin client market, by application, 2017 - 2030 (USD Million)
- Table 11 U.S. thin client market, by type, 2017 - 2030 (USD Million)
- Table 12 U.S. thin client market, by form factor, 2017 - 2030 (USD Million)
- Table 13 U.S. thin client market, by application, 2017 - 2030 (USD Million)
- Table 14 Canada thin client market, by type, 2017 - 2030 (USD Million)
- Table 15 Canada thin client market, by form factor, 2017 - 2030 (USD Million)
- Table 16 Canada thin client market, by application, 2017 - 2030 (USD Million)
- Table 17 Europe thin client market, by region, 2017 - 2030 (USD Million)
- Table 18 Europe thin client market, by type, 2017 - 2030 (USD Million)
- Table 19 Europe thin client market, by form factor, 2017 - 2030 (USD Million)
- Table 20 Europe thin client market, by application, 2017 - 2030 (USD Million)
- Table 21 UK thin client market, by type, 2017 - 2030 (USD Million)
- Table 22 UK thin client market, by form factor, 2017 - 2030 (USD Million)
- Table 23 UK thin client market, by application, 2017 - 2030 (USD Million)
- Table 24 France thin client market, by type, 2017 - 2030 (USD Million)
- Table 25 France thin client market, by form factor, 2017 - 2030 (USD Million)
- Table 26 France thin client market, by application, 2017 - 2030 (USD Million)
- Table 27 Spain thin client market, by type, 2017 - 2030 (USD Million)
- Table 28 Spain thin client market, by form factor, 2017 - 2030 (USD Million)
- Table 29 Spain thin client market, by application, 2017 - 2030 (USD Million)
- Table 30 Germany thin client market, by type, 2017 - 2030 (USD Million)
- Table 31 Germany thin client market, by form factor, 2017 - 2030 (USD Million)
- Table 32 Germany thin client market, by application, 2017 - 2030 (USD Million)
- Table 33 Italy thin client market, by type, 2017 - 2030 (USD Million)
- Table 34 Italy thin client market, by form factor, 2017 - 2030 (USD Million)
- Table 35 Italy thin client market, by application, 2017 - 2030 (USD Million)
- Table 36 Netherlands thin client market, by type, 2017 - 2030 (USD Million)
- Table 37 Netherlands thin client market, by form factor, 2017 - 2030 (USD Million)
- Table 38 Netherlands thin client market, by application, 2017 - 2030 (USD Million)
- Table 39 Asia Pacific thin client market, by region, 2017 - 2030 (USD Million)
- Table 40 Asia Pacific thin client market, by type, 2017 - 2030 (USD Million)
- Table 41 Asia Pacific thin client market, by form factor, 2017 - 2030 (USD Million)
- Table 42 Asia Pacific thin client market, by application, 2017 - 2030 (USD Million)
- Table 43 China thin client market, by type, 2017 - 2030 (USD Million)
- Table 44 China thin client market, by form factor, 2017 - 2030 (USD Million)
- Table 45 China thin client market, by application, 2017 - 2030 (USD Million)
- Table 46 Japan thin client market, by type, 2017 - 2030 (USD Million)
- Table 47 Japan thin client market, by form factor, 2017 - 2030 (USD Million)
- Table 48 Japan thin client market, by application, 2017 - 2030 (USD Million)
- Table 49 India thin client market, by type, 2017 - 2030 (USD Million)
- Table 50 India thin client market, by form factor, 2017 - 2030 (USD Million)
- Table 51 India thin client market, by application, 2017 - 2030 (USD Million)
- Table 52 South Korea thin client market, by type, 2017 - 2030 (USD Million)
- Table 53 South Korea thin client market, by form factor, 2017 - 2030 (USD Million)
- Table 54 South Korea thin client market, by application, 2017 - 2030 (USD Million)
- Table 55 Australia thin client market, by type, 2017 - 2030 (USD Million)
- Table 56 Australia thin client market, by form factor, 2017 - 2030 (USD Million)
- Table 57 Australia thin client market, by application, 2017 - 2030 (USD Million)
- Table 58 Latin America thin client market, by region, 2017 - 2030 (USD Million)
- Table 59 Latin America thin client market, by type, 2017 - 2030 (USD Million)
- Table 60 Latin America thin client market, by form factor, 2017 - 2030 (USD Million)
- Table 61 Latin America thin client market, by application, 2017 - 2030 (USD Million)
- Table 62 Brazil thin client market, by type, 2017 - 2030 (USD Million)
- Table 63 Brazil thin client market, by form factor, 2017 - 2030 (USD Million)
- Table 64 Brazil thin client market, by application, 2017 - 2030 (USD Million)
- Table 65 Mexico thin client market, by type, 2017 - 2030 (USD Million)
- Table 66 Mexico thin client market, by form factor, 2017 - 2030 (USD Million)
- Table 67 Mexico thin client market, by application, 2017 - 2030 (USD Million)
- Table 68 Argentina thin client market, by type, 2017 - 2030 (USD Million)
- Table 69 Argentina thin client market, by form factor, 2017 - 2030 (USD Million)
- Table 70 Argentina thin client market, by application, 2017 - 2030 (USD Million)
- Table 71 Middle East & Africa thin client market, by region, 2017 - 2030 (USD Million)
- Table 72 Middle East & Africa thin client market, by type, 2017 - 2030 (USD Million)
- Table 73 Middle East & Africa thin client market, by form factor, 2017 - 2030 (USD Million)
- Table 74 Middle East & Africa thin client market, by application, 2017 - 2030 (USD Million)
- Table 75 UAE thin client market, by type, 2017 - 2030 (USD Million)
- Table 76 UAE thin client market, by form factor, 2017 - 2030 (USD Million)
- Table 77 UAE thin client market, by application, 2017 - 2030 (USD Million)
- Table 78 Saudi Arabia thin client market, by type, 2017 - 2030 (USD Million)
- Table 79 Saudi Arabia thin client market, by form factor, 2017 - 2030 (USD Million)
- Table 80 Saudi Arabia thin client market, by application, 2017 - 2030 (USD Million)
- Table 81 South Africa thin client market, by type, 2017 - 2030 (USD Million)
- Table 82 South Africa thin client market, by form factor, 2017 - 2030 (USD Million)
- Table 83 South Africa thin client market, by application, 2017 - 2030 (USD Million)
List of Figures
- Fig. 1 Market research process
- Fig. 2 Thin client market segmentation
- Fig. 3 Thin client market technology landscape
- Fig. 4 Information procurement
- Fig. 5 Data analysis models
- Fig. 6 Market formulation and validation
- Fig. 7 Data validating & publishing
- Fig. 8 Market snapshot
- Fig. 9 Segment snapshot (1/2)
- Fig. 10 Segment snapshot (2/2)
- Fig. 11 Competitive landscape snapshot
- Fig. 12 Thin client market size and growth prospects (USD Million)
- Fig. 13 Thin client market: Industry value chain analysis
- Fig. 14 Thin client market: Market dynamics
- Fig. 15 Thin client market: PORTER's analysis
- Fig. 16 Thin client market: PESTEL analysis
- Fig. 17 Thin client market: Type movement analysis
- Fig. 18 Thin client market: Type outlook and key takeaways
- Fig. 19 Hardware market estimates and forecast, 2017 - 2030
- Fig. 20 Software market estimates and forecast, 2017 - 2030
- Fig. 21 Services market estimates and forecast, 2017 - 2030
- Fig. 22 Thin Client market: Form factor movement analysis
- Fig. 23 Thin Client market: Form factor outlook and key takeaways
- Fig. 24 Standalone market estimates and forecast, 2017 - 2030
- Fig. 25 With monitor market estimates and forecast, 2017 - 2030
- Fig. 26 Mobile market estimates and forecast, 2017 - 2030
- Fig. 27 Thin Client market: Application movement analysis
- Fig. 28 Thin Client market: Application outlook and key takeaways
- Fig. 29 Healthcare market estimates and forecast, 2017 - 2030
- Fig. 30 Retail market estimates and forecast, 2017 - 2030
- Fig. 31 Education market estimates and forecast, 2017 - 2030
- Fig. 32 BFSI market estimates and forecast, 2017 - 2030
- Fig. 33 Government market estimates and forecast, 2017 - 2030
- Fig. 34 Others market estimates and forecast, 2017 - 2030
- Fig. 35 North America thin client market: Regional movement analysis
- Fig. 36 North America thin client market: Regional outlook and key takeaways
- Fig. 37 U.S. thin client market estimates and forecasts, 2017 - 2030
- Fig. 38 Canada thin client market estimates and forecasts, 2017 - 2030
- Fig. 39 Europe thin client market: Regional movement analysis
- Fig. 40 Europe thin client market: Regional outlook and key takeaways
- Fig. 41 UK thin client market estimates and forecasts, 2017 - 2030
- Fig. 42 France thin client market estimates and forecasts, 2017 - 2030
- Fig. 43 Germany thin client market estimates and forecasts, 2017 - 2030
- Fig. 44 Italy thin client market estimates and forecasts, 2017 - 2030
- Fig. 45 Spain thin client market estimates and forecasts, 2017 - 2030
- Fig. 46 Netherlands market estimates and forecasts, 2017 - 2030
- Fig. 47 Asia Pacific thin client market: Regional movement analysis
- Fig. 48 Asia Pacific thin client market: Regional outlook and key takeaways
- Fig. 49 China thin client market estimates and forecasts, 2017 - 2030
- Fig. 50 Japan thin client market estimates and forecasts, 2017 - 2030
- Fig. 51 India thin client market estimates and forecasts, 2017 - 2030
- Fig. 52 South Korea thin client market estimates and forecasts, 2017 - 2030
- Fig. 53 Australia thin client market estimates and forecasts, 2017 - 2030
- Fig. 54 Latin America thin client market: Regional movement analysis
- Fig. 55 Latin America thin client market: Regional outlook and key takeaways
- Fig. 56 Brazil thin client market estimates and forecasts, 2017 - 2030
- Fig. 57 Mexico thin client market estimates and forecasts, 2017 - 2030
- Fig. 58 Argentina thin client market estimates and forecasts, 2017 - 2030
- Fig. 59 Middle East & Africa thin client market: Regional movement analysis
- Fig. 60 Middle East & Africa thin client market: Regional outlook and key takeaways
- Fig. 61 UAE thin client market estimates and forecasts, 2017 - 2030
- Fig. 62 Saudi Arabia thin client market estimates and forecasts, 2017 - 2030
- Fig. 63 South Africa thin client market estimates and forecasts, 2017 - 2030
- Fig. 64 Key company categorization
- Fig. 65 Company market positioning
- Fig. 66 Key company market share analysis, 2023
- Fig. 67 Strategic framework
Thin Client Market Growth & Trends:
The global thin client market size is anticipated to reach USD 1.97 billion by 2030, expanding at a CAGR of 3.0% from 2024 to 2030, according to a new report by Grand View Research, Inc. The growing focus on cybersecurity and data protection is driving the adoption of thin client technology. With the escalating frequency and sophistication of cyber threats, organizations prioritize secure computing solutions that safeguard sensitive information. Thin client technology offers enhanced security features such as centralized data storage, secure boot processes, and remote management capabilities, reducing the risk of unauthorized access and data breaches. Its heightened focus on cybersecurity aligns with regulatory requirements and data protection laws, driving demand for thin client solutions across various industries.
Additionally, the proliferation of cloud computing and virtualization technologies is driving innovation in the market. As organizations migrate their IT infrastructure to the cloud and adopt desktop virtualization solutions, thin clients can access cloud-hosted applications and virtual desktop environments. Modern thin client devices offer enhanced processing power, improved graphics capabilities, and support for high-speed wireless connectivity, providing users with a desktop-like experience from thin client endpoints. This convergence of cloud computing and thin client technology supports digital transformation efforts and drives adoption across various sectors.
Critical aspects of application modernization that relate to regulatory compliance include Ensuring Compatibility where Modernized applications must conform to relevant legislation, such as HIPAA, PCI DSS, GDPR, and other regional or sector-specific regulations; Data Privacy and Protection in which Modernization initiatives should incorporate robust measures to protect sensitive data and prevent unauthorized access.
Thin Client Market Report Highlights:
- Based on type, the application hardware segment accounted for the highest revenue share of 38.4% in 2023 and is expected to retain its position over the forecast period. Thin client hardware's compatibility with cloud computing and virtualization technologies is driving adoption, enabling access to cloud-hosted applications and virtual desktop environments.
- Based on form factor, the mobile segment dominated the market in 2023 and is also expected to grow at a significant CAGR over the forecast period. Increasing adoption of mobile devices as primary endpoints is driving demand for thin client solutions tailored for mobile platforms, enabling seamless transition between desktop and mobile environments while maintaining productivity.
- Based on application, the healthcare segment is expected to witness significant growth during the forecast period. The growing adoption of telemedicine and remote patient monitoring is fueling demand for thin client solutions in healthcare, enabling secure access to virtual consultations and patient data from remote locations while ensuring data privacy and confidentiality.
Table of Contents
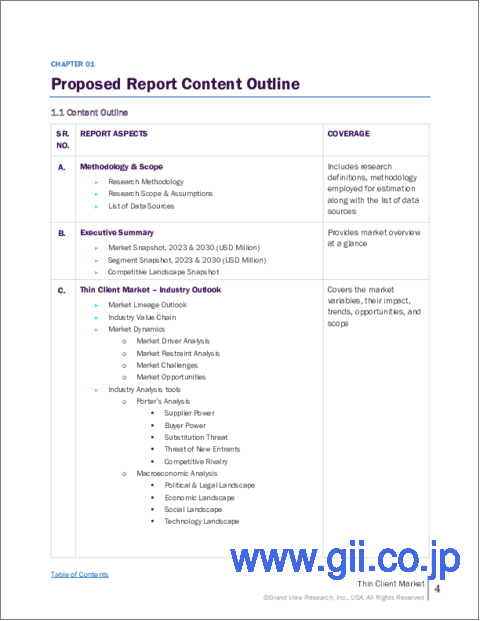
Chapter 1. Methodology and Scope
- 1.1. Market Segmentation & Scope
- 1.2. Segment Definitions
- 1.2.1. Type
- 1.2.2. Form factor
- 1.2.3. Application
- 1.2.4. Regional scope
- 1.2.5. Estimates and forecasts timeline
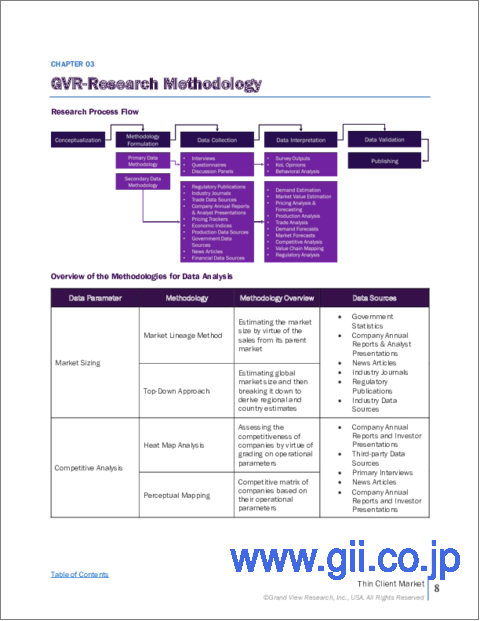
- 1.3. Research Methodology
- 1.3.1. Information Procurement
- 1.3.2. Information or Data Analysis
- 1.3.3. Market Formulation & Data Visualization
- 1.3.4. Data Validation & Publishing
- 1.4. Research Scope and Assumptions
- 1.5. List of Data Sources
Chapter 2. Executive Summary
- 2.1. Market Outlook
- 2.2. Segment Outlook
- 2.2.1. Type outlook
- 2.2.2. Form factor outlook
- 2.2.3. Application outlook
- 2.3. Competitive Insights
Chapter 3. Thin Client Market Variables, Trends & Scope
- 3.1. Market Lineage Outlook
- 3.1.1. Parent market outlook
- 3.1.2. Related/ancillary market outlook
- 3.2. Market Dynamics
- 3.2.1. Market driver analysis
- 3.2.1.1. Rising need for enhanced cybersecurity measures
- 3.2.1.2. The proliferation of Internet of Things (IoT) devices and the need for seamless integration with existing infrastructure
- 3.2.2. Market restraint analysis
- 3.2.2.1. Budget constraints and limited IT resources
- 3.2.2.2. Compatibility issues with legacy applications and peripherals
- 3.2.3. Market opportunity analysis
- 3.2.1. Market driver analysis
- 3.3. Thin Client Market Analysis Tools
- 3.3.1. Industry Analysis - Porter's
- 3.3.1.1. Supplier power
- 3.3.1.2. Buyer power
- 3.3.1.3. Substitution threat
- 3.3.1.4. Threat of new entrant
- 3.3.1.5. Competitive rivalry
- 3.3.2. PESTEL Analysis
- 3.3.2.1. Political landscape
- 3.3.2.2. Economic landscape
- 3.3.2.3. Social landscape
- 3.3.2.4. Technological landscape
- 3.3.2.5. Environmental landscape
- 3.3.2.6. Legal landscape
- 3.3.1. Industry Analysis - Porter's
Chapter 4. Thin Client Market: Type Estimates & Trend Analysis
- 4.1. Segment Dashboard
- 4.2. Thin Client Market: Vehicle Type Movement Analysis, 2023 & 2030 (USD Million)
- 4.2.1. Hardware
- 4.2.1.1. Hardware market estimates and forecasts 2017 to 2030 (USD Million)
- 4.2.2. Software
- 4.2.2.1. Software market estimates and forecasts 2017 to 2030 (USD Million)
- 4.2.3. Services
- 4.2.3.1. Services market estimates and forecasts 2017 to 2030 (USD Million)
- 4.2.1. Hardware
Chapter 5. Thin Client Market: Form Factor Estimates & Trend Analysis
- 5.1. Segment Dashboard
- 5.2. Thin Client Market: Form Factor Movement Analysis, 2023 & 2030 (USD Million)
- 5.2.1. Standalone
- 5.2.1.1. Standalone market estimates and forecasts 2017 to 2030 (USD Million)
- 5.2.2. With Monitor
- 5.2.2.1. With monitor market estimates and forecasts 2017 to 2030 (USD Million)
- 5.2.3. Mobile
- 5.2.3.1. Mobile Market estimates and forecasts 2017 to 2030 (USD Million)
- 5.2.1. Standalone
Chapter 6. Thin Client Market: Application Estimates & Trend Analysis
- 6.1. Segment Dashboard
- 6.2. Thin Client Market: Application Movement Analysis, 2023 & 2030 (USD Million)
- 6.2.1. Healthcare
- 6.2.1.1. Healthcare market estimates and forecasts 2017 to 2030 (USD Million)
- 6.2.2. Retail
- 6.2.2.1. Retail market estimates and forecasts 2017 to 2030 (USD Million)
- 6.2.3. Education
- 6.2.3.1. Education market estimates and forecasts 2017 to 2030 (USD Million)
- 6.2.4. BFSI
- 6.2.4.1. BFSI market estimates and forecasts 2017 to 2030 (USD Million)
- 6.2.5. Government
- 6.2.5.1. Government market estimates and forecasts 2017 to 2030 (USD Million)
- 6.2.6. Others
- 6.2.6.1. Others market estimates and forecasts 2017 to 2030 (USD Million)
- 6.2.1. Healthcare
Chapter 7. Thin Client Market: Regional Estimates & Trend Analysis
- 7.1. Regional Market Share Analysis, 2023 & 2030
- 7.2. Regional Market Dashboard
- 7.3. Regional Market Snapshot
- 7.4. Market Size, & Forecasts Trend Analysis, 2017 to 2030
- 7.5. North America
- 7.5.1. Thin Client Market Estimates and Forecasts, 2017 - 2030 (USD Million)
- 7.5.2. U.S.
- 7.5.2.1. U.S. thin client market estimates and forecasts 2017 to 2030 (USD Million)
- 7.5.3. Canada
- 7.5.3.1. Canada thin client market estimates and forecasts 2017 to 2030 (USD Million)
- 7.6. Europe
- 7.6.1. Europe thin client market estimates and forecasts, 2017 - 2030 (USD Million)
- 7.6.2. UK
- 7.6.2.1. UK thin client market estimates and forecasts 2017 to 2030 (USD Million)
- 7.6.3. Germany
- 7.6.3.1. Germany thin client market estimates and forecasts 2017 to 2030 (USD Million)
- 7.6.4. France
- 7.6.4.1. France thin client market estimates and forecasts 2017 to 2030 (USD Million)
- 7.6.5. Italy
- 7.6.5.1. Italy thin client market estimates and forecasts 2017 to 2030 (USD Million)
- 7.6.6. Spain
- 7.6.6.1. Spain thin client market estimates and forecasts 2017 to 2030 (USD Million)
- 7.6.7. Netherlands
- 7.6.7.1. Netherlands thin client market estimates and forecasts 2017 to 2030 (USD Million)
- 7.7. Asia Pacific
- 7.7.1. Asia Pacific Thin Client Market Estimates and Forecasts, 2017 - 2030 (USD Million)
- 7.7.2. China
- 7.7.2.1. China thin client market estimates and forecasts 2017 to 2030 (USD Million)
- 7.7.3. Japan
- 7.7.3.1. Japan thin client market estimates and forecasts 2017 to 2030 (USD Million)
- 7.7.4. India
- 7.7.4.1. India thin client market estimates and forecasts 2017 to 2030 (USD Million)
- 7.7.5. South Korea
- 7.7.5.1. South Korea thin client market estimates and forecasts 2017 to 2030 (USD Million)
- 7.7.6. Australia
- 7.7.6.1. Australia thin client market estimates and forecasts 2017 to 2030 (USD Million)
- 7.8. Latin America
- 7.8.1. Latin America Thin Client Market Estimates and Forecasts, 2017 - 2030 (USD Million)
- 7.8.2. Brazil
- 7.8.2.1. Brazil thin client market estimates and forecasts 2017 to 2030 (USD Million)
- 7.8.3. Mexico
- 7.8.3.1. Mexico thin client market estimates and forecasts 2017 to 2030 (USD Million)
- 7.8.4. Argentina
- 7.8.4.1. Argentina thin client market estimates and forecasts 2017 to 2030 (USD Million)
- 7.9. Middle East & Africa
- 7.9.1. Middle East & Africa Thin Client Market Estimates and Forecasts, 2017 - 2030 (USD Million)
- 7.9.2. UAE
- 7.9.2.1. UAE thin client market estimates and forecasts 2017 to 2030 (USD Million)
- 7.9.3. Saudi Arabia
- 7.9.3.1. Saudi Arabia thin client market estimates and forecasts 2017 to 2030 (USD Million)
- 7.9.4. South Africa
- 7.9.4.1. South Africa thin client market estimates and forecasts 2017 to 2030 (USD Million)
Chapter 8. Competitive Landscape
- 8.1. Recent Developments & Impact Analysis, By Key Market Participants
- 8.2. Company Categorization
- 8.3. Company Market Positioning
- 8.4. Company Heat Map Analysis
- 8.5. Strategy Mapping
- 8.5.1. Expansion
- 8.5.2. Mergers & acquisition
- 8.5.3. Partnerships & collaborations
- 8.5.4. New product launches
- 8.5.5. Research and development
- 8.6. Company Profiles
- 8.6.1. IBM
- 8.6.1.1. Company overview
- 8.6.1.2. Financial performance
- 8.6.1.3. Product benchmarking
- 8.6.1.4. Strategic initiatives
- 8.6.2. Accenture
- 8.6.2.1. Company overview
- 8.6.2.2. Financial performance
- 8.6.2.3. Product benchmarking
- 8.6.2.4. Strategic initiatives
- 8.6.3. Infosys
- 8.6.3.1. Company overview
- 8.6.3.2. Financial performance
- 8.6.3.3. Product benchmarking
- 8.6.3.4. Strategic initiatives
- 8.6.4. Cognizant
- 8.6.4.1. Company overview
- 8.6.4.2. Financial performance
- 8.6.4.3. Product benchmarking
- 8.6.4.4. Strategic initiatives
- 8.6.5. Capgemini
- 8.6.5.1. Company overview
- 8.6.5.2. Financial performance
- 8.6.5.3. Product benchmarking
- 8.6.5.4. Strategic initiatives
- 8.6.6. Tata Consultancy Services
- 8.6.6.1. Company overview
- 8.6.6.2. Financial performance
- 8.6.6.3. Product benchmarking
- 8.6.6.4. Strategic initiatives
- 8.6.7. DXC Technology
- 8.6.7.1. Company overview
- 8.6.7.2. Financial performance
- 8.6.7.3. Product benchmarking
- 8.6.7.4. Strategic initiatives
- 8.6.8. HCL Technologies
- 8.6.8.1. Company overview
- 8.6.8.2. Financial performance
- 8.6.8.3. Product benchmarking
- 8.6.8.4. Strategic initiatives
- 8.6.9. Wipro
- 8.6.9.1. Company overview
- 8.6.9.2. Financial performance
- 8.6.9.3. Product benchmarking
- 8.6.9.4. Strategic initiatives
- 8.6.10. NTT DATA Corporation
- 8.6.10.1. Company overview
- 8.6.10.2. Financial performance
- 8.6.10.3. Product benchmarking
- 8.6.10.4. Strategic initiatives
- 8.6.1. IBM
