|
|
市場調査レポート
商品コード
1790475
集束イオンビーム市場規模、シェア、動向分析レポート:タイプ別、用途別、産業別、地域別、セグメント別予測、2025~2030年Focused Ion Beam Market Size, Share & Trends Analysis Report By Type (Ga+ Liquid Metal, Gas Field), By Application (Failure Analysis, Nanofabrication), By Vertical, By Region and Segment Forecasts, 2025 - 2030 |
||||||
|
|||||||
カスタマイズ可能
|
|||||||

| 集束イオンビーム市場規模、シェア、動向分析レポート:タイプ別、用途別、産業別、地域別、セグメント別予測、2025~2030年 |
|
出版日: 2025年07月01日
発行: Grand View Research
ページ情報: 英文 100 Pages
納期: 2~10営業日
|

全表示
- 概要
- 図表
- 目次
集束イオンビーム市場概要
集束イオンビームの世界市場規模は、2024年に15億5,000万米ドルと推定され、2025~2030年にかけてCAGR 7.3%で成長し、2030年には23億6,000万米ドルに達すると予測されています。集束イオンビーム(FIB)市場は、多様な産業における精密材料特性評価、ナノ加工、故障診断の需要増加が主因。
この市場の中心は、集束イオンビーム(一般にガリウム)を用いて、マイクロスケールやナノスケールの材料を画像化、修正、分析するツールです。これらのシステムは、半導体、材料科学、ライフサイエンスなど、高い精度が要求される産業に不可欠です。FIBシステムは、イメージング、ミリング、蒸着、回路編集を行うことができ、多用途な装置となっています。多くの場合、走査型電子顕微鏡と統合してデュアルビームシステムを形成します。この統合は分析能力を高め、応用範囲を広げます。FIB技術の市場は、小型化された高性能部品の需要により成長し続けています。ナノファブリケーションとデバイスの複雑さが増すにつれ、FIBツールは研究と製造環境において不可欠なものとなっています。
半導体セグメントの成長は市場促進要因の一つです。電子デバイスの小型化、複雑化に伴い、FIBのような精密なツールが検査や修正に必要とされています。これらのシステムは、故障分析、プロセス開発、サンプル調製に広く使用されています。また、ナノテクノロジーや先端材料の研究が活発化していることも市場の追い風となっています。生物学的サンプル調製などのライフサイエンス用途も需要に貢献しています。FIBは、さまざまなセグメントのさまざまな材料に対応できることが、市場基盤の拡大を支えています。高分解能イメージングと材料特性評価への関心の高まりが、この需要をさらに後押ししています。
進歩は、FIBシステムの自動化、人工知能、ソフトウェア統合市場にも影響を与えています。これらの機能強化は、複雑な作業の精度、使いやすさ、効率を向上させています。その結果、産業はより先進的分析やプロセスにFIBツールを採用するようになっています。積層造形や量子力学研究における新たな用途は、この技術の範囲を広げています。研究機関と商業メーカーのコラボレーションは、技術革新の推進に役立っています。これらの動向が相まって、将来の市場情勢が形成されつつあります。継続的な研究開発投資により、次世代FIBシステムの開発が加速することが期待されます。
目次
第1章 調査手法と範囲
第2章 エグゼクティブサマリー
第3章 集束イオンビーム市場の変数、動向、範囲
- 市場のイントロダクション/系統展望
- 市場規模と成長展望
- 産業バリューチェーン分析
- 市場力学
- 市場促進要因分析
- 市場抑制要因分析
- 産業の機会
- 産業の課題
- 集束イオンビーム市場分析ツール
- ポーター分析
- PESTEL分析
第4章 集束イオンビーム市場:タイプ別、推定・動向分析
- セグメントダッシュボード
- 集束イオンビーム市場:タイプ変動分析、100万米ドル、2024年と2030年
- Ga+液体金属
- ガス田
- プラズマ
第1章 集束イオンビーム市場:用途別、推定・動向分析
第2章 集束イオンビーム市場:産業推定・動向分析
- セグメントダッシュボード
- 集束イオンビーム市場:産業変動分析、100万米ドル、2024年と2030年
- エレクトロニクスと半導体
- 産業科学
- バイオサイエンス
- 材料科学
第3章 集束イオンビーム市場:地域別、推定・動向分析
- 集束イオンビーム市場シェア(地域別、2024年と2030年)
- 北米
- 用途別、2017~2030年
- 産業別、2017~2030年
- タイプ別、2017~2030年
- 米国
- カナダ
- メキシコ
- 欧州
- 用途別、2017~2030年
- 産業別、2017~2030年
- タイプ別、2017~2030年
- 英国
- ドイツ
- フランス
- アジア太平洋
- 用途別、2017~2030年
- 産業別、2017~2030年
- タイプ別、2017~2030年
- 中国
- 日本
- インド
- オーストラリア
- 韓国
- ラテンアメリカ
- 用途別、2017~2030年
- 産業別、2017~2030年
- タイプ別、2017~2030年
- ブラジル
- 中東・アフリカ
- 用途別、2017~2030年
- 産業別、2017~2030年
- タイプ別、2017~2030年
- アラブ首長国連邦
- 南アフリカ
- サウジアラビア
第4章 競合情勢
- 主要市場参入企業による最近の動向と影響分析
- 企業分類
- 企業の市場ポジショニング
- 企業の市場シェア分析
- 企業ヒートマップ分析
- 戦略マッピング
- 拡大
- 合併と買収
- パートナーシップとコラボレーション
- 新しいコンポーネントの発売
- 研究開発
- 企業プロファイル
- Thermo Fisher Scientific
- Zeiss
- Hitachi High-Technologies Corporation
- JEOL Ltd.
- TESCAN GROUP, as
- Fibics Incorporated
- Raith GmbH
- FOCUS GmbH
- A& D Company, Limited
- Veeco Instruments, Inc.
- Eurofins Scientific
- Delong Instruments Co., Ltd.
List of Tables
- Table 1 FIB - Industry Snapshot & Key Buying Criteria, 2017 - 2030
- Table 2 Global Focused Ion Beam Market, 2017 - 2030 (USD Million)
- Table 3 Global Focused Ion Beam Market Estimates and Forecast by Vertical, 2017 - 2030 (USD Million)
- Table 4 Global Focused Ion Beam Market Estimates and Forecast by Type, 2017 - 2030 (USD Million)
- Table 5 Global Focused Ion Beam Market Estimates and Forecast by Application, 2017 - 2030 (USD Million)
- Table 6 Global Focused Ion Beam Market Estimates and Forecasts by Region, 2017 - 2030 (USD Million)
- Table 7 Focused Ion Beam Market Estimates and Forecast, by Ga+ Liquid Metal, 2017 - 2030 (USD Million)
- Table 8 Focused Ion Beam Market Estimates and Forecast by Gas Field, 2017 - 2030 (USD Million)
- Table 9 Focused Ion Beam Market Estimates and Forecast by Plasma, 2017 - 2030 (USD Million)
- Table 10 Focused Ion Beam Market Estimates and Forecast by Failure Analysis, 2017 - 2030 (USD Million)
- Table 11 Focused Ion Beam Market Estimates and Forecast, by Nanofabrication, 2017 - 2030 (USD Million)
- Table 12 Focused Ion Beam Market Estimates and Forecast by Device Modification, 2017 - 2030 (USD Million)
- Table 13 Focused Ion Beam Market Estimates and Forecast by Circuit Edit, 2017 - 2030 (USD Million)
- Table 14 Focused Ion Beam Market Estimates and Forecast by Counterfeit Detection, 2017 - 2030 (USD Million)
- Table 15 Focused Ion Beam Market Estimates and Forecast by Electronics & Semiconductor, 2017 - 2030 (USD Million)
- Table 16 Focused Ion Beam Market Estimates and Forecast, by Industrial Science, 2017 - 2030 (USD Million)
- Table 17 Focused Ion Beam Market Estimates and Forecast, by Bioscience, 2017 - 2030 (USD Million)
- Table 18 Focused Ion Beam Market Estimates and Forecast, by Material Science, 2017 - 2030 (USD Million)
- Table 19 Focused Ion Beam Market Estimates and Forecast, by Others, 2017 - 2030 (USD Million)
- Table 20 North America Focused Ion Beam Market Estimates and Forecast, 2017 - 2030 (USD Million)
- Table 21 North America Focused Ion Beam Market Estimates and Forecast, by Application, 2017 - 2030 (USD Million)
- Table 22 North America Focused Ion Beam Market Estimates and Forecast, by Vertical, 2017 - 2030 (USD Million)
- Table 23 North America Focused Ion Beam Market Estimates and Forecast, by Type, 2017 - 2030 (USD Million)
- Table 24 U S Focused Ion Beam Market Estimates and Forecast, 2017 - 2030 (USD Million)
- Table 25 U S Focused Ion Beam Market Estimates and Forecast, by Application, 2017 - 2030 (USD Million)
- Table 26 U S Focused Ion Beam Market Estimates and Forecast, by Vertical, 2017 - 2030 (USD Million)
- Table 27 U S Focused Ion Beam Market Estimates and Forecast, by Type, 2017 - 2030 (USD Million)
- Table 28 Canada Focused Ion Beam Market Estimates and Forecast, 2017 - 2030 (USD Million)
- Table 29 Canada Focused Ion Beam Market Estimates and Forecast, by Application, 2017 - 2030 (USD Million)
- Table 30 Canada Focused Ion Beam Market Estimates and Forecast, by Vertical, 2017 - 2030 (USD Million)
- Table 31 Canada Focused Ion Beam Market Estimates and Forecast, by Type, 2017 - 2030 (USD Million)
- Table 32 Mexico Focused Ion Beam Market Estimates and Forecast, by Application, 2017 - 2030 (USD Million)
- Table 33 Mexico Focused Ion Beam Market Estimates and Forecast, by Vertical, 2017 - 2030 (USD Million)
- Table 34 Mexico Focused Ion Beam Market Estimates and Forecast, by Type, 2017 - 2030 (USD Million)
- Table 35 Europe Focused Ion Beam Market Estimates and Forecast, 2017 - 2030 (USD Million)
- Table 36 Europe Focused Ion Beam Market Estimates and Forecast, by Application, 2017 - 2030 (USD Million)
- Table 37 Europe Focused Ion Beam Market Estimates and Forecast, by Vertical, 2017 - 2030 (USD Million)
- Table 38 Europe Focused Ion Beam Market Estimates and Forecast, by Type, 2017 - 2030 (USD Million)
- Table 39 UK Focused Ion Beam Market Estimates and Forecast, 2017 - 2030 (USD Million)
- Table 40 UK Focused Ion Beam Market Estimates and Forecast, by Application, 2017 - 2030 (USD Million)
- Table 41 UK Focused Ion Beam Market Estimates and Forecast, by Vertical, 2017 - 2030 (USD Million)
- Table 42 UK Focused Ion Beam Market Estimates and Forecast, by Type, 2017 - 2030 (USD Million)
- Table 43 Germany Focused Ion Beam Market Estimates and Forecast, 2017 - 2030 (USD Million)
- Table 44 Germany Focused Ion Beam Market Estimates and Forecast, by Application, 2017 - 2030 (USD Million)
- Table 45 Germany Focused Ion Beam Market Estimates and Forecast, by Vertical, 2017 - 2030 (USD Million)
- Table 46 Germany Focused Ion Beam Market Estimates and Forecast, by Type, 2017 - 2030 (USD Million)
- Table 47 France Focused Ion Beam Market Estimates and Forecast, 2017 - 2030 (USD Million)
- Table 48 France Focused Ion Beam Market Estimates and Forecast, by Application, 2017 - 2030 (USD Million)
- Table 49 France Focused Ion Beam Market Estimates and Forecast, by Vertical, 2017 - 2030 (USD Million)
- Table 50 France Focused Ion Beam Market Estimates and Forecast, by Type, 2017 - 2030 (USD Million)
- Table 51 Asia Pacific Focused Ion Beam Market Estimates and Forecast, 2017 - 2030 (USD Million)
- Table 52 Asia Pacific Focused Ion Beam Market Estimates and Forecast, by Application, 2017 - 2030 (USD Million)
- Table 53 Asia Pacific Focused Ion Beam Market Estimates and Forecast, by Vertical, 2017 - 2030 (USD Million)
- Table 54 Asia Pacific Focused Ion Beam Market Estimates and Forecast, by Type, 2017 - 2030 (USD Million)
- Table 55 China Focused Ion Beam Market Estimates and Forecast, 2017 - 2030 (USD Million)
- Table 56 China Focused Ion Beam Market Estimates and Forecast, by Application, 2017 - 2030 (USD Million)
- Table 57 China Focused Ion Beam Market Estimates and Forecast, by Vertical, 2017 - 2030 (USD Million)
- Table 58 China Focused Ion Beam Market Estimates and Forecast, by Type, 2017 - 2030 (USD Million)
- Table 59 Japan Focused Ion Beam Market Estimates and Forecast, 2017 - 2030 (USD Million)
- Table 60 Japan Focused Ion Beam Market Estimates and Forecast, by Application, 2017 - 2030 (USD Million)
- Table 61 Japan Focused Ion Beam Market Estimates and Forecast, by Vertical, 2017 - 2030 (USD Million)
- Table 62 Japan Focused Ion Beam Market Estimates and Forecast, by Type, 2017 - 2030 (USD Million)
- Table 63 India Focused Ion Beam Market Estimates and Forecast, 2017 - 2030 (USD Million)
- Table 64 India Focused Ion Beam Market Estimates and Forecast, by Application, 2017 - 2030 (USD Million)
- Table 65 India Focused Ion Beam Market Estimates and Forecast, by Vertical, 2017 - 2030 (USD Million)
- Table 66 India Focused Ion Beam Market Estimates and Forecast, by Type, 2017 - 2030 (USD Million)
- Table 67 Australia Focused Ion Beam Market Estimates and Forecast, 2017 - 2030 (USD Million)
- Table 68 Australia Focused Ion Beam Market Estimates and Forecast, by Application, 2017 - 2030 (USD Million)
- Table 69 Australia Focused Ion Beam Market Estimates and Forecast, by Vertical, 2017 - 2030 (USD Million)
- Table 70 Australia Focused Ion Beam Market Estimates and Forecast, by Type, 2017 - 2030 (USD Million)
- Table 71 South Korea Focused Ion Beam Market Estimates and Forecast, 2017 - 2030 (USD Million)
- Table 72 South Korea Focused Ion Beam Market Estimates and Forecast, by Application, 2017 - 2030 (USD Million)
- Table 73 South Korea Focused Ion Beam Market Estimates and Forecast, by Vertical, 2017 - 2030 (USD Million)
- Table 74 South Korea Focused Ion Beam Market Estimates and Forecast, by Type, 2017 - 2030 (USD Million)
- Table 75 Latin America Focused Ion Beam Market Estimates and Forecast, 2017 - 2030 (USD Million)
- Table 76 Latin America Focused Ion Beam Market Estimates and Forecast, by Application, 2017 - 2030 (USD Million)
- Table 77 Latin America Focused Ion Beam Market Estimates and Forecast, by Vertical, 2017 - 2030 (USD Million)
- Table 78 Latin America Focused Ion Beam Market Estimates and Forecast, by Type, 2017 - 2030 (USD Million)
- Table 79 Brazil Focused Ion Beam Market Estimates and Forecast, 2017 - 2030 (USD Million)
- Table 80 Brazil Focused Ion Beam Market Estimates and Forecast, by Application, 2017 - 2030 (USD Million)
- Table 81 Brazil Focused Ion Beam Market Estimates and Forecast, by Vertical, 2017 - 2030 (USD Million)
- Table 82 Brazil Focused Ion Beam Market Estimates and Forecast, by Type, 2017 - 2030 (USD Million)
- Table 83 Middle East & Africa Focused Ion Beam Market Estimates and Forecast, 2017 - 2030 (USD Million)
- Table 84 Middle East & Africa Focused Ion Beam Market Estimates and Forecast, by Application, 2017 - 2030 (USD Million)
- Table 85 Middle East & Africa Focused Ion Beam Market Estimates and Forecast, by Vertical, 2017 - 2030 (USD Million)
- Table 86 Middle East & Africa Focused Ion Beam Market Estimates and Forecast, by Type, 2017 - 2030 (USD Million)
- Table 87 UAE Focused Ion Beam Market Estimates and Forecast, 2017 - 2030 (USD Million)
- Table 88 UAE Focused Ion Beam Market Estimates and Forecast, by Application, 2017 - 2030 (USD Million)
- Table 89 UAE Focused Ion Beam Market Estimates and Forecast, by Vertical, 2017 - 2030 (USD Million)
- Table 90 UAE Focused Ion Beam Market Estimates and Forecast, by Type, 2017 - 2030 (USD Million)
- Table 91 South Africa Focused Ion Beam Market Estimates and Forecast, 2017 - 2030 (USD Million)
- Table 92 South Africa Focused Ion Beam Market Estimates and Forecast, by Application, 2017 - 2030 (USD Million)
- Table 93 South Africa Focused Ion Beam Market Estimates and Forecast, by Vertical, 2017 - 2030 (USD Million)
- Table 94 South Africa Focused Ion Beam Market Estimates and Forecast, by Type, 2017 - 2030 (USD Million)
- Table 95 KSA Focused Ion Beam Market Estimates and Forecast, 2017 - 2030 (USD Million)
- Table 96 KSA Focused Ion Beam Market Estimates and Forecast, by Application, 2017 - 2030 (USD Million)
- Table 97 KSA Focused Ion Beam Market Estimates and Forecast, by Vertical, 2017 - 2030 (USD Million)
- Table 98 KSA Focused Ion Beam Market Estimates and Forecast, by Type, 2017 - 2030 (USD Million)
List of Figures
- Fig. 1 Focused Ion Beam Market Segmentation
- Fig. 2 Technology landscape
- Fig. 3 Information Procurement
- Fig. 4 Data Analysis Componentls
- Fig. 5 Market Formulation and Validation
- Fig. 6 Data Validating & Publishing
- Fig. 7 Market Snapshot
- Fig. 8 Segment Snapshot (1/2)
- Fig. 9 Segment Snapshot (2/2)
- Fig. 10 Competitive Landscape Snapshot
- Fig. 11 FIB- Market Size and Growth Prospects (USD Million)
- Fig. 12 Focused Ion Beam Market: Industry Value Chain Analysis
- Fig. 13 Focused Ion Beam Market: Market Dynamics
- Fig. 14 Focused Ion Beam Market: PORTER's Analysis
- Fig. 15 Focused Ion Beam Market: PESTEL Analysis
- Fig. 16 Focused Ion Beam Market Share by Type, 2024 & 2030 (USD Million)
- Fig. 17 Focused Ion Beam Market, by Type: Market Share, 2024 & 2030
- Fig. 18 Ga+ Liquid Metal Market Estimates & Forecasts, 2017 - 2030 (USD Million)
- Fig. 19 Gas Field Market Estimates & Forecasts, 2017 - 2030 (USD Million)
- Fig. 20 Plasma Market Estimates & Forecasts, 2017 - 2030 (USD Million)
- Fig. 21 Focused Ion Beam Market Share by Vertical, 2024 & 2030 (USD Million)
- Fig. 22 Focused Ion Beam Market, by Vertical: Market Share, 2024 & 2030
- Fig. 23 Electronics & Semiconductor Market Estimates & Forecasts, 2017 - 2030 (USD Million)
- Fig. 24 Industrial Science Market Estimates & Forecasts, 2017 - 2030 (USD Million)
- Fig. 25 Bioscience Market Estimates & Forecasts, 2017 - 2030 (USD Million)
- Fig. 26 Material Science Market Estimates & Forecasts, 2017 - 2030 (USD Million)
- Fig. 27 Focused Ion Beam Market Share by Application, 2024 & 2030 (USD Million)
- Fig. 28 Focused Ion Beam Market, by Application: Market Share, 2024 & 2030
- Fig. 29 Failure Analysis Market Estimates & Forecasts, 2017 - 2030 (USD Million)
- Fig. 30 Nanofabrication Market Estimates & Forecasts, 2017 - 2030 (USD Million)
- Fig. 31 Device Modification Market Estimates & Forecasts, 2017 - 2030 (USD Million)
- Fig. 32 Circuit Edit Market Estimates & Forecasts, 2017 - 2030 (USD Million)
- Fig. 33 Counterfeit Detection Market Estimates & Forecasts, 2017 - 2030 (USD Million)
- Fig. 34 Focused Ion Beam Market Revenue, by Region, 2024 & 2030, (USD Million)
- Fig. 35 Regional Marketplace: Key Takeaways
- Fig. 36 Regional Marketplace: Key Takeaways
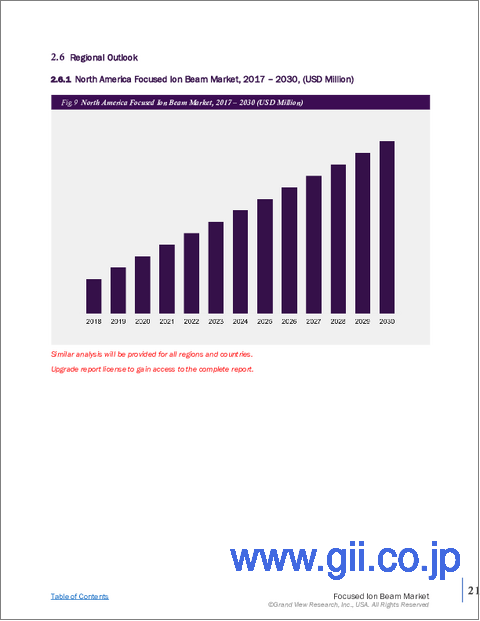
- Fig. 37 North America Focused Ion Beam Market Estimates and Forecasts, 2017 - 2030 (USD Million)
- Fig. 38 U.S Focused Ion Beam Market Estimates and Forecasts, 2017 - 2030 (USD Million)
- Fig. 39 Canada Focused Ion Beam Market Estimates and Forecasts, 2017 - 2030 (USD Million)
- Fig. 40 Mexico Focused Ion Beam Market Estimates and Forecasts, 2017 - 2030 (USD Million)
- Fig. 41 Europe Focused Ion Beam Market Estimates and Forecasts, 2017 - 2030 (USD Million)
- Fig. 42 UK Focused Ion Beam Market Estimates and Forecasts, 2017 - 2030 (USD Million)
- Fig. 43 Germany Focused Ion Beam Market Estimates and Forecasts, 2017 - 2030 (USD Million)
- Fig. 44 France Focused Ion Beam Market Estimates and Forecasts, 2017 - 2030 (USD Million)
- Fig. 45 Asia Pacific Focused Ion Beam Market Estimates and Forecast, 2017 - 2030 (USD Million)
- Fig. 46 China Focused Ion Beam Market Estimates and Forecasts, 2017 - 2030 (USD Million)
- Fig. 47 Japan Focused Ion Beam Market Estimates and Forecasts, 2017 - 2030 (USD Million)
- Fig. 48 India Focused Ion Beam Market Estimates and Forecasts, 2017 - 2030 (USD Million)
- Fig. 49 Australia Focused Ion Beam Market Estimates and Forecasts, 2017 - 2030 (USD Million)
- Fig. 50 South Korea Focused Ion Beam Market Estimates and Forecasts, 2017 - 2030 (USD Million)
- Fig. 51 Latin America Focused Ion Beam Market Estimates and Forecasts, 2017 - 2030 (USD Million)
- Fig. 52 Brazil Focused Ion Beam Market Estimates and Forecasts, 2017 - 2030 (USD Million)
- Fig. 53 MEA Focused Ion Beam Market Estimates and Forecasts, 2017 - 2030 (USD Million)
- Fig. 54 UAE Focused Ion Beam Market Estimates and Forecasts, 2017 - 2030 (USD Million)
- Fig. 55 South Africa Focused Ion Beam Market Estimates and Forecasts, 2017 - 2030 (USD Million)
- Fig. 56 KSA Focused Ion Beam Market Estimates and Forecasts, 2017 - 2030 (USD Million)
- Fig. 57 Key Company Categorization
- Fig. 58 Company Market Positioning
- Fig. 59 Key Company Market Share Analysis, 2024
- Fig. 60 Strategic Framework
Focused Ion Beam Market Summary
The global focused ion beam market size was estimated at USD 1.55 billion in 2024 and is projected to reach USD 2.36 billion by 2030, growing at a CAGR of 7.3% from 2025 to 2030. The focused ion beam (FIB) market is primarily driven by increasing demand for precise material characterization, nanofabrication, and failure diagnostics across diverse industries.
The market is centered on tools that use a tightly focused beam of ions, commonly gallium, to image, modify, or analyze materials at micro- and nanoscale levels. These systems are essential in industries that require high precision, such as semiconductors, materials science, and life sciences. FIB systems can perform imaging, milling, deposition, and circuit editing, making them versatile instruments. They are often integrated with scanning electron microscopes to form dual-beam systems. This integration enhances analytical capabilities and broadens application scope. The market for FIB technology continues to grow due to demand for miniaturized and high-performance components. As nanofabrication and device complexity increase, FIB tools are becoming more indispensable in research and manufacturing environments.
Growth in the semiconductor sector is one of the main market drivers. As electronic devices become smaller and more complex, precise tools such as FIBs are needed for inspection and modification. These systems are widely used for failure analysis, process development, and sample preparation. The market also benefits from increased research in nanotechnology and advanced materials. Life sciences applications, such as biological sample preparation, also contribute to demand. FIB's ability to work with a variety of materials across sectors supports its expanding market base. The growing interest in high-resolution imaging and material characterization further fuels this demand.
Advancements also influence the automation of FIB systems, artificial intelligence, and the software integration market. These enhancements improve accuracy, ease of use, and efficiency in complex tasks. As a result, industries are adopting FIB tools for more sophisticated analyses and processes. Emerging applications in additive manufacturing and quantum research are expanding the technology's reach. Collaborations between research institutions and commercial manufacturers are helping drive innovation. Together, these trends are shaping the future market landscape. Continuous R&D investments are expected to accelerate the development of the next-generation FIB system.
Global Focused Ion Beam Market Report Segmentation
This report forecasts revenue growth at the global, regional, and country levels and provides an analysis of the latest industry trends in each of the sub-segments from 2017 to 2030. For this study, Grand View Research has segmented the global focused ion beam market report based on type, application, vertical, and region:
- Type Outlook (Revenue, USD Million, 2017 - 2030)
- Ga+ Liquid Metal
- Gas Field
- Plasma
- Application Outlook (Revenue, USD Million, 2017 - 2030)
- Failure Analysis
- Nanofabrication
- Device Modification
- Circuit Edit
- Counterfeit Detection
- Vertical Outlook (Revenue, USD Million, 2017 - 2030)
- Electronics & Semiconductor
- Industrial Science
- Bioscience
- Material Science
- Regional Outlook (Revenue, USD Million, 2017 - 2030)
- North America
- U.S.
- Canada
- Mexico
- Europe
- Germany
- UK
- France
- Asia Pacific
- China
- Japan
- India
- South Korea
- Australia
- Latin America
- Brazil
- Middle East and Africa (MEA)
- UAE
- KSA
- South Africa
Table of Contents
Chapter 1. Methodology and Scope
- 1.1. Market Segmentation and Scope
- 1.2. Market Definitions
- 1.3. Research Methodology
- 1.3.1. Information Procurement
- 1.3.2. Information or Data Analysis
- 1.3.3. Market Formulation & Data Visualization
- 1.3.4. Data Validation & Publishing
- 1.4. Research Scope and Assumptions
- 1.4.1. List of Data Sources
Chapter 2. Executive Summary
- 2.1. Market Outlook
- 2.2. Segment Outlook
- 2.3. Competitive Insights
Chapter 3. Focused Ion Beam Market Variables, Trends, & Scope
- 3.1. Market Introduction/Lineage Outlook
- 3.2. Market Size and Growth Prospects (USD Million)
- 3.3. Industry Value Chain Analysis
- 3.4. Market Dynamics
- 3.4.1. Market Drivers Analysis
- 3.4.2. Market Restraints Analysis
- 3.4.3. Industry Opportunities
- 3.4.4. Industry Challenges
- 3.5. Focused Ion Beam Market Analysis Tools
- 3.5.1. Porter's Analysis
- 3.5.1.1. Bargaining power of the suppliers
- 3.5.1.2. Bargaining power of the buyers
- 3.5.1.3. Threats of substitution
- 3.5.1.4. Threats from new entrants
- 3.5.1.5. Competitive rivalry
- 3.5.2. PESTEL Analysis
- 3.5.2.1. Political landscape
- 3.5.2.2. Economic and Social landscape
- 3.5.2.3. Technological landscape
- 3.5.2.4. Environmental landscape
- 3.5.2.5. Legal landscape
- 3.5.1. Porter's Analysis
Chapter 4. Focused Ion Beam Market: Type Estimates & Trend Analysis
- 4.1. Segment Dashboard
- 4.2. Focused Ion Beam Market: Type Movement Analysis, USD Million, 2024 & 2030
- 4.3. Ga+ Liquid Metal
- 4.3.1. Ga+ Liquid Metal Market Revenue Estimates and Forecasts, 2017 - 2030 (USD Million)
- 4.4. Gas Field
- 4.4.1. Gas Field Market Revenue Estimates and Forecasts, 2017 - 2030 (USD Million)
- 4.5. Plasma
- 4.5.1. Plasma Market Revenue Estimates and Forecasts, 2017 - 2030 (USD Million)
Chapter 1. Focused Ion Beam Market: Application Estimates & Trend Analysis
- 1.1. Segment Dashboard
- 1.2. Focused Ion Beam Market: Application Movement Analysis, USD Million, 2024 & 2030
- 1.3. Failure Analysis
- 1.3.1. Failure Analysis Market Revenue Estimates and Forecasts, 2017 - 2030 (USD Million)
- 1.4. Nanofabrication
- 1.4.1. Nanofabrication Market Revenue Estimates and Forecasts, 2017 - 2030 (USD Million)
- 1.5. Device Modification
- 1.5.1. Device Modification Market Revenue Estimates and Forecasts, 2017 - 2030 (USD Million)
- 1.6. Circuit Edit
- 1.6.1. Circuit Edit Market Revenue Estimates and Forecasts, 2017 - 2030 (USD Million)
- 1.7. Counterfeit Detection
- 1.7.1. Counterfeit Detection Market Revenue Estimates and Forecasts, 2017 - 2030 (USD Million)
Chapter 2. Focused Ion Beam Market: Vertical Estimates & Trend Analysis
- 2.1. Segment Dashboard
- 2.2. Focused Ion Beam Market: Vertical Movement Analysis, USD Million, 2024 & 2030
- 2.3. Electronics & Semiconductor
- 2.3.1. Electronics & Semiconductor Market Revenue Estimates and Forecasts, 2017 - 2030 (USD Million)
- 2.4. Industrial Science
- 2.4.1. Industrial Science Market Revenue Estimates and Forecasts, 2017 - 2030 (USD Million)
- 2.5. Bioscience
- 2.5.1. Bioscience Market Revenue Estimates and Forecasts, 2017 - 2030 (USD Million)
- 2.6. Material Science
- 2.6.1. Material Science Market Revenue Estimates and Forecasts, 2017 - 2030 (USD Million)
Chapter 3. Focused Ion Beam Market: Regional Estimates & Trend Analysis
- 3.1. Focused Ion Beam Market Share, by Region, 2024 & 2030 USD Million
- 3.2. North America
- 3.2.1. North America Focused Ion Beam Market Estimates and Forecasts, 2017 - 2030 (USD Million)
- 3.2.2. North America Focused Ion Beam Market Estimates and Forecasts, by Application, 2017 - 2030 (USD Million)
- 3.2.3. North America Focused Ion Beam Market Estimates and Forecasts, by Vertical, 2017 - 2030 (USD Million)
- 3.2.4. North America Focused Ion Beam Market Estimates and Forecasts, by Type, 2017 - 2030 (USD Million)
- 3.2.5. U.S.
- 3.2.5.1. U.S. Focused Ion Beam Market Estimates and Forecasts, 2017 - 2030 (USD Million)
- 3.2.5.2. U.S. Focused Ion Beam Market Estimates and Forecasts, by Application, 2017 - 2030 (USD Million)
- 3.2.5.3. U.S. Focused Ion Beam Market Estimates and Forecasts, by Vertical, 2017 - 2030 (USD Million)
- 3.2.5.4. U.S. Focused Ion Beam Market Estimates and Forecasts, by Type, 2017 - 2030 (USD Million)
- 3.2.6. Canada
- 3.2.6.1. Canada Focused Ion Beam Market Estimates and Forecasts, 2017 - 2030 (USD Million)
- 3.2.6.2. Canada Focused Ion Beam Market Estimates and Forecasts, by Application, 2017 - 2030 (USD Million)
- 3.2.6.3. Canada Focused Ion Beam Market Estimates and Forecasts, by Vertical, 2017 - 2030 (USD Million)
- 3.2.6.4. Canada Focused Ion Beam Market Estimates and Forecasts, by Type, 2017 - 2030 (USD Million)
- 3.2.7. Mexico
- 3.2.7.1. Mexico Focused Ion Beam Market Estimates and Forecasts, 2017 - 2030 (USD Million)
- 3.2.7.2. Mexico Focused Ion Beam Market Estimates and Forecasts, by Application, 2017 - 2030 (USD Million)
- 3.2.7.3. Mexico Focused Ion Beam Market Estimates and Forecasts, by Vertical, 2017 - 2030 (USD Million)
- 3.2.7.4. Mexico Focused Ion Beam Market Estimates and Forecasts, by Type, 2017 - 2030 (USD Million)
- 3.3. Europe
- 3.3.1. Europe Focused Ion Beam Market Estimates and Forecasts, 2017 - 2030 (USD Million)
- 3.3.2. Europe Focused Ion Beam Market Estimates and Forecasts, by Application, 2017 - 2030 (USD Million)
- 3.3.3. Europe Focused Ion Beam Market Estimates and Forecasts, by Vertical, 2017 - 2030 (USD Million)
- 3.3.4. Europe Focused Ion Beam Market Estimates and Forecasts, by Type, 2017 - 2030 (USD Million)
- 3.3.5. UK
- 3.3.5.1. UK Focused Ion Beam Market Estimates and Forecasts, 2017 - 2030 (USD Million)
- 3.3.5.2. UK Focused Ion Beam Market Estimates and Forecasts, by Application, 2017 - 2030 (USD Million)
- 3.3.5.3. UK Focused Ion Beam Market Estimates and Forecasts, by Vertical, 2017 - 2030 (USD Million)
- 3.3.5.4. UK Focused Ion Beam Market Estimates and Forecasts, by Type, 2017 - 2030 (USD Million)
- 3.3.6. Germany
- 3.3.6.1. Germany Focused Ion Beam Market Estimates and Forecasts, 2017 - 2030 (USD Million)
- 3.3.6.2. Germany Focused Ion Beam Market Estimates and Forecasts, by Application, 2017 - 2030 (USD Million)
- 3.3.6.3. Germany Focused Ion Beam Market Estimates and Forecasts, by Vertical, 2017 - 2030 (USD Million)
- 3.3.6.4. Germany Focused Ion Beam Market Estimates and Forecasts, by Type, 2017 - 2030 (USD Million)
- 3.3.7. France
- 3.3.7.1. France Focused Ion Beam Market Estimates and Forecasts, 2017 - 2030 (USD Million)
- 3.3.7.2. France Focused Ion Beam Market Estimates and Forecasts, by Application, 2017 - 2030 (USD Million)
- 3.3.7.3. France Focused Ion Beam Market Estimates and Forecasts, by Vertical, 2017 - 2030 (USD Million)
- 3.3.7.4. France Focused Ion Beam Market Estimates and Forecasts, by Type, 2017 - 2030 (USD Million)
- 3.4. Asia Pacific
- 3.4.1. Asia Pacific Focused Ion Beam Market Estimates and Forecasts, 2017 - 2030 (USD Million)
- 3.4.2. Asia Pacific Focused Ion Beam Market Estimates and Forecasts, by Application, 2017 - 2030 (USD Million)
- 3.4.3. Asia Pacific Focused Ion Beam Market Estimates and Forecasts, by Vertical, 2017 - 2030 (USD Million)
- 3.4.4. Asia Pacific Focused Ion Beam Market Estimates and Forecasts, by Type, 2017 - 2030 (USD Million)
- 3.4.5. China
- 3.4.5.1. China Focused Ion Beam Market Estimates and Forecasts, 2017 - 2030 (USD Million)
- 3.4.5.2. China Focused Ion Beam Market Estimates and Forecasts, by Application, 2017 - 2030 (USD Million)
- 3.4.5.3. China Focused Ion Beam Market Estimates and Forecasts, by Vertical, 2017 - 2030 (USD Million)
- 3.4.5.4. China Focused Ion Beam Market Estimates and Forecasts, by Type, 2017 - 2030 (USD Million)
- 3.4.6. Japan
- 3.4.6.1. Japan Focused Ion Beam Market Estimates and Forecasts, 2017 - 2030 (USD Million)
- 3.4.6.2. Japan Focused Ion Beam Market Estimates and Forecasts, by Application, 2017 - 2030 (USD Million)
- 3.4.6.3. Japan Focused Ion Beam Market Estimates and Forecasts, by Vertical, 2017 - 2030 (USD Million)
- 3.4.6.4. Japan Focused Ion Beam Market Estimates and Forecasts, by Type, 2017 - 2030 (USD Million)
- 3.4.7. India
- 3.4.7.1. India Focused Ion Beam Market Estimates and Forecasts, 2017 - 2030 (USD Million)
- 3.4.7.2. India Focused Ion Beam Market Estimates and Forecasts, by Application, 2017 - 2030 (USD Million)
- 3.4.7.3. India Focused Ion Beam Market Estimates and Forecasts, by Vertical, 2017 - 2030 (USD Million)
- 3.4.7.4. India Focused Ion Beam Market Estimates and Forecasts, by Type, 2017 - 2030 (USD Million)
- 3.4.8. Australia
- 3.4.8.1. Australia Focused Ion Beam Market Estimates and Forecasts, 2017 - 2030 (USD Million)
- 3.4.8.2. Australia Focused Ion Beam Market Estimates and Forecasts, by Application, 2017 - 2030 (USD Million)
- 3.4.8.3. Australia Focused Ion Beam Market Estimates and Forecasts, by Vertical, 2017 - 2030 (USD Million)
- 3.4.8.4. Australia Focused Ion Beam Market Estimates and Forecasts, by Type, 2017 - 2030 (USD Million)
- 3.4.9. South Korea
- 3.4.9.1. South Korea Focused Ion Beam Market Estimates and Forecasts, 2017 - 2030 (USD Million)
- 3.4.9.2. South Korea Focused Ion Beam Market Estimates and Forecasts, by Application, 2017 - 2030 (USD Million)
- 3.4.9.3. South Korea Focused Ion Beam Market Estimates and Forecasts, by Vertical, 2017 - 2030 (USD Million)
- 3.4.9.4. South Korea Focused Ion Beam Market Estimates and Forecasts, by Type, 2017 - 2030 (USD Million)
- 3.5. Latin America
- 3.5.1. Latin America Focused Ion Beam Market Estimates and Forecasts, 2017 - 2030 (USD Million)
- 3.5.2. Latin America Focused Ion Beam Market Estimates and Forecasts, by Application, 2017 - 2030 (USD Million)
- 3.5.3. Latin America Focused Ion Beam Market Estimates and Forecasts, by Vertical, 2017 - 2030 (USD Million)
- 3.5.4. Latin America Focused Ion Beam Market Estimates and Forecasts, by Type, 2017 - 2030 (USD Million)
- 3.5.5. Brazil
- 3.5.5.1. Brazil Focused Ion Beam Market Estimates and Forecasts, 2017 - 2030 (USD Million)
- 3.5.5.2. Brazil Focused Ion Beam Market Estimates and Forecasts, by Application, 2017 - 2030 (USD Million)
- 3.5.5.3. Brazil Focused Ion Beam Market Estimates and Forecasts, by Vertical, 2017 - 2030 (USD Million)
- 3.5.5.4. Brazil Focused Ion Beam Market Estimates and Forecasts, by Type, 2017 - 2030 (USD Million)
- 3.6. Middle East and Africa
- 3.6.1. Middle East and Africa Focused Ion Beam Market Estimates and Forecasts, 2017 - 2030 (USD Million)
- 3.6.2. Middle East and Africa Focused Ion Beam Market Estimates and Forecasts, by Application, 2017 - 2030 (USD Million)
- 3.6.3. Middle East and Africa Focused Ion Beam Market Estimates and Forecasts, by Vertical, 2017 - 2030 (USD Million)
- 3.6.4. Middle East and Africa Focused Ion Beam Market Estimates and Forecasts, by Type, 2017 - 2030 (USD Million)
- 3.6.5. UAE
- 3.6.5.1. UAE Focused Ion Beam Market Estimates and Forecasts, 2017 - 2030 (USD Million)
- 3.6.5.2. UAE Focused Ion Beam Market Estimates and Forecasts, by Application, 2017 - 2030 (USD Million)
- 3.6.5.3. UAE Focused Ion Beam Market Estimates and Forecasts, by Vertical, 2017 - 2030 (USD Million)
- 3.6.5.4. UAE Focused Ion Beam Market Estimates and Forecasts, by Type, 2017 - 2030 (USD Million)
- 3.6.6. South Africa
- 3.6.6.1. South Africa Focused Ion Beam Market Estimates and Forecasts, 2017 - 2030 (USD Million)
- 3.6.6.2. South Africa Focused Ion Beam Market Estimates and Forecasts, by Application, 2017 - 2030 (USD Million)
- 3.6.6.3. South Africa Focused Ion Beam Market Estimates and Forecasts, by Vertical, 2017 - 2030 (USD Million)
- 3.6.6.4. South Africa Focused Ion Beam Market Estimates and Forecasts, by Type, 2017 - 2030 (USD Million)
- 3.6.7. KSA
- 3.6.7.1. KSA Focused Ion Beam Market Estimates and Forecasts, 2017 - 2030 (USD Million)
- 3.6.7.2. KSA Focused Ion Beam Market Estimates and Forecasts, by Application, 2017 - 2030 (USD Million)
- 3.6.7.3. KSA Focused Ion Beam Market Estimates and Forecasts, by Vertical, 2017 - 2030 (USD Million)
- 3.6.7.4. KSA Focused Ion Beam Market Estimates and Forecasts, by Type, 2017 - 2030 (USD Million)
Chapter 4. Competitive Landscape
- 4.1. Recent Developments & Impact Analysis by Key Market Participants
- 4.2. Company Categorization
- 4.3. Company Market Positioning
- 4.4. Company Market Share Analysis
- 4.5. Company Heat Map Analysis
- 4.6. Strategy Mapping
- 4.6.1. Expansion
- 4.6.2. Mergers & Acquisition
- 4.6.3. Partnerships & Collaborations
- 4.6.4. New Component Launches
- 4.6.5. Research and Development
- 4.7. Company Profiles
- 4.7.1. Thermo Fisher Scientific
- 4.7.1.1. Participant's Overview
- 4.7.1.2. Financial Performance
- 4.7.1.3. Component Benchmarking
- 4.7.1.4. Recent Developments
- 4.7.2. Zeiss
- 4.7.2.1. Participant's Overview
- 4.7.2.2. Financial Performance
- 4.7.2.3. Component Benchmarking
- 4.7.2.4. Recent Developments
- 4.7.3. Hitachi High-Technologies Corporation
- 4.7.3.1. Participant's Overview
- 4.7.3.2. Financial Performance
- 4.7.3.3. Component Benchmarking
- 4.7.3.4. Recent Developments
- 4.7.4. JEOL Ltd.
- 4.7.4.1. Participant's Overview
- 4.7.4.2. Financial Performance
- 4.7.4.3. Component Benchmarking
- 4.7.4.4. Recent Developments
- 4.7.5. TESCAN GROUP, a.s.
- 4.7.5.1. Participant's Overview
- 4.7.5.2. Financial Performance
- 4.7.5.3. Component Benchmarking
- 4.7.5.4. Recent Developments
- 4.7.6. Fibics Incorporated
- 4.7.6.1. Participant's Overview
- 4.7.6.2. Financial Performance
- 4.7.6.3. Component Benchmarking
- 4.7.6.4. Recent Developments
- 4.7.7. Raith GmbH
- 4.7.7.1. Participant's Overview
- 4.7.7.2. Financial Performance
- 4.7.7.3. Component Benchmarking
- 4.7.7.4. Recent Developments
- 4.7.8. FOCUS GmbH
- 4.7.8.1. Participant's Overview
- 4.7.8.2. Financial Performance
- 4.7.8.3. Component Benchmarking
- 4.7.8.4. Recent Developments
- 4.7.9. A&D Company, Limited
- 4.7.9.1. Participant's Overview
- 4.7.9.2. Financial Performance
- 4.7.9.3. Component Benchmarking
- 4.7.9.4. Recent Developments
- 4.7.10. Veeco Instruments, Inc.
- 4.7.10.1. Participant's Overview
- 4.7.10.2. Financial Performance
- 4.7.10.3. Component Benchmarking
- 4.7.10.4. Recent Developments
- 4.7.11. Eurofins Scientific
- 4.7.11.1. Participant's Overview
- 4.7.11.2. Financial Performance
- 4.7.11.3. Component Benchmarking
- 4.7.11.4. Recent Developments
- 4.7.12. Delong Instruments Co., Ltd.
- 4.7.12.1. Participant's Overview
- 4.7.12.2. Financial Performance
- 4.7.12.3. Component Benchmarking
- 4.7.12.4. Recent Developments
- 4.7.1. Thermo Fisher Scientific

