|
|
市場調査レポート
商品コード
1493345
米国のヘルスセンサー市場規模、シェア、動向分析レポート:製品別、用途別、地域別、セグメント別予測、2024年~2030年U.S. Health Sensors Market Size, Share & Trends Analysis Report By Product (Hand Held Diagnostic Sensors, Wearable Sensors), By Application (Chronic Illness & At-risk Monitoring, Wellness Monitoring), By Region, And Segment Forecasts, 2024 - 2030 |
||||||
|
|||||||
カスタマイズ可能
|
|||||||

| 米国のヘルスセンサー市場規模、シェア、動向分析レポート:製品別、用途別、地域別、セグメント別予測、2024年~2030年 |
|
出版日: 2024年05月28日
発行: Grand View Research
ページ情報: 英文 80 Pages
納期: 2~10営業日
|

全表示
- 概要
- 図表
- 目次
米国のヘルスセンサー市場の成長と動向:
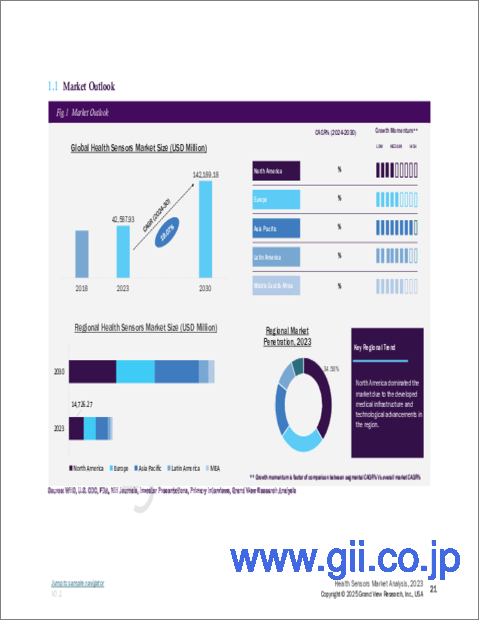
Grand View Research, Inc.の最新レポートによると、米国のヘルスセンサー場規模は2030年までに367億1,000万米ドルに達し、2024年から2030年までのCAGRは17.8%で成長すると予測されています。
健康センサの需要は、糖尿病、心血管障害、呼吸器疾患などの慢性疾患の有病率の増加により高まっています。健康センサは、患者の遠隔モニタリング、健康問題の早期発見、患者の転帰の改善、ヘルスケアコストの削減を可能にする上で重要な役割を果たしています。
また、予防ヘルスケアやウェルネス・イニシアチブへの注目が高まっていることから、積極的に自分の健康をモニターしたいと考えている個人におけるヘルス・センサの採用も増加しています。例えば、メドトロニックは2024年1月、CEマークの承認を取得し、Simplera SyncとともにMiniMed 780Gシステムを発売しました。このシステムは、オールインワンの持続グルコースモニター(CGM)を発表し、フィンガースティックやオーバーテープの必要性をなくすと同時に、簡素化された2段階の挿入プロセスと以前のメドトロニックのセンサーの半分のサイズという小型化により、アップグレードされたユーザーエクスペリエンスを提供します。
小型化、精度の向上、接続機能など、センサー技術の技術的進歩は、ヘルスセンサーをより身近で使いやすいものにしています。これにより、バイタルサイン、活動レベル、その他の健康指標をリアルタイムで追跡できるウェアラブル健康機器の開発が進んでいます。ヘルスセンサーを含むデジタルヘルス技術を促進する政府の取り組みや規制も、市場成長の推進に重要な役割を果たしています。
ヘルスケアシステムへのセンサーベースのソリューションの統合を支援する政策は、これらの技術の採用と受け入れを促進しています。米国保健福祉省傘下の医療情報技術調整官事務所(ONC)は、医療情報技術(IT)とデジタルヘルス技術の利用促進において極めて重要な役割を果たしています。ONCは、ヘルスIT認証プログラムや相互運用性と患者アクセスの最終規則など、さまざまなプログラムやイニシアチブを確立し、ヘルスセンサーを組み込んだものを含む相互運用可能なヘルスITシステムの開発と採用を奨励しています。これらの取り組みは、患者のプライバシーとセキュリティを保護しながら、ヘルスケア提供の質、安全性、効率性を向上させることを目的としています。
米国のヘルスセンサー市場レポート・ハイライト
- ウェアラブルセンサー分野は、2023年に35.1%の大幅な売上シェアを占めました。これは、健康&フィットネストラッカー需要の増加、スマートウォッチやその他のウェアラブルデバイスの人気の高まり、技術の急速な進歩と電子部品の小型化、ワイヤレス通信技術の利用可能性の増加など、いくつかの要因によるものです。
- 2023年には、価値ベースのケアモデルへの移行と予防医療の重視により、慢性疾患とリスクモニタリングのアプリケーションが30.8%のシェアで市場を独占しました。ヘルスケアプロバイダーは、医療費を削減し、患者の転帰を改善するために、積極的な介入と健康問題の早期発見にますます重点を置くようになっています。遠隔モニタリング・ソリューションを活用することで、ヘルスケア機関はリスクの高い患者を特定し、その健康指標を遠隔で追跡し、必要に応じて迅速に介入することで、より良い疾病管理と入院の減少につなげています。
- 2024年4月、世界的ヘルスケア企業であるKoninklijke Philips N.V.と米国最大級のヘルスケアプロバイダーであるノースウェル・ヘルス社は、患者モニタリングの標準化、患者ケアの向上、転帰の改善を目的とした7年間のパートナーシップを結びました。
目次
第1章 調査手法と範囲
第2章 エグゼクティブサマリー
第3章 米国のヘルスセンサー市場の変数、動向、範囲
- 市場系統の見通し
- 親市場の見通し
- 関連/付随市場の見通し
- 市場力学
- 市場牽引要因分析
- 市場抑制要因分析
- 米国のヘルスセンサー市場分析ツール
- 業界分析- ポーターのファイブフォース分析
- PESTEL分析
第4章 米国のヘルスセンサー市場:製品の推定・動向分析
- 製品市場シェア、2023年および2030年
- セグメントダッシュボード
- 米国のヘルスセンサー市場製品別展望
- 2018年から2030年までの市場規模と予測および動向分析
- ハンドヘルド診断センサー
- ウェアラブルセンサー
- 埋め込み式センサー
第5章 米国のヘルスセンサー市場:用途の推定・動向分析
- 用途市場シェア、2023年および2030年
- セグメントダッシュボード
- 米国のヘルスセンサー市場用途別展望
- 2018年から2030年までの市場規模と予測および動向分析
- 慢性疾患とリスクモニタリング
- ウェルネスモニタリング
- 患者入院トリアージ
- 入院臨床モニタリング
- センサー療法
- 急性期後ケアモニタリング
第6章 米国のヘルスセンサー市場:地域推定・動向分析
- 地域別市場シェア、2023年および2030年
- 米国のヘルスセンサー市場地域別展望
- 2018年から2030年までの市場規模と予測および動向分析
- 西部
- 中西部
- 北東部
- 南西部
- 南東部
第7章 競合情勢
- 主要市場参入企業による最近の動向と影響分析
- 企業/競合の分類
- ベンダー情勢
- 企業プロファイル
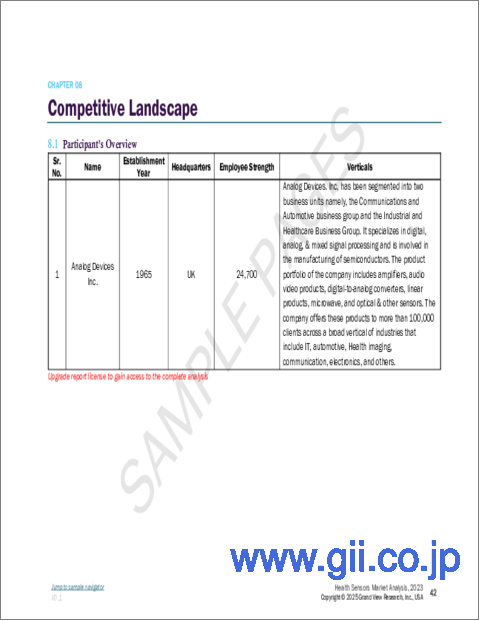
- Analog Devices, Inc
- Avago Technologies Ltd.
- Danaher Corporation
- First Sensors AG
- GE Healthcare
- Honeywell International Inc
- Koninklijke Philips NV
- Medtronic
- OMNIVISION
- Proteus Digital Health
- Sensirion AG
- Smith's Medical Inc.(ICU Medical)
List of Tables
- Table 1 List of abbreviations
- Table 2 U.S. health sensors market, by product, 2018 - 2030 (USD Million)
- Table 3 U.S. health sensors market, by application, 2018 - 2030 (USD Million)
- Table 4 U.S. health sensors market, by region, 2018 - 2030 (USD Million)
List of Figures
- Fig. 1 Market research process
- Fig. 2 Data triangulation techniques
- Fig. 3 Primary research pattern
- Fig. 4 Market research approaches
- Fig. 5 Value-chain-based sizing & forecasting
- Fig. 6 QFD modeling for market share assessment
- Fig. 7 Market formulation & validation
- Fig. 8 U.S. health sensors market: market outlook
- Fig. 9 U.S. health sensors competitive insights
- Fig. 10 Parent market outlook
- Fig. 11 Related/ancillary market outlook
- Fig. 12 Penetration and growth prospect mapping
- Fig. 13 U.S. health sensors market driver impact
- Fig. 14 U.S. health sensors market restraint impact
- Fig. 15 U.S. health sensors market: Product movement analysis
- Fig. 16 U.S. health sensors market: Product outlook and key takeaways
- Fig. 17 Handheld diagnostic sensors market estimates and forecasts, 2018 - 2030 (USD Million)
- Fig. 18 Wearable sensors market estimates and forecasts, 2018 - 2030 (USD Million)
- Fig. 19 Implantable/Ingestible sensors market estimates and forecasts, 2018 - 2030 (USD Million)
- Fig. 20 U.S. health sensors market: Application movement analysis
- Fig. 21 U.S. health sensors market: Application outlook and key takeaways
- Fig. 22 Chronic illness & at risk-monitoring market estimates and forecasts, 2018 - 2030 (USD Million)
- Fig. 23 Wellness monitoring market estimates and forecasts, 2018 - 2030 (USD Million)
- Fig. 24 Patient admission triage market estimates and forecasts, 2018 - 2030 (USD Million)
- Fig. 25 Logistical tracking market estimates and forecasts, 2018 - 2030 (USD Million)
- Fig. 26 In Hospital clinical monitoring market estimates and forecasts, 2018 - 2030 (USD Million)
- Fig. 27 Sensor therapeutics market estimates and forecasts, 2018 - 2030 (USD Million)
- Fig. 28 U.S. health sensors market: Regional movement analysis
- Fig. 29 U.S. health sensors market: Regional outlook and key takeaways
- Fig. 30 West market estimates and forecasts, 2018 - 2030 (USD Million)
- Fig. 31 Midwest market estimates and forecasts, 2018 - 2030 (USD Million)
- Fig. 32 Northeast market estimates and forecasts, 2018 - 2030 (USD Million)
- Fig. 33 Southwest market estimates and forecasts, 2018 - 2030 (USD Million)
- Fig. 34 Southeast market estimates and forecasts, 2018 - 2030 (USD Million)
U.S. Health Sensors Market Growth & Trends:
The U.S. health sensors market size is anticipated to reach USD 36.71 billion by 2030, growing at a CAGR of 17.8% from 2024 to 2030, according to a new report by Grand View Research, Inc. The demand for health sensors is rising due to the increasing prevalence of chronic diseases like diabetes, cardiovascular disorders, and respiratory diseases. Health sensors play a crucial role in enabling remote patient monitoring, early detection of health issues, improving patient outcomes, and reducing healthcare costs.
The adoption of health sensors among individuals looking to monitor their health proactively is also increasing due to the growing focus on preventive healthcare and wellness initiatives. For instance, in January 2024, Medtronic launched the MiniMed 780G system alongside Simplera Sync after securing CE Mark approval. This system unveils an all-in-one continuous glucose monitor (CGM), eliminating the requirement for fingersticks or overtape while delivering an upgraded user experience with a simplified two-step insertion process and smaller size, half the dimensions of earlier Medtronic sensors.
Technological advancements in sensor technologies, including miniaturization, improved accuracy, and connectivity features, make health sensors more accessible and user-friendly. This has led to the development of wearable health devices that can track vital signs, activity levels, and other health metrics in real-time. Government initiatives and regulations promoting digital health technologies, including health sensors, have also played a crucial role in driving market growth.
Policies that support the integration of sensor-based solutions into healthcare systems have facilitated greater adoption and acceptance of these technologies. The Office of the National Coordinator for Health Information Technology (ONC), under the U.S. Department of Health and Human Services, plays a pivotal role in promoting the use of health information technology (IT) and digital health technologies. The ONC has established various programs and initiatives, such as the Health IT Certification Program and the Interoperability and Patient Access Final Rule, which encourage the development and adoption of interoperable health IT systems, including those incorporating health sensors. These efforts aim to improve the quality, safety, and efficiency of healthcare delivery while protecting patients' privacy and security.
U.S. Health Sensors Market Report Highlights:
- Wearable sensors segment held a substantial revenue share of 35.1% in 2023. This is attributed to several factors, including increasing demand for health & fitness trackers, growing popularity of smartwatches & other wearable devices, rapid advancements in technology & miniaturization of electronic components, and increasing availability of wireless communication technologies
- Chronic illness and at risk monitoring application dominated the market in 2023 with a share of 30.8% owing to the shift towards value-based care models and the emphasis on preventive healthcare. Healthcare providers are increasingly focusing on proactive interventions and early detection of health issues to reduce healthcare costs and improve patient outcomes. By leveraging remote monitoring solutions, healthcare organizations identify high-risk patients, track their health metrics remotely, and intervene promptly when necessary, leading to better disease management and reduced hospitalizations.
- In April 2024, Koninklijke Philips N.V., a global healthcare company, and Northwell Health, one of the largest healthcare providers in the U.S., forged a seven-year partnership to standardize patient monitoring, elevate patient care, and enhance outcomes, all while promoting interoperability and fostering data innovation.
Table of Contents
Chapter 1. Methodology and Scope
- 1.1. Market Segmentation & Scope
- 1.2. Segment Definitions
- 1.2.1. Product
- 1.2.2. Application
- 1.2.3. Estimates and forecasts timeline
- 1.3. Research Methodology
- 1.4. Information Procurement
- 1.4.1. Purchased database
- 1.4.2. GVR's internal database
- 1.4.3. Secondary sources
- 1.4.4. Primary research
- 1.5. Information or Data Analysis
- 1.5.1. Data analysis models
- 1.6. Market Formulation & Validation
- 1.7. Model Details
- 1.7.1. Commodity flow analysis (Model 1)
- 1.7.2. Volume price analysis (Model 2)
- 1.8. List of Secondary Sources
- 1.9. List of Primary Sources
- 1.10. Objectives
Chapter 2. Executive Summary
- 2.1. Market Outlook
- 2.2. Segment Outlook
- 2.2.1. Product outlook
- 2.2.2. Application outlook
- 2.3. Competitive Insights
Chapter 3. U.S. Health Sensors Market Variables, Trends & Scope
- 3.1. Market Lineage Outlook
- 3.1.1. Parent market outlook
- 3.1.2. Related/ancillary market outlook
- 3.2. Market Dynamics
- 3.2.1. Market driver analysis
- 3.2.2. Market restraint analysis
- 3.3. U.S. Health Sensors Market Analysis Tools
- 3.3.1. Industry Analysis - Porter's Five Forces
- 3.3.1.1. Supplier power
- 3.3.1.2. Buyer power
- 3.3.1.3. Substitution threat
- 3.3.1.4. Threat of new entrant
- 3.3.1.5. Competitive rivalry
- 3.3.2. PESTEL Analysis
- 3.3.2.1. Political landscape
- 3.3.2.2. Technological landscape
- 3.3.2.3. Economic landscape
- 3.3.2.4. Social landscape
- 3.3.2.5. Legal landscape
- 3.3.2.6. Environmental landscape
- 3.3.1. Industry Analysis - Porter's Five Forces
Chapter 4. U.S. Health Sensors Market: Product Estimates & Trend Analysis
- 4.1. Product Market Share, 2023 & 2030
- 4.2. Segment Dashboard
- 4.3. U.S. Health Sensors Market by product outlook
- 4.4. Market Size & Forecasts and Trend Analyses, 2018 to 2030 for the following
- 4.4.1. Hand held diagnostic sensors
- 4.4.1.1. Market estimates and forecasts 2018 to 2030 (USD Million)
- 4.4.2. Wearable sensors
- 4.4.2.1. Market estimates and forecasts 2018 to 2030 (USD Million)
- 4.4.3. Implantable sensors
- 4.4.3.1. Market estimates and forecasts 2018 to 2030 (USD Million)
- 4.4.1. Hand held diagnostic sensors
Chapter 5. U.S. Health Sensors Market: Application Estimates & Trend Analysis
- 5.1. Product Market Share, 2023 & 2030
- 5.2. Segment Dashboard
- 5.3. U.S. Health Sensors Market by application Outlook
- 5.4. Market Size & Forecasts and Trend Analyses, 2018 to 2030 for the following
- 5.4.1. Chronic illness and at risk-monitoring
- 5.4.1.1. Market estimates and forecasts 2018 to 2030 (USD Million)
- 5.4.2. Wellness monitoring
- 5.4.2.1. Market estimates and forecasts 2018 to 2030 (USD Million)
- 5.4.3. Patient admission triage
- 5.4.3.1. Market estimates and forecasts 2018 to 2030 (USD Million)
- 5.4.4. Logistical tracking
- 5.4.4.1. Market estimates and forecasts 2018 to 2030 (USD Million)
- 5.4.5. In hospital clinical monitoring
- 5.4.5.1. Market estimates and forecasts 2018 to 2030 (USD Million)
- 5.4.6. Sensor therapeutics
- 5.4.6.1. Market estimates and forecasts 2018 to 2030 (USD Million)
- 5.4.7. Post-acute care monitoring
- 5.4.7.1. Market estimates and forecasts 2018 to 2030 (USD Million)
- 5.4.1. Chronic illness and at risk-monitoring
Chapter 6. U.S. Health Sensors Market: Region Estimates & Trend Analysis
- 6.1. Regional Market Share, 2023 & 2030
- 6.2. U.S. Health Sensors Market by Region Outlook
- 6.3. Market Size & Forecasts and Trend Analyses, 2018 to 2030 for the Following
- 6.3.1. West
- 6.3.1.1. Market estimates and forecasts 2018 to 2030 (USD Million)
- 6.3.2. Midwest
- 6.3.2.1. Market estimates and forecasts 2018 to 2030 (USD Million)
- 6.3.3. Northeast
- 6.3.3.1. Market estimates and forecasts 2018 to 2030 (USD Million)
- 6.3.4. Southwest
- 6.3.4.1. Market estimates and forecasts 2018 to 2030 (USD Million)
- 6.3.5. Southeast
- 6.3.5.1. Market estimates and forecasts 2018 to 2030 (USD Million)
- 6.3.1. West
Chapter 7. Competitive Landscape
- 7.1. Recent Developments & Impact Analysis, By Key Market Participants
- 7.2. Company/Competition Categorization
- 7.3. Vendor Landscape
- 7.3.1. List of key distributors and channel partners
- 7.3.2. Key customers
- 7.3.3. Key company heat map analysis, 2023
- 7.4. Company Profiles
- 7.4.1. Analog Devices, Inc
- 7.4.1.1. Company overview
- 7.4.1.2. Financial performance
- 7.4.1.3. Product benchmarking
- 7.4.1.4. Strategic initiatives
- 7.4.2. Avago Technologies Ltd.
- 7.4.2.1. Company overview
- 7.4.2.2. Financial performance
- 7.4.2.3. Product benchmarking
- 7.4.2.4. Strategic initiatives
- 7.4.3. Danaher Corporation
- 7.4.3.1. Company overview
- 7.4.3.2. Financial performance
- 7.4.3.3. Product benchmarking
- 7.4.3.4. Strategic initiatives
- 7.4.4. First Sensors AG
- 7.4.4.1. Company overview
- 7.4.4.2. Financial performance
- 7.4.4.3. Product benchmarking
- 7.4.4.4. Strategic initiatives
- 7.4.5. GE Healthcare
- 7.4.5.1. Company overview
- 7.4.5.2. Financial performance
- 7.4.5.3. Product benchmarking
- 7.4.5.4. Strategic initiatives
- 7.4.6. Honeywell International Inc
- 7.4.6.1. Company overview
- 7.4.6.2. Financial performance
- 7.4.6.3. Product benchmarking
- 7.4.6.4. Strategic initiatives
- 7.4.7. Koninklijke Philips N.V.
- 7.4.7.1. Company overview
- 7.4.7.2. Financial performance
- 7.4.7.3. Product benchmarking
- 7.4.7.4. Strategic initiatives
- 7.4.8. Medtronic
- 7.4.8.1. Company overview
- 7.4.8.2. Financial performance
- 7.4.8.3. Product benchmarking
- 7.4.8.4. Strategic initiatives
- 7.4.9. OMNIVISION
- 7.4.9.1. Company overview
- 7.4.9.2. Financial performance
- 7.4.9.3. Product benchmarking
- 7.4.9.4. Strategic initiatives
- 7.4.10. Proteus Digital Health
- 7.4.10.1. Company overview
- 7.4.10.2. Financial performance
- 7.4.10.3. Product benchmarking
- 7.4.10.4. Strategic initiatives
- 7.4.11. Sensirion AG
- 7.4.11.1. Company overview
- 7.4.11.2. Financial performance
- 7.4.11.3. Product benchmarking
- 7.4.11.4. Strategic initiatives
- 7.4.12. Smith's Medical Inc. (ICU Medical)
- 7.4.12.1. Company overview
- 7.4.12.2. Financial performance
- 7.4.12.3. Product benchmarking
- 7.4.12.4. Strategic initiatives
- 7.4.1. Analog Devices, Inc
