|
|
市場調査レポート
商品コード
1446450
ヘルスセンサーの市場規模、シェア、動向分析レポート:材料タイプ別、用途別、最終用途別、地域別、セグメント別予測、2024年~2030年Health Sensors Market Size, Share & Trends Analysis Report By Material Type (Polyurethane, Nylon), By Application (Peripheral Artery Disease), By End-use, By Region, And Segment Forecasts, 2024 - 2030 |
||||||
|
|||||||
カスタマイズ可能
|
|||||||

| ヘルスセンサーの市場規模、シェア、動向分析レポート:材料タイプ別、用途別、最終用途別、地域別、セグメント別予測、2024年~2030年 |
|
出版日: 2024年02月01日
発行: Grand View Research
ページ情報: 英文 120 Pages
納期: 2~10営業日
|

全表示
- 概要
- 図表
- 目次
ヘルスセンサー市場の成長と動向:
Grand View Research, Inc.の最新レポートによると、世界のヘルスセンサー市場規模は2030年までに1,421億8,000万米ドルに達し、予測期間中のCAGRは19.07%を記録すると予測されています。
同市場は、高齢者人口の増加、フィットネス志向の高まり、慢性疾患の有病率の増加により成長が見込まれています。現在の複雑なヘルスケア環境では、医療機関がより良いサービスを提供するために進歩するにつれて、高度で正確なモニタリングシステムの必要性が高まっています。ヘルスセンサーは、臨床医に正確なデータを提供し、治療の意思決定を行うために、アドホックなモニタリングから継続的なモニタリングへと継続的に進化しています。
病院やヘルスケアプロバイダーの主な焦点は、信頼性の高いデータと低コストのデバイスを得ることであり、これは技術進歩への第一歩と考えられています。さらに、ヘルスセンサーデバイスの技術的進歩は、病気のリスクが高い患者を特定する際に臨床医をサポートすることができ、これが業界の成長に拍車をかけると予想されています。例えば、2021年1月、Biostickerは、バイタルサインの楽なモニタリングを可能にする高度なオンボディ高度なセンサーであり、病院や在宅ケアの設定から臨床医に提供される実用的な洞察は、合併症の早期発見のためのユニークな機会を作成することができます。その結果、この業界は成長すると予想されます。
COVID-19の発生は業界全体に好影響を与えると予想されます。これは、コロナウイルスに感染した患者や自室で治療を受けている自己検疫患者の健康状態を遠隔監視するための製品需要が高いこと、ウェアラブル技術によって介護士や外科医がリアルタイムで患者をチェックできるため、介護士、外科医、他の疾患の患者、病院管理担当者の間でCOVID-19感染症の感染率を低減できること、などの要因によるものです。コロナウイルスの流行は、臨床試験デザインの全面的な見直しも余儀なくさせました。分散型臨床試験におけるウェアラブルの利用は、大きな可能性を秘めた分野の1つである(DCT)。
ヘルスセンサー市場レポートハイライト
- 製品別では、ウェアラブルセンサーセグメントが2023年に40.57%の最大収益シェアで市場を占めました。
- タイプ別では、心拍数セグメントが、患者の健康モニタリングにおける顕著な役割により、2023年に最大の収益シェアで市場をリードしました。
- 用途別では、慢性疾患&リスクモニタリングが2023年に22.75%の最大収益シェアで市場をリードしました。
- 北米は2023年に34.6%の収益シェアで市場を独占しました。これは、医療インフラが確立されていること、医療支出が多いこと、有力企業が存在すること、先端技術が急速に採用されていることなどによる。
目次
第1章 ヘルスセンサー市場:調査手法と範囲
第2章 ヘルスセンサー市場:エグゼクティブサマリー
- 市場スナップショット
- タイプと製品のスナップショット
- 用途と最終用途のスナップショット
- 競合情勢のスナップショット
第3章 ヘルスセンサー市場:変数、動向、および範囲
- 市場セグメンテーションと範囲
- 市場系統の見通し
- 市場力学
- 市場促進要因分析
- 市場抑制要因分析
- ヘルスセンサー市場分析ツール
第4章 ヘルスセンサー:タイプの推定・動向分析
- タイプ市場シェア、2023年および2030年
- セグメントダッシュボード
- タイプ別の世界のヘルスセンサー市場の見通し
- 市場規模、予測および動向分析、2018年から2030年まで
- 温度センサー
- 圧力センサー
- 血糖センサー
- 血中酸素センサー
- 心電図(ECG)センサー
- モーションセンサー
- イメージセンサー
- フローセンサー
- 心拍センサー
- その他
第5章 ヘルスセンサー:製品の推定・動向分析
- 製品市場シェア、2023年と2030年
- セグメントダッシュボード
- 製品別の世界のヘルスセンサー市場の見通し
- 市場規模、予測および動向分析、2018年から2030年まで
- ハンドヘルド診断センサー
- ウェアラブルセンサー
- 埋め込み型/摂取型センサー
第6章 ヘルスセンサー:用途の推定・動向分析
- 用途市場シェア、2023年と2030年
- セグメントダッシュボード
- 用途別の世界のヘルスセンサー市場の見通し
- 市場規模、予測および動向分析、2018年から2030年まで
- ハンドヘルド診断センサー
- 慢性疾患とリスクの監視
- 健康状態のモニタリング
- 患者の入院トリアージ
- 物流追跡
- 病院内の臨床モニタリング
- センサー治療学
- 急性期治療後のモニタリング
第7章 ヘルスセンサー:最終用途の推定・動向分析
- 最終用途市場シェア、2023年および2030年
- セグメントダッシュボード
- 最終用途別の世界のヘルスセンサー市場の見通し
- 市場規模、予測および動向分析、2018年から2030年まで
- 病院とクリニック
- 長期ケアセンターと老人ホーム
- ホームケア設定
- その他
第8章 地域ビジネス分析
- 地域市場シェア分析、2023年および2030年
- 地域市場ダッシュボード
- 世界の地域市場のスナップショット
- マーカーのサイズと予測トレンド分析、2018年から2030年:
- 北米
- 米国
- カナダ
- 欧州
- 英国
- ドイツ
- スペイン
- フランス
- イタリア
- デンマーク
- スウェーデン
- ノルウェー
- アジア太平洋地域
- 日本
- 中国
- インド
- 韓国
- タイ
- オーストラリア
- ラテンアメリカ
- ブラジル
- メキシコ
- アルゼンチン
- 中東・アフリカ
- 中東・アフリカのヘルスセンサー市場、2018~2030年
- 南アフリカ
- サウジアラビア
- アラブ首長国連邦
- クウェート
第9章 競合情勢
- 主要市場参入企業による最近の動向と影響分析
- 会社/競合の分類
- ベンダー情勢
- List of Key Distributors and Channel Partners
- Key Customers
- Key Company Market Share Analysis, 2023
- Analog Devices Inc
- Avago Technologies Ltd.,
- Danaher Corporation
- GE Healthcare
- Honeywell International Inc.
- Medtronic Plc.,
- Smith's Medical Inc.
- Koninklijke Philips
- Sensirion AG
- Abbott Laboratories
- F. Hoffmann-La Roche AG
- Hologic, Inc.
- Varian Medical System
List of Tables
- Table 1 List of abbreviation
- Table 2 North America Health Sensors Market, Region, 2018 - 2030 (USD Million)
- Table 3 North America Health Sensors Market, by Type, 2018 - 2030 (USD Million)
- Table 4 North America Health Sensors Market, by Product, 2018 - 2030 (USD Million)
- Table 5 North America Health Sensors Market, by Application, 2018 - 2030 (USD Million)
- Table 6 North America Health Sensors Market, by End use, 2018 - 2030 (USD Million)
- Table 7 US Health Sensors Market, by Type, 2018 - 2030 (USD Million)
- Table 8 US Health Sensors Market, by Product, 2018 - 2030 (USD Million)
- Table 9 US Health Sensors Market, by Application, 2018 - 2030 (USD Million)
- Table 10 US Health Sensors Market, by End use, 2018 - 2030 (USD Million)
- Table 11 Canada Health Sensors Market, by Type, 2018 - 2030 (USD Million)
- Table 12 Canada Health Sensors Market, by Product, 2018 - 2030 (USD Million)
- Table 13 Canada Health Sensors Market, by Application, 2018 - 2030 (USD Million)
- Table 14 Canada Health Sensors Market, by End use, 2018 - 2030 (USD Million)
- Table 15 Europe Health Sensors Market, by Type, 2018 - 2030 (USD Million)
- Table 16 Europe Health Sensors Market, by Product, 2018 - 2030 (USD Million)
- Table 17 Europe Health Sensors Market, by Application, 2018 - 2030 (USD Million)
- Table 18 Europe Health Sensors Market, by End use, 2018 - 2030 (USD Million)
- Table 19 UK Health Sensors Market, by Type, 2018 - 2030 (USD Million)
- Table 20 UK Health Sensors Market, by Product, 2018 - 2030 (USD Million)
- Table 21 UK Health Sensors Market, by Application, 2018 - 2030 (USD Million)
- Table 22 UK Health Sensors Market, by End use, 2018 - 2030 (USD Million)
- Table 23 Germany Health Sensors Market, by Type, 2018 - 2030 (USD Million)
- Table 24 Germany Health Sensors Market, by Product, 2018 - 2030 (USD Million)
- Table 25 Germany Health Sensors Market, by Application, 2018 - 2030 (USD Million)
- Table 26 Germany Health Sensors Market, by End use, 2018 - 2030 (USD Million)
- Table 27 France Health Sensors Market, by Type, 2018 - 2030 (USD Million)
- Table 28 France Health Sensors Market, by Product, 2018 - 2030 (USD Million)
- Table 29 France Health Sensors Market, by Application, 2018 - 2030 (USD Million)
- Table 30 France Health Sensors Market, by End use, 2018 - 2030 (USD Million)
- Table 31 Italy Health Sensors Market, by Type, 2018 - 2030 (USD Million)
- Table 32 Italy Health Sensors Market, by Product, 2018 - 2030 (USD Million)
- Table 33 Italy Health Sensors Market, by Application, 2018 - 2030 (USD Million)
- Table 34 Italy Health Sensors Market, by End use, 2018 - 2030 (USD Million)
- Table 35 Spain Health Sensors Market, by Type, 2018 - 2030 (USD Million)
- Table 36 Spain Health Sensors Market, by Product, 2018 - 2030 (USD Million)
- Table 37 Spain Health Sensors Market, by Application, 2018 - 2030 (USD Million)
- Table 38 Spain Health Sensors Market, by End use, 2018 - 2030 (USD Million)
- Table 39 Sweden Health Sensors Market, by Type, 2018 - 2030 (USD Million)
- Table 40 Sweden Health Sensors Market, by Product, 2018 - 2030 (USD Million)
- Table 41 Sweden Health Sensors Market, by Application, 2018 - 2030 (USD Million)
- Table 42 Sweden Health Sensors Market, by End use, 2018 - 2030 (USD Million)
- Table 43 Norway Health Sensors Market, by Type, 2018 - 2030 (USD Million)
- Table 44 Norway Health Sensors Market, by Product, 2018 - 2030 (USD Million)
- Table 45 Norway Health Sensors Market, by Application, 2018 - 2030 (USD Million)
- Table 46 Norway Health Sensors Market, by End use, 2018 - 2030 (USD Million)
- Table 47 Denmark Health Sensors Market, by Type, 2018 - 2030 (USD Million)
- Table 48 Denmark Health Sensors Market, by Product, 2018 - 2030 (USD Million)
- Table 49 Denmark Health Sensors Market, by Application, 2018 - 2030 (USD Million)
- Table 50 Denmark Health Sensors Market, by End use, 2018 - 2030 (USD Million)
- Table 51 Asia Pacific Health Sensors Market, by Type, 2018 - 2030 (USD Million)
- Table 52 Asia Pacific Health Sensors Market, by Product, 2018 - 2030 (USD Million)
- Table 53 Asia Pacific Health Sensors Market, by Application, 2018 - 2030 (USD Million)
- Table 54 Asia Pacific Health Sensors Market, by End use, 2018 - 2030 (USD Million)
- Table 55 Japan Health Sensors Market, by Type, 2018 - 2030 (USD Million)
- Table 56 Japan Health Sensors Market, by Product, 2018 - 2030 (USD Million)
- Table 57 Japan Health Sensors Market, by Application, 2018 - 2030 (USD Million)
- Table 58 Japan Health Sensors Market, by End use, 2018 - 2030 (USD Million)
- Table 59 China Health Sensors Market, by Type, 2018 - 2030 (USD Million)
- Table 60 China Health Sensors Market, by Product, 2018 - 2030 (USD Million)
- Table 61 China Health Sensors Market, by Application, 2018 - 2030 (USD Million)
- Table 62 China Health Sensors Market, by End use, 2018 - 2030 (USD Million)
- Table 63 India Health Sensors Market, by Type, 2018 - 2030 (USD Million)
- Table 64 India Health Sensors Market, by Product, 2018 - 2030 (USD Million)
- Table 65 India Health Sensors Market, by Application, 2018 - 2030 (USD Million)
- Table 66 India Health Sensors Market, by End use, 2018 - 2030 (USD Million)
- Table 67 Australia Health Sensors Market, by Type, 2018 - 2030 (USD Million)
- Table 68 Australia Health Sensors Market, by Product, 2018 - 2030 (USD Million)
- Table 69 Australia Health Sensors Market, by Application, 2018 - 2030 (USD Million)
- Table 70 Australia Health Sensors Market, by End use, 2018 - 2030 (USD Million)
- Table 71 South Korea Health Sensors Market, by Type, 2018 - 2030 (USD Million)
- Table 72 South Korea Health Sensors Market, by Product, 2018 - 2030 (USD Million)
- Table 73 South Korea Health Sensors Market, by Application, 2018 - 2030 (USD Million)
- Table 74 South Korea Health Sensors Market, by End use, 2018 - 2030 (USD Million)
- Table 75 Thailand Health Sensors Market, by Type, 2018 - 2030 (USD Million)
- Table 76 Thailand Health Sensors Market, by Product, 2018 - 2030 (USD Million)
- Table 77 Thailand Health Sensors Market, by Application, 2018 - 2030 (USD Million)
- Table 78 Thailand Health Sensors Market, by End use, 2018 - 2030 (USD Million)
- Table 79 Latin America Health Sensors Market, by Type, 2018 - 2030 (USD Million)
- Table 80 Latin America Health Sensors Market, by Product, 2018 - 2030 (USD Million)
- Table 81 Latin America Health Sensors Market, by Application, 2018 - 2030 (USD Million)
- Table 82 Latin America Health Sensors Market, by End use, 2018 - 2030 (USD Million)
- Table 83 Brazil Health Sensors Market, by Type, 2018 - 2030 (USD Million)
- Table 84 Brazil Health Sensors Market, by Product, 2018 - 2030 (USD Million)
- Table 85 Brazil Health Sensors Market, by Application, 2018 - 2030 (USD Million)
- Table 86 Brazil Health Sensors Market, by End use, 2018 - 2030 (USD Million)
- Table 87 Mexico Health Sensors Market, by Type, 2018 - 2030 (USD Million)
- Table 88 Mexico Health Sensors Market, by Product, 2018 - 2030 (USD Million)
- Table 89 Mexico Health Sensors Market, by Application, 2018 - 2030 (USD Million)
- Table 90 Mexico Health Sensors Market, by End use, 2018 - 2030 (USD Million)
- Table 91 Argentina Health Sensors Market, by Type, 2018 - 2030 (USD Million)
- Table 92 Argentina Health Sensors Market, by Product, 2018 - 2030 (USD Million)
- Table 93 Argentina Health Sensors Market, by Application, 2018 - 2030 (USD Million)
- Table 94 Argentina Health Sensors Market, by End use, 2018 - 2030 (USD Million)
- Table 95 MEA Health Sensors Market, by Type, 2018 - 2030 (USD Million)
- Table 96 MEA Health Sensors Market, by Product, 2018 - 2030 (USD Million)
- Table 97 MEA Health Sensors Market, by Application, 2018 - 2030 (USD Million)
- Table 98 MEA Health Sensors Market, by End use, 2018 - 2030 (USD Million)
- Table 99 South Africa Health Sensors Market, by Type, 2018 - 2030 (USD Million)
- Table 100 South Africa Health Sensors Market, by Product, 2018 - 2030 (USD Million)
- Table 101 South Africa Health Sensors Market, by Application, 2018 - 2030 (USD Million)
- Table 102 South Africa Health Sensors Market, by End use, 2018 - 2030 (USD Million)
- Table 103 Saudi Arabia Health Sensors Market, by Type, 2018 - 2030 (USD Million)
- Table 104 Saudi Arabia Health Sensors Market, by Product, 2018 - 2030 (USD Million)
- Table 105 Saudi Arabia Health Sensors Market, by Application, 2018 - 2030 (USD Million)
- Table 106 Saudi Arabia Health Sensors Market, by End use, 2018 - 2030 (USD Million)
- Table 107 UAE Health Sensors Market, by Type, 2018 - 2030 (USD Million)
- Table 108 UAE Health Sensors Market, by Product, 2018 - 2030 (USD Million)
- Table 109 UAE Health Sensors Market, by Application, 2018 - 2030 (USD Million)
- Table 110 UAE Health Sensors Market, by End use, 2018 - 2030 (USD Million)
- Table 111 Kuwait Health Sensors Market, by Type, 2018 - 2030 (USD Million)
- Table 112 Kuwait Health Sensors Market, by Product, 2018 - 2030 (USD Million)
- Table 113 Kuwait Health Sensors Market, by Application, 2018 - 2030 (USD Million)
- Table 114 Kuwait Health Sensors Market, by End use, 2018 - 2030 (USD Million)
List of Figures
- Fig. 1 Market Research Process
- Fig. 2 Data Triangulation Techniques
- Fig. 3 Primary Research Pattern
- Fig. 4 Primary Interviews in North America
- Fig. 5 Primary Interviews in Europe
- Fig. 6 Primary Interviews in APAC
- Fig. 7 Primary Interviews in Latin America
- Fig. 8 Primary Interviews in MEA
- Fig. 9 Market Research Approaches
- Fig. 10 Value-chain-Based Sizing & Forecasting
- Fig. 11 QFD Modeling for Market Share Assessment
- Fig. 12 Market Formulation & Validation
- Fig. 13 Health Sensors Market: Market Outlook
- Fig. 14 Health Sensors Competitive Insights
- Fig. 15 Parent Market Outlook
- Fig. 16 Related/Ancillary Market Outlook
- Fig. 17 Penetration and Growth Prospect Mapping
- Fig. 18 Industry Value Chain Analysis
- Fig. 19 Health Sensors Market Driver Impact
- Fig. 20 Health Sensors Market Restraint Impact
- Fig. 21 Health Sensors Market Strategic Initiatives Analysis
- Fig. 22 Health Sensors Market: Material Type Movement Analysis
- Fig. 23 Health Sensors Market: Material Type Outlook and Key Takeaways
- Fig. 24 Temperature Sensors Market Estimates and Forecast, 2018 - 2030
- Fig. 25 Pressure Sensors Market Estimates and Forecast, 2018 - 2030
- Fig. 26 Blood Glucose Sensors Market Estimates and Forecast, 2018 - 2030
- Fig. 27 Blood Oxygen Sensors Market Estimates and Forecast, 2018 - 2030
- Fig. 28 Electrocardiogram (ECG) Sensors Market Estimates and Forecast, 2018 - 2030
- Fig. 29 Motion Sensors Market Estimates and Forecast, 2018 - 2030
- Fig. 30 Image Sensors Market Estimates and Forecast, 2018 - 2030
- Fig. 31 Flow Sensors Market Estimates and Forecast, 2018 - 2030
- Fig. 32 Heart Rate Sensors Market Estimates and Forecast, 2018 - 2030
- Fig. 33 Others Market Estimates and Forecast, 2018 - 2030
- Fig. 34 Health Sensors Market: Product Movement Analysis
- Fig. 35 Health Sensors Market: Product Outlook and Key Takeaways
- Fig. 36 Handheld Diagnostic Sensors Market Estimates and Forecasts, 2018 - 2030
- Fig. 37 Wearable Sensors Market Estimates and Forecasts, 2018 - 2030
- Fig. 38 Implantable/Ingestible Sensors Market Estimates and Forecasts, 2018 - 2030
- Fig. 39 Health Sensors Market: Application Movement Analysis
- Fig. 40 Health Sensors Market: Application Outlook and Key Takeaways
- Fig. 41 Chronic Illness & At Risk-Monitoring Market Estimates and Forecasts, 2018 - 2030
- Fig. 42 Wellness Monitoring Market Estimates and Forecasts, 2018 - 2030
- Fig. 43 Patient Admission Triage Market Estimates and Forecasts, 2018 - 2030
- Fig. 44 Logistical Tracking Market Estimates and Forecasts, 2018 - 2030
- Fig. 45 In Hospital Clinical Monitoring Market Estimates and Forecasts, 2018 - 2030
- Fig. 46 Sensor Therapeutics Market Estimates and Forecasts, 2018 - 2030
- Fig. 47 Post Acute Care Monitoring Market Estimates and Forecasts, 2018 - 2030
- Fig. 48 Global Health Sensors Market: End Use Movement Analysis
- Fig. 49 Global Health Sensors Market: End Use Outlook and Key Takeaways
- Fig. 50 Hospitals & Clinics Market Estimates and Forecasts, 2018 - 2030
- Fig. 51 Long-term Care Centers & Nursing Homes Market Estimates and Forecasts, 2018 - 2030
- Fig. 52 Home Care Settings Market Estimates and Forecasts, 2018 - 2030
- Fig. 53 Others Market Estimates and Forecasts, 2018 - 2030
- Fig. 54 Global Health Sensors Market: Regional Movement Analysis
- Fig. 55 Global Health Sensors Market: Regional Outlook and Key Takeaways
- Fig. 56 Global Health Sensors Market Share and Leading Players
- Fig. 57 North America Market Share and Leading Players
- Fig. 58 Europe Market Share and Leading Players
- Fig. 59 Asia Pacific Market Share and Leading Players
- Fig. 60 Latin America Market Share and Leading Players
- Fig. 61 Middle East & Africa Market Share and Leading Players
- Fig. 62 North America Market Estimates and Forecasts, 2018 - 2030
- Fig. 63 U.S. Market Estimates and Forecasts, 2018 - 2030
- Fig. 64 Canada Market Estimates and Forecasts, 2018 - 2030
- Fig. 65 Europe Market Estimates and Forecasts, 2018 - 2030
- Fig. 66 UK Market Estimates and Forecasts, 2018 - 2030
- Fig. 67 Germany Market Estimates and Forecasts, 2018 - 2030
- Fig. 68 France Market Estimates and Forecasts, 2018 - 2030
- Fig. 69 Italy Market Estimates and Forecasts, 2018 - 2030
- Fig. 70 Spain Market Estimates and Forecasts, 2018 - 2030
- Fig. 71 Denmark Market Estimates and Forecasts, 2018 - 2030
- Fig. 72 Sweden Market Estimates and Forecasts, 2018 - 2030
- Fig. 73 Norway Market Estimates and Forecasts, 2018 - 2030
- Fig. 74 Asia Pacific Market Estimates and Forecasts, 2018 - 2030
- Fig. 75 China Market Estimates and Forecasts, 2018 - 2030
- Fig. 76 Japan Market Estimates and Forecasts, 2018 - 2030
- Fig. 77 India Market Estimates and Forecasts, 2018 - 2030
- Fig. 78 Thailand Market Estimates and Forecasts, 2018 - 2030
- Fig. 79 South Korea Market Estimates and Forecasts, 2018 - 2030
- Fig. 80 Australia Market Estimates and Forecasts, 2018 - 2030
- Fig. 81 Latin America Market Estimates and Forecasts, 2018 - 2030
- Fig. 82 Brazil Market Estimates and Forecasts, 2018 - 2030
- Fig. 83 Mexico Market Estimates and Forecasts, 2018 - 2030
- Fig. 84 Argentina Market Estimates and Forecasts, 2018 - 2030
- Fig. 85 Middle East and Africa Market Estimates and Forecasts, 2018 - 2030
- Fig. 86 South Africa Market Estimates and Forecasts, 2018 - 2030
- Fig. 87 Saudi Arabia Market Estimates and Forecasts, 2018 - 2030
- Fig. 88 UAE Market Estimates and Forecasts, 2018 - 2030
- Fig. 89 Kuwait Market Estimates and Forecasts, 2018 - 2030
- Fig. 90 Market Share of Key Market Players - Health Sensors Market
Health Sensors Market Growth & Trends:
The global health sensors market size is anticipated to reach USD 142.18 billion by 2030, registering a CAGR of 19.07% over the forecast period, according to a new report by Grand View Research, Inc. The market is expected to grow due to the increasing geriatric population, growing inclination towards fitness, and increasing prevalence of chronic diseases. In the current complex healthcare environment, the need for advanced and accurate monitoring systems increases as healthcare organizations progress to provide better services. Health sensors is continuously evolving from ad-hoc to continuous monitoring to provide accurate data to clinicians to make treatment decisions.
The main focus of hospitals and healthcare providers is to get reliable data and lower-cost devices, which is considered the first step toward technological advancement. Moreover, technological advancements in health sensors devices can support clinicians in identifying patients with high risk of disease, which is anticipated to spur industry growth. For instance, in January 2021, Biosticker is a highly on-body advanced sensor that allows effortless monitoring of vital signs and actionable insights provided to clinicians from patients in hospitals or homecare settings, which can create a unique opportunity for the early detection of complications. As a result of this, the industry is expected to grow.
The COVID-19 outbreak is expected to have a positive impact on the overall industry. This is due the factors, such as high product demand to remotely monitor the health status of patients infected with coronavirus or self-quarantined individuals taking treatment in a personal room, to reduce the transmission rate of COVID-19 infectious among the caregivers, surgeons, patients of other diseases, and hospital management personnel as wearable technology enables the caregivers & surgeons to check patients in real-time, and others. The coronavirus outbreak has also compelled a complete reassessment of clinical trial design. The use of wearables in decentralized clinical trials is one area with significant potential (DCTs).
Health Sensors Market Report Highlights:
- Based on product, the wearable sensors segment held the market with the largest revenue share of 40.57% in 2023.
- Based on type, the heart rate segment led the market with the largest revenue share in 2023 due to its prominent role in monitoring the health of patients.
- In terms of application, the chronic illness & at-risk-monitoring led the market with largest revenue share of 22.75% in 2023.
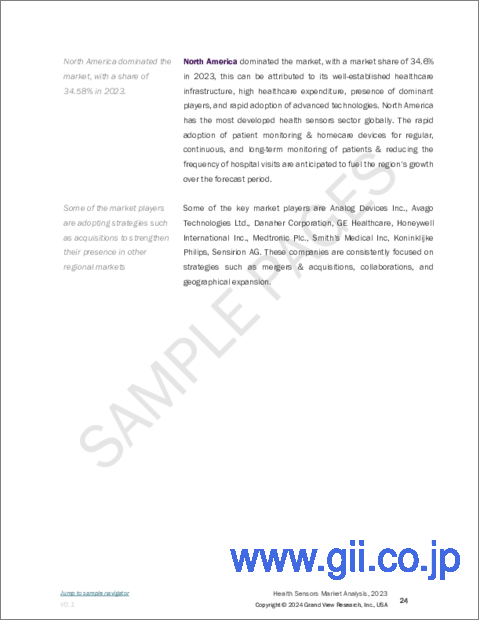
- North America dominated the market with a revenue share of 34.6% in 2023. This can be attributed to its well-established healthcare infrastructure, high healthcare expenditure, presence of dominant players, and rapid adoption of advanced technologies.
Table of Contents
Chapter 1. Health Sensors Market: Methodology and Scope
- 1.1. Market Segmentation and Scope
- 1.1.1. Segment Definitions
- 1.1.1.1. Type Segment
- 1.1.1.2. Product Segment
- 1.1.1.3. Application Segment
- 1.1.1.4. End use Segment
- 1.1.1. Segment Definitions
- 1.2. Regional Scope
- 1.3. Estimates and Forecast Timeline
- 1.4. Objectives
- 1.4.1. Objective - 1
- 1.4.2. Objective - 2
- 1.5. Research Methodology
- 1.6. Information Procurement
- 1.6.1. Purchased Database
- 1.6.2. GVR's Internal Database
- 1.6.3. Secondary Sources
- 1.6.4. Primary Research
- 1.7. Information Or Data Analysis
- 1.7.1. Data Analysis Models
- 1.8. Market Formulation & Validation
- 1.9. Model Details
- 1.9.1. Commodity Flow Analysis
- 1.10. List of Primary Sources
- 1.11. List of Abbreviations
Chapter 2. Health Sensors Market: Executive Summary
- 2.1. Market Snapshot
- 2.2. Type and Product Snapshot
- 2.3. Application and End Use Snapshot
- 2.4. Competitive Landscape Snapshot
Chapter 3. Health Sensors Market: Variables, Trends, & Scope
- 3.1. Market Segmentation and Scope
- 3.2. Market Lineage Outlook
- 3.2.1. Parent Market Outlook
- 3.2.2. Related/Ancillary Market Outlook
- 3.3. Market Dynamics
- 3.4. Market Drivers Analysis
- 3.4.1. Increasing Demand for Health Data Tracking
- 3.4.2. Sensor Innovation & Miniaturization
- 3.4.3. Rising Demand for Round-the-clock Monitoring
- 3.4.4. Growing Inclination Towards Fitness
- 3.4.5. Care Moving from Hospital to Home
- 3.4.6. Increasing Prevalence of Chronic Conditions
- 3.5. Market Restraint Analysis
- 3.5.1. Data security & privacy issues
- 3.5.2. Non-availability of reimbursement
- 3.6. Health Sensors Market Analysis Tools
- 3.6.1. Industry Analysis - Porter's
- 3.6.1.1. Supplier Power
- 3.6.1.2. Buyer Power
- 3.6.1.3. Substitution Threat
- 3.6.1.4. Threat of New Entrant
- 3.6.1.5. Competitive Rivalry
- 3.6.2. PESTLE Analysis
- 3.6.2.1. Political Landscape
- 3.6.2.2. Technological Landscape
- 3.6.2.3. Economic Landscape
- 3.6.3. Pricing Analysis
- 3.6.1. Industry Analysis - Porter's
Chapter 4. Health Sensors: Type Estimates & Trend Analysis
- 4.1. Type Market Share, 2023 & 2030
- 4.2. Segment Dashboard
- 4.3. Global Health Sensors Market by Type Outlook
- 4.4. Market Size & Forecasts and Trend Analyses, 2018 to 2030 for the Following
- 4.4.1. Temperature Sensors
- 4.4.1.1. Market Estimates and Forecasts 2018 to 2030 (USD Million)
- 4.4.2. Pressure Sensors
- 4.4.2.1. Market Estimates and Forecasts 2018 to 2030 (USD Million)
- 4.4.3. Blood Glucose Sensors
- 4.4.3.1. Market Estimates and Forecasts 2018 to 2030 (USD Million)
- 4.4.4. Blood Oxygen Sensors
- 4.4.4.1. Market Estimates and Forecasts 2018 to 2030 (USD Million)
- 4.4.5. Electrocardiogram (ECG) Sensors
- 4.4.5.1. Market Estimates and Forecasts 2018 to 2030 (USD Million)
- 4.4.6. Motion Sensors
- 4.4.6.1. Market Estimates and Forecasts 2018 to 2030 (USD Million)
- 4.4.7. Image Sensors
- 4.4.7.1. Market Estimates and Forecasts 2018 to 2030 (USD Million)
- 4.4.8. Flow Sensors
- 4.4.8.1. Market Estimates and Forecasts 2018 to 2030 (USD Million)
- 4.4.9. Heart Rate Sensors
- 4.4.9.1. Market Estimates and Forecasts 2018 to 2030 (USD Million)
- 4.4.10. Others
- 4.4.10.1. Market Estimates and Forecasts 2018 to 2030 (USD Million)
- 4.4.1. Temperature Sensors
Chapter 5. Health Sensors: Product Estimates & Trend Analysis
- 5.1. Product Market Share, 2023 & 2030
- 5.2. Segment Dashboard
- 5.3. Global Health Sensors Market by Product Outlook
- 5.4. Market Size & Forecasts and Trend Analyses, 2018 to 2030 for the Following
- 5.4.1. Handheld Diagnostic Sensors
- 5.4.1.1. Market Estimates and Forecasts 2018 to 2030 (USD Million)
- 5.4.1.1.1. Chronic Illness & At Risk-Monitoring
- 5.4.1.1.1.1. Market Estimates and Forecasts 2018 to 2030 (USD Million)
- 5.4.1.1.2. Patient Admission Triage
- 5.4.1.1.2.1. Market Estimates and Forecasts 2018 to 2030 (USD Million)
- 5.4.1.1.3. Logistical Tracking
- 5.4.1.1.3.1. Market Estimates and Forecasts 2018 to 2030 (USD Million)
- 5.4.1.1.4. In Hospital Clinical Monitoring
- 5.4.1.1.4.1. Market Estimates and Forecasts 2018 to 2030 (USD Million)
- 5.4.1.1.5. Post Acute Care Monitoring
- 5.4.1.1.5.1. Market Estimates and Forecasts 2018 to 2030 (USD Million)
- 5.4.2. Wearable Sensors
- 5.4.2.1. Market Estimates and Forecasts 2018 to 2030 (USD Million)
- 5.4.2.1.1. Disposable Wearable Sensors
- 5.4.2.1.1.1. Market Estimates and Forecasts 2018 to 2030 (USD Million)
- 5.4.2.1.2. Non-Disposable Wearable Sensors
- 5.4.2.1.2.1. Market Estimates and Forecasts 2018 to 2030 (USD Million)
- 5.4.2.1.2.1.1. Wellness Monitoring
- 5.4.2.1.2.1.1.1. Market Estimates and Forecasts 2018 to 2030 (USD Million)
- 5.4.2.1.2.1.2. Chronic Illness & At Risk-Monitoring
- 5.4.2.1.2.1.2.1. Market Estimates and Forecasts 2018 to 2030 (USD Million)
- 5.4.2.1.2.1.3. Patient Admission Triage
- 5.4.2.1.2.1.3.1. Market Estimates and Forecasts 2018 to 2030 (USD Million)
- 5.4.2.1.2.1.4. Logistical Tracking
- 5.4.2.1.2.1.4.1. Market Estimates and Forecasts 2018 to 2030 (USD Million)
- 5.4.2.1.2.1.5. In Hospital Clinical Monitoring
- 5.4.2.1.2.1.5.1. Market Estimates and Forecasts 2018 to 2030 (USD Million)
- 5.4.2.1.2.1.6. Sensor Therapeutics
- 5.4.2.1.2.1.6.1. Market Estimates and Forecasts 2018 to 2030 (USD Million)
- 5.4.2.1.2.1.7. Post Acute Care Monitoring
- 5.4.2.1.2.1.7.1. Market Estimates and Forecasts 2018 to 2030 (USD Million)
- 5.4.3. Implantable/Ingestible Sensors
- 5.4.3.1. Market Estimates and Forecasts 2018 to 2030 (USD Million)
- 5.4.3.1.1. Chronic Illness & At Risk-Monitoring
- 5.4.3.1.1.1. Market Estimates and Forecasts 2018 to 2030 (USD Million)
- 5.4.3.1.2. Patient Admission Triage
- 5.4.3.1.2.1. Market Estimates and Forecasts 2018 to 2030 (USD Million)
- 5.4.3.1.3. Logistical Tracking
- 5.4.3.1.3.1. Market Estimates and Forecasts 2018 to 2030 (USD Million)
- 5.4.3.1.4. In Hospital Clinical Monitoring
- 5.4.3.1.4.1. Market Estimates and Forecasts 2018 to 2030 (USD Million)
- 5.4.3.1.5. Post Acute Care Monitoring
- 5.4.3.1.5.1. Market Estimates and Forecasts 2018 to 2030 (USD Million)
- 5.4.1. Handheld Diagnostic Sensors
Chapter 6. Health Sensors: Application Estimates & Trend Analysis
- 6.1. Application Market Share, 2023 & 2030
- 6.2. Segment Dashboard
- 6.3. Global Health Sensors Market by Application Outlook
- 6.4. Market Size & Forecasts and Trend Analyses, 2018 to 2030 for the Following
- 6.4.1. Handheld Diagnostic Sensors
- 6.4.1.1. Market Estimates and Forecasts 2018 to 2030 (USD Million)
- 6.4.2. Chronic Illness & At Risk-Monitoring
- 6.4.2.1. Market Estimates and Forecasts 2018 to 2030 (USD Million)
- 6.4.3. Wellness Monitoring
- 6.4.3.1. Market Estimates and Forecasts 2018 to 2030 (USD Million)
- 6.4.4. Patient Admission Triage
- 6.4.4.1. Market Estimates and Forecasts 2018 to 2030 (USD Million)
- 6.4.5. Logistical Tracking
- 6.4.5.1. Market Estimates and Forecasts 2018 to 2030 (USD Million)
- 6.4.6. In Hospital Clinical Monitoring
- 6.4.6.1. Market Estimates and Forecasts 2018 to 2030 (USD Million)
- 6.4.7. Sensor Therapeutics
- 6.4.7.1. Market Estimates and Forecasts 2018 to 2030 (USD Million)
- 6.4.8. Post-Acute Care Monitoring
- 6.4.8.1. Market Estimates and Forecasts 2018 to 2030 (USD Million)
- 6.4.8.1.1. Home-Based
- 6.4.8.1.1.1. Market Estimates and Forecasts 2018 to 2030 (USD Million)
- 6.4.8.1.2. Others
- 6.4.8.1.2.1. Market Estimates and Forecasts 2018 to 2030 (USD Million)
- 6.4.1. Handheld Diagnostic Sensors
Chapter 7. Health Sensors: End Use Estimates & Trend Analysis
- 7.1. End Use Market Share, 2023 & 2030
- 7.2. Segment Dashboard
- 7.3. Global Health Sensors Market by End Use Outlook
- 7.4. Market Size & Forecasts and Trend Analyses, 2018 to 2030 for the Following
- 7.4.1. Hospitals & Clinics
- 7.4.1.1. Market Estimates and Forecasts 2018 to 2030 (USD Million)
- 7.4.2. Long-term care centers & Nursing homes
- 7.4.2.1. Market Estimates and Forecasts 2018 to 2030 (USD Million)
- 7.4.3. Home Care Settings
- 7.4.3.1. Market Estimates and Forecasts 2018 to 2030 (USD Million)
- 7.4.4. Others
- 7.4.4.1. Market Estimates and Forecasts 2018 to 2030 (USD Million)
- 7.4.1. Hospitals & Clinics
Chapter 8. Regional Business Analysis
- 8.1. Regional Market Share Analysis, 2023 & 2030
- 8.2. Regional Market Dashboard
- 8.3. Global Regional Market Snapshot
- 8.4. Marker Size, & Forecasts Trend Analysis, 2018 to 2030:
- 8.5. North America
- 8.5.1. U.S.
- 8.5.1.1. Key Country Dynamics
- 8.5.1.2. Competitive Scenario
- 8.5.1.3. Regulatory Framework
- 8.5.1.4. U.S. Market Estimates and Forecasts 2018 to 2030 (USD Million)
- 8.5.2. Canada
- 8.5.2.1. Key Country Dynamics
- 8.5.2.2. Competitive Scenario
- 8.5.2.3. Regulatory Framework
- 8.5.2.4. Canada Market Estimates and Forecasts 2018 to 2030 (USD Million)
- 8.5.1. U.S.
- 8.6. Europe
- 8.6.1. UK
- 8.6.1.1. Key Country Dynamics
- 8.6.1.2. Competitive Scenario
- 8.6.1.3. Regulatory Framework
- 8.6.1.4. UK Market Estimates and Forecasts 2018 to 2030 (USD Million)
- 8.6.2. Germany
- 8.6.2.1. Key Country Dynamics
- 8.6.2.2. Competitive Scenario
- 8.6.2.3. Regulatory Framework
- 8.6.2.4. Germany Market Estimates and Forecasts 2018 to 2030 (USD Million)
- 8.6.3. Spain
- 8.6.3.1. Key Country Dynamics
- 8.6.3.2. Competitive Scenario
- 8.6.3.3. Regulatory Framework
- 8.6.3.4. Spain Market Estimates and Forecasts 2018 to 2030 (USD Million)
- 8.6.4. France
- 8.6.4.1. Key Country Dynamics
- 8.6.4.2. Competitive Scenario
- 8.6.4.3. Regulatory Framework
- 8.6.4.4. France Market Estimates and Forecasts 2018 to 2030 (USD Million)
- 8.6.5. Italy
- 8.6.5.1. Key Country Dynamics
- 8.6.5.2. Competitive Scenario
- 8.6.5.3. Regulatory Framework
- 8.6.5.4. Italy Market Estimates and Forecasts 2018 to 2030 (USD Million)
- 8.6.6. Denmark
- 8.6.6.1. Key Country Dynamics
- 8.6.6.2. Competitive Scenario
- 8.6.6.3. Regulatory Framework
- 8.6.6.4. Denmark Market Estimates and Forecasts 2018 to 2030 (USD Million)
- 8.6.7. Sweden
- 8.6.7.1. Key Country Dynamics
- 8.6.7.2. Competitive Scenario
- 8.6.7.3. Regulatory Framework
- 8.6.7.4. Sweden Market Estimates and Forecasts 2018 to 2030 (USD Million)
- 8.6.8. Norway
- 8.6.8.1. Key Country Dynamics
- 8.6.8.2. Competitive Scenario
- 8.6.8.3. Regulatory Framework
- 8.6.8.4. Norway Market Estimates and Forecasts 2018 to 2030 (USD Million)
- 8.6.1. UK
- 8.7. Asia Pacific
- 8.7.1. JAPAN
- 8.7.1.1. Key Country Dynamics
- 8.7.1.2. Competitive Scenario
- 8.7.1.3. Regulatory Framework
- 8.7.1.4. Japan Market Estimates and Forecasts 2018 to 2030 (USD Million)
- 8.7.2. China
- 8.7.2.1. Key Country Dynamics
- 8.7.2.2. Competitive Scenario
- 8.7.2.3. Regulatory Framework
- 8.7.2.4. China Market Estimates and Forecasts 2018 to 2030 (USD Million)
- 8.7.3. India
- 8.7.3.1. Key Country Dynamics
- 8.7.3.2. Competitive Scenario
- 8.7.3.3. Regulatory Framework
- 8.7.3.4. India Market Estimates and Forecasts 2018 to 2030 (USD Million)
- 8.7.4. South Korea
- 8.7.4.1. Key Country Dynamics
- 8.7.4.2. Competitive Scenario
- 8.7.4.3. Regulatory Framework
- 8.7.4.4. South Korea Market Estimates and Forecasts 2018 to 2030 (USD Million)
- 8.7.5. Thailand
- 8.7.5.1. Key Country Dynamics
- 8.7.5.2. Competitive Scenario
- 8.7.5.3. Regulatory Framework
- 8.7.5.4. Thailand Market Estimates and Forecasts 2018 to 2030 (USD Million)
- 8.7.6. Australia
- 8.7.6.1. Key Country Dynamics
- 8.7.6.2. Competitive Scenario
- 8.7.6.3. Regulatory Framework
- 8.7.6.4. Australia Market Estimates and Forecasts 2018 to 2030 (USD Million)
- 8.7.1. JAPAN
- 8.8. Latin America
- 8.8.1. Brazil
- 8.8.1.1. Key Country Dynamics
- 8.8.1.2. Competitive Scenario
- 8.8.1.3. Regulatory Framework
- 8.8.1.4. Brazil Market Estimates and Forecasts 2018 to 2030 (USD Million)
- 8.8.2. Mexico
- 8.8.2.1. Key Country Dynamics
- 8.8.2.2. Competitive Scenario
- 8.8.2.3. Regulatory Framework
- 8.8.2.4. Mexico Health Sensors Market, 2018-2030 (USD Million)
- 8.8.3. Argentina
- 8.8.3.1. Key Country Dynamics
- 8.8.3.2. Competitive Scenario
- 8.8.3.3. Regulatory Framework
- 8.8.3.4. Argentina Market Estimates and Forecasts 2018 to 2030 (USD Million)
- 8.8.1. Brazil
- 8.9. MEA
- 8.9.1. MEA Health Sensors Market, 2018-2030 (USD Million)
- 8.9.2. South Africa
- 8.9.2.1. Key Country Dynamics
- 8.9.2.2. Competitive Scenario
- 8.9.2.3. Regulatory Framework
- 8.9.2.4. South Africa Market Estimates and Forecasts 2018 to 2030 (USD Million)
- 8.9.3. Saudi Arabia
- 8.9.3.1. Key Country Dynamics
- 8.9.3.2. Competitive Scenario
- 8.9.3.3. Regulatory Framework
- 8.9.3.4. Saudi Arabia Market Estimates and Forecasts 2018 to 2030 (USD Million)
- 8.9.4. UAE
- 8.9.4.1. Key Country Dynamics
- 8.9.4.2. Competitive Scenario
- 8.9.4.3. Regulatory Framework
- 8.9.4.4. UAE Market Estimates and Forecasts 2018 to 2030 (USD Million)
- 8.9.5. Kuwait
- 8.9.5.1. Key Country Dynamics
- 8.9.5.2. Competitive Scenario
- 8.9.5.3. Regulatory Framework
- 8.9.5.4. Kuwait Market Estimates and Forecasts 2018 to 2030 (USD Million)
Chapter 9. Competitive Landscape
- 9.1. Recent Developments & Impact Analysis, by Key Market Participants
- 9.2. Company /Competition Categorization
- 9.3. Vendor Landscape
- 9.3.1. List of Key Distributors and Channel Partners
- 9.3.2. Key Customers
- 9.3.3. Key Company Market Share Analysis, 2023
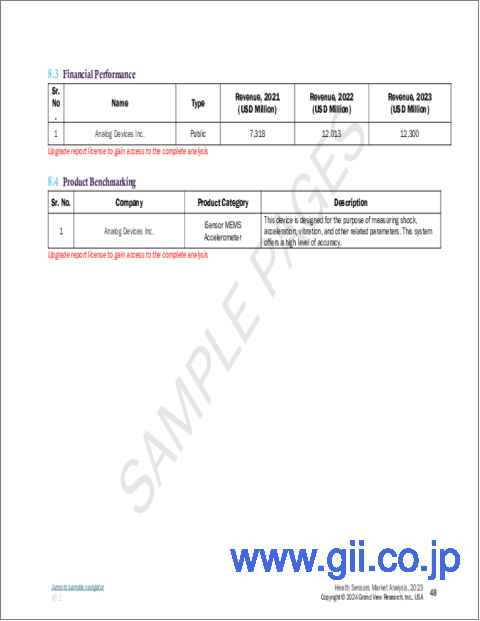
- 9.3.4. Analog Devices Inc
- 9.3.4.1. Overview
- 9.3.4.2. Financial Performance (Net Revenue/Sales/EBITDA/Gross Profit)
- 9.3.4.3. Product Benchmarking
- 9.3.4.4. Strategic Initiatives
- 9.3.5. Avago Technologies Ltd.,
- 9.3.5.1. Overview
- 9.3.5.2. Financial Performance (Net Revenue/Sales/EBITDA/Gross Profit)
- 9.3.5.3. Product Benchmarking
- 9.3.5.4. Strategic Initiatives
- 9.3.6. Danaher Corporation
- 9.3.6.1. Overview
- 9.3.6.2. Financial Performance (Net Revenue/Sales/EBITDA/Gross Profit)
- 9.3.6.3. Product Benchmarking
- 9.3.6.4. Strategic Initiatives
- 9.3.7. GE Healthcare
- 9.3.7.1. Overview
- 9.3.7.2. Financial Performance (Net Revenue/Sales/EBITDA/Gross Profit)
- 9.3.7.3. Product Benchmarking
- 9.3.7.4. Strategic Initiatives
- 9.3.8. Honeywell International Inc.
- 9.3.8.1. Overview
- 9.3.8.2. Financial Performance (Net Revenue/Sales/EBITDA/Gross Profit)
- 9.3.8.3. Product Benchmarking
- 9.3.8.4. Strategic Initiatives
- 9.3.9. Medtronic Plc.,
- 9.3.9.1. Overview
- 9.3.9.2. Financial Performance (Net Revenue/Sales/EBITDA/Gross Profit)
- 9.3.9.3. Product Benchmarking
- 9.3.9.4. Strategic Initiatives
- 9.3.10. Smith's Medical Inc.
- 9.3.10.1. Overview
- 9.3.10.2. Financial Performance (Net Revenue/Sales/EBITDA/Gross Profit)
- 9.3.10.3. Product Benchmarking
- 9.3.10.4. Strategic Initiatives
- 9.3.11. Koninklijke Philips
- 9.3.11.1. Overview
- 9.3.11.2. Financial Performance (Net Revenue/Sales/EBITDA/Gross Profit)
- 9.3.11.3. Product Benchmarking
- 9.3.11.4. Strategic Initiatives
- 9.3.12. Sensirion AG
- 9.3.12.1. Overview
- 9.3.12.2. Financial Performance (Net Revenue/Sales/EBITDA/Gross Profit)
- 9.3.12.3. Product Benchmarking
- 9.3.12.4. Strategic Initiatives
- 9.3.13. Abbott Laboratories
- 9.3.13.1. Overview
- 9.3.13.2. Financial Performance (Net Revenue/Sales/EBITDA/Gross Profit)
- 9.3.13.3. Product Benchmarking
- 9.3.13.4. Strategic Initiatives
- 9.3.14. F. Hoffmann-La Roche AG
- 9.3.14.1. Overview
- 9.3.14.2. Financial Performance (Net Revenue/Sales/EBITDA/Gross Profit)
- 9.3.14.3. Product Benchmarking
- 9.3.14.4. Strategic Initiatives
- 9.3.15. Hologic, Inc.
- 9.3.15.1. Overview
- 9.3.15.2. Financial Performance (Net Revenue/Sales/EBITDA/Gross Profit)
- 9.3.15.3. Product Benchmarking
- 9.3.15.4. Strategic Initiatives
- 9.3.16. Varian Medical System
- 9.3.16.1. Overview
- 9.3.16.2. Financial Performance (Net Revenue/Sales/EBITDA/Gross Profit)
- 9.3.16.3. Product Benchmarking
- 9.3.16.4. Strategic Initiatives

