|
|
市場調査レポート
商品コード
1750696
日本の医薬品受託開発・製造機関市場:市場規模・シェア・動向分析 (製品別・ワークフロー別・用途別・サービス別・最終用途別)、セグメント別予測 (2025年~2030年)Japan Contract Development & Manufacturing Organizations Market Size, Share & Trends Analysis Report By Product, By Workflow, By Application, By Service, By End Use, And Segment Forecasts, 2025 - 2030 |
||||||

|
|||||||
カスタマイズ可能
|
|||||||

| 日本の医薬品受託開発・製造機関市場:市場規模・シェア・動向分析 (製品別・ワークフロー別・用途別・サービス別・最終用途別)、セグメント別予測 (2025年~2030年) |
|
出版日: 2025年05月16日
発行: Grand View Research
ページ情報: 英文 127 Pages
納期: 2~10営業日
|

全表示
- 概要
- 図表
- 目次
日本の医薬品受託開発・製造機関市場の成長と動向:
Grand View Research, Inc.の最新レポートによると、日本の医薬品受託開発・製造機関の市場規模は2030年までに207億6,000万米ドルに達し、2025年から2030年までのCAGRは7.77%で拡大すると推定されています。
バイオ医薬品に対する需要の増加、疾病の高負担、老人人口の増加が主要な成長要因の一部です。様々な医薬品受託開発・製造機関(CDMO)による施設やサービス拡張のための投資の拡大は、予測期間中の市場を押し上げる可能性が高いです。
加えて、製薬企業の研究開発投資の増加が市場成長の原動力となっています。製薬企業は研究開発への投資を増やすにつれ、医薬品開発プロセスを加速するために外部の専門知識やリソースを求めることがあります。CDMOは医薬品開発、製造、検査に特化したサービスを提供するため、研究開発活動の特定の側面を外部委託したいと考えている製薬企業にとっては貴重なパートナーとなっています。複数の企業が医薬品の研究開発活動に投資しています。例えば、WuXi AppTecは2022年3月、細胞治療や遺伝子治療における薬剤用アデノ随伴ウイルスの生産を加速するため、テトラサイクリン対応自己不活性化アデノウイルス(TESSA)技術を発表しました。
製薬業界における製薬会社によるアウトソーシングサービスの増加は、日本市場に大きな影響を与えています。製薬企業によるアウトソーシングの動向は、医薬品の開発・商業化を成功させるために不可欠な新たな能力を獲得することに価値を見出すようになり、製薬領域におけるアウトソーシングの動きが活発化しています。アウトソーシングは、専門知識の提供やキャッシュフロー管理の改善に加え、投資リスクの軽減など製造面でも大きなメリットをもたらします。
注目すべきは、日本の規制当局が再生医療・遺伝子治療製品の承認を加速させていることです。例えば、医薬品医療機器等法(PMD法)、21世紀医療法(21st Century Cures Act)、PRIME(Priority Medicines)イニシアティブの採用は、日本が再生医療へのアクセスを改善するのに役立っています。規制当局によるこうした取り組みは、同国における再生医療の開発・製造需要の改善につながると期待されています。
日本の医薬品受託開発・製造機関市場レポート:ハイライト
- 原薬(API)セグメントは2024年に81.14%のシェアで市場を独占しました。このセグメントの成長を牽引しているのは、競争力のある医薬品開発とエンドツーエンドの医薬品受託開発・製造機関(CDMO)サービスに対する需要の高まりです。さらに、原薬製造の進歩、バイオ医薬品セクターの成長、高齢者人口の増加が、このセグメントの成長を促進する主な要因のいくつかです。
- バイオシミラー医薬品、ジェネリック医薬品、再生療法などの旺盛な医薬品需要に起因しています。業務用CDMOは、知識の提供、時間の節約、費用対効果の高さによって、このような場面で役立つ可能性があります。
- 用途別では、日本ではがんの罹患率が高いため、がん領域が2024年の日本CDMO業界を支配しました。がん治療用の再生製品やウイルス療法の承認は市場の成長をさらに後押しし、世界のがん患者数の増加がこの分野をさらに牽引しています。さらに、製薬研究開発投資の増加、特許切れ、がん治療薬と生物学的イノベーションへの需要が、がん分野の成長を促進する要因となっています。
目次
第1章 分析方法・範囲
第2章 エグゼクティブサマリー
第3章 日本の医薬品受託開発・製造機関市場:変動要因・傾向・範囲
- 市場連関の見通し
- 親市場の見通し
- 市場力学
- 市場促進要因の分析
- 市場抑制要因の分析
- 価格モデル分析
- 技術情勢
- ビジネスモデル分析
- 規制の枠組み
- 臨床試験件数分析(2024年)
- 臨床試験の総数:相別(2024年)
- 臨床試験の総数:治験デザイン別(2024年)
- 臨床試験の総数:主な治療領域別(2024年)
- 日本の医薬品受託開発・製造機関市場の分析ツール
- ポーターのファイブフォース分析
- PESTEL分析
- COVID-19の影響分析
第4章 日本の医薬品受託開発・製造機関市場:製品別の推定・動向分析
- セグメントダッシュボード
- 日本の医薬品受託開発・製造機関市場:変動分析、製品別
- 日本の医薬品受託開発・製造機関(CDO)の市場規模・動向分析:製品別(2018年~2030年)
- API
- 種類
- 合成法
- 薬剤
- 製造法
- 医薬品
- 薬剤の種類別
- 種類別
- 分子別
第5章 日本の医薬品受託開発・製造機関市場:ワークフロー別の推定・動向分析
- セグメントダッシュボード
- 日本の医薬品受託開発・製造機関市場:変動分析、ワークフロー別
- 日本の医薬品受託開発・製造機関(CDO)の市場規模・動向分析:ワークフロー別(2018年~2030年)
- 臨床
- 上市
第6章 日本の医薬品受託開発・製造機関市場:用途別の推定・動向分析
- セグメントダッシュボード
- 日本の医薬品受託開発・製造機関市場:変動分析、用途別
- 日本の医薬品受託開発・製造機関(CDO)の市場規模・動向分析:用途別(2018年~2030年)
- 腫瘍学
- ホルモン
- 緑内障
- 心血管疾患
- 糖尿病
- その他
第7章 日本の医薬品受託開発・製造機関市場:サービス別の推定・動向分析
- セグメントダッシュボード
- 日本の医薬品受託開発・製造機関市場:変動分析、サービス別
- 日本の医薬品受託開発・製造機関(CDO)の市場規模・動向分析:サービス別(2018年~2030年)
- 受託開発
- 受託製造
- パッケージ
- 品質管理・保証
- 目視検査
- その他
- その他
第8章 日本の医薬品受託開発・製造機関市場:最終用途別の推定・動向分析
- セグメントダッシュボード
- 日本の医薬品受託開発・製造機関市場:変動分析、最終用途別
- 日本の医薬品受託開発・製造機関(CDO)の市場規模・動向分析:最終用途別(2018年~2030年)
- 製薬会社
- バイオテクノロジー企業
- その他
第9章 日本の医薬品受託開発・製造機関市場:競合情勢
- 市場参入企業の分類
- 企業別の市場シェア分析(2024年)
- 企業プロファイル
List of Tables
- Table 1 List of secondary sources
- Table 2 List of Abbreviations
- Table 3 Japan Contract Development and Manufacturing Organizations Market, By Product, 2018 - 2030 (USD Million)
- Table 4 Japan Contract Development and Manufacturing Organizations Market, By Workflow, 2018 - 2030 (USD Million)
- Table 5 Japan Contract Development and Manufacturing Organizations Market, By Application, 2018 - 2030 (USD Million)
- Table 6 Japan Contract Development and Manufacturing Organizations Market, Service, 2018 - 2030 (USD Million)
- Table 7 Japan Contract Development and Manufacturing Organizations Market, By End Use, 2018 - 2030 (USD Million)
- Table 8 ADC Approvals in Japan
- Table 9 Financial Performance
- Table 10 Key company initiating service launches/upgrades
- Table 11 Key companies initiating service launches/upgrades
- Table 12 Key companies initiating partnerships
- Table 13 Key companies initiating expansion
- Table 14 Key companies initiating expansion
List of Figures
- Fig. 1 Information procurement
- Fig. 2 Primary research pattern
- Fig. 3 Market Research approaches
- Fig. 4 Value chain-based sizing & forecasting
- Fig. 5 Market formulation & validation
- Fig. 6 Japan contract development and manufacturing organizations market segmentation
- Fig. 7 Market driver analysis
- Fig. 8 Market restraint relevance analysis
- Fig. 9 Porter's five forces analysis
- Fig. 10 PESTEL by SWOT analysis
- Fig. 11 Regional marketplace: Key takeaways
- Fig. 12 Japan synthetic market estimates and forecasts, 2018 - 2030 (USD Million)
- Fig. 13 Japan solid market estimates and forecasts, 2018 - 2030 (USD Million)
- Fig. 14 Japan liquid market estimates and forecasts, 2018 - 2030 (USD Million)
- Fig. 15 Japan biotech market estimates and forecasts, 2018 - 2030 (USD Million)
- Fig. 16 Japan Traditional Active Pharmaceutical Ingredient (Traditional API) market estimates and forecasts, 2018 - 2030 (USD Million)
- Fig. 17 Japan Highly Potent Active Pharmaceutical Ingredient (HP-API) market estimates and forecasts, 2018 - 2030 (USD Million)
- Fig. 18 Japan Antibody Drug Conjugate (ADC) market estimates and forecasts, 2018 - 2030 (USD Million)
- Fig. 19 Japan others market estimates and forecasts, 2018 - 2030 (USD Million)
- Fig. 20 Japan innovative market estimates and forecasts, 2018 - 2030 (USD Million)
- Fig. 21 Japan generics market estimates and forecasts, 2018 - 2030 (USD Million)
- Fig. 22 Japan continuous manufacturing market estimates and forecasts, 2018 - 2030 (USD Million)
- Fig. 23 Japan batch manufacturing market estimates and forecasts, 2018 - 2030 (USD Million)
- Fig. 24 Japan oral solid dose market estimates and forecasts, 2018 - 2030 (USD Million)
- Fig. 25 Japan semi-solid dose market estimates and forecasts, 2018 - 2030 (USD Million)
- Fig. 26 Japan liquid dose market estimates and forecasts, 2018 - 2030 (USD Million)
- Fig. 27 Japan others market estimates and forecasts, 2018 - 2030 (USD Million)
- Fig. 28 Japan innovative market estimates and forecasts, 2018 - 2030 (USD Million)
- Fig. 29 Japan generics market estimates and forecasts, 2018 - 2030 (USD Million)
- Fig. 30 Japan small molecule market estimates and forecasts, 2018 - 2030 (USD Million)
- Fig. 31 Japan large molecule market estimates and forecasts, 2018 - 2030 (USD Million)
- Fig. 32 Japan clinical market estimates and forecasts, 2018 - 2030 (USD Million)
- Fig. 33 Japan commercial market estimates and forecasts, 2018 - 2030 (USD Million)
- Fig. 34 Japan oncology market estimates and forecasts, 2018 - 2030 (USD Million)
- Fig. 35 Japan hormonal market estimates and forecasts, 2018 - 2030 (USD Million)
- Fig. 36 Japan glaucoma market estimates and forecasts, 2018 - 2030 (USD Million)
- Fig. 37 Japan cardiovascular disease market estimates and forecasts, 2018 - 2030 (USD Million)
- Fig. 38 Japan diabetes market estimates and forecasts, 2018 - 2030 (USD Million)
- Fig. 39 Japan others market estimates and forecasts, 2018 - 2030 (USD Million)
- Fig. 40 Japan contract development market estimates and forecasts, 2018 - 2030 (USD Million)
- Fig. 41 Japan contract manufacturing market estimates and forecasts, 2018 - 2030 (USD Million)
- Fig. 42 Japan packaging market estimates and forecasts, 2018 - 2030 (USD Million)
- Fig. 43 Japan quality control and assurance market estimates and forecasts, 2018 - 2030 (USD Million)
- Fig. 44 Japan visual inspection market estimates and forecasts, 2018 - 2030 (USD Million)
- Fig. 45 Japan others market estimates and forecasts, 2018 - 2030 (USD Million)
- Fig. 46 Japan others market estimates and forecasts, 2018 - 2030 (USD Million)
- Fig. 47 Japan pharmaceutical companies market estimates and forecasts, 2018 - 2030 (USD Million)
- Fig. 48 Japan biotechnology companies market estimates and forecasts, 2018 - 2030 (USD Million)
- Fig. 49 Japan others market estimates and forecasts, 2018 - 2030 (USD Million)
Japan Contract Development & Manufacturing Organizations Market Growth & Trends:
The Japan contract development and manufacturing organizations market size is estimated to reach USD 20.76 billion by 2030, expanding at a CAGR of 7.77% from 2025 to 2030, according to a new report by Grand View Research, Inc. The increasing demand for biopharmaceuticals, a high burden of diseases, and the rising geriatric population are some of the key growth drivers. Growing investments by various Contract Development and Manufacturing Organizations (CDMOs) for facility and service expansion are likely to boost the market over the forecast period.
In addition, increasing pharmaceutical R&D investments are driving the market growth. As pharmaceutical companies invest more in R&D, they may seek external expertise and resources to accelerate drug development processes. CDMOs provide specialized services in drug development, manufacturing, and testing, making them valuable partners for pharmaceutical companies looking to outsource certain aspects of their R&D activities. Several players are investing in the R&D activities of pharmaceuticals. For instance, in March 2022, WuXi AppTec launched Tetracycline-Enabled Self-Silencing Adenovirus (TESSA) technology to accelerate the production of adeno-associated viruses for drugs in cell and gene therapy.
The increase in outsourcing services by pharmaceutical companies in the pharmaceutical industry has profoundly impacted the Japan market. The trend of outsourcing activities in the pharmaceutical domain is rising as companies find value in acquiring additional competencies essential for successful drug development & commercialization. Besides providing extended expertise & assisting in improved cash flow management, outsourcing brings significant manufacturing advantages, including reducing investment risks.
Notably, regulatory authorities in Japan have accelerated approval for regenerative medical and gene therapy products. For instance, the adoption of the Pharmaceuticals and Medical Devices Act (PMD Act), 21st Century Cures Act, and PRIME (Priority Medicines) Initiative has helped the country improve access to regenerative medicines. Such initiatives by regulatory agencies are expected to improve the demand for the development and manufacturing of regenerative medicines in the country.
Japan Contract Development & Manufacturing Organizations Market Report Highlights:
- The active pharmaceutical ingredient (API) segment dominated the market with a share of 81.14% in 2024. The segment growth is driven by competitive drug development and growing demand for end-to-end Contract Development & Manufacturing Organization (CDMO) services. In addition, advancements in API manufacturing, growth of the biopharmaceutical sector, and the increasing geriatric population are some of the key factors propelling segment growth
- Based on workflow, the commercial segment held the largest market share in 2024, attributed to robust demand for pharmaceutical products, such as biosimilar medications, generic medications, and regenerative therapies. This is where commercial CDMOs may help by providing knowledge, saving time, and being cost-effective.
- Based on application, the oncology segment dominated the Japan CDMO industry in 2024, owing to the high cancer burden in the country. Approval of regenerative products and virotherapy for cancer treatment can further support market growth and the segment is further driven by increasing number of cancer cases globally. In addition, increasing pharmaceutical R&D investments, patent expirations, and demand for oncology drugs & biologic innovations are the factors driving the oncology segment growth
Table of Contents
Chapter 1. Methodology and Scope
- 1.1. Market Segmentation & Scope
- 1.1.1. Estimates and forecasts timeline.
- 1.2. Market Definitions
- 1.3. Research Methodology
- 1.4. Information Procurement
- 1.4.1. Purchased database
- 1.4.2. GVR's internal database
- 1.4.3. Secondary sources
- 1.4.4. Primary research
- 1.5. Information or Data Analysis
- 1.5.1. Data analysis models
- 1.6. Market Formulation & Validation
- 1.7. Model Details
- 1.7.1. Commodity flow analysis (Model 1)
- 1.7.2. Bottom Up Approach (Model 2)
- 1.7.3. Value Chain Based Approach (Model 3)
- 1.7.4. Multivariate Analysis (Model 4)
- 1.8. List of Secondary Sources
- 1.9. List of Primary Sources
- 1.10. Objectives
Chapter 2. Executive Summary
- 2.1. Market Outlook
- 2.2. Segment Outlook
- 2.3. Competitive Insights
Chapter 3. Japan Contract Development and Manufacturing Organizations Market Variables, Trends & Scope
- 3.1. Market Lineage Outlook
- 3.1.1. Parent Market Outlook
- 3.2. Market Dynamics
- 3.2.1. Market Driver Analysis
- 3.2.1.1. Growing Demand for Biopharmaceutical Drugs in Japan
- 3.2.1.2. High Geriatric Population And Growing Disease Burden in Japan
- 3.2.1.3. Low Cost Associated with Outsourcing Drug Manufacturing and Development Services
- 3.2.2. Market Restraint Analysis
- 3.2.2.1. Limited Outsourcing Opted by Big Pharma Companies
- 3.2.2.2. Quality Issues While Outsourcing
- 3.2.1. Market Driver Analysis
- 3.3. Pricing Model Analysis
- 3.4. Technology Landscape
- 3.5. Business Model Analysis
- 3.6. Regulatory Framework
- 3.7. Clinical Trials Volume Analysis, 2024
- 3.7.1. Total Number of Clinical Trials, by Phase (2024)
- 3.7.2. Total Number of Clinical Trials, by Study Design (2024)
- 3.7.3. Total Number of Clinical Trials, by Key Therapeutic Area (2024)
- 3.8. Japan Contract Development and Manufacturing Organizations Market Analysis Tools
- 3.8.1. Porter's Five Forces Analysis
- 3.8.2. PESTEL Analysis
- 3.8.3. COVID-19 Impact Analysis
Chapter 4. Japan Contract Development and Manufacturing Organizations Market: Product Estimates & Trend Analysis
- 4.1. Segment Dashboard
- 4.2. Japan Contract Development and Manufacturing Organizations Market: Product Movement Analysis
- 4.3. Japan Contract Development and Manufacturing Organizations Market Size & Trend Analysis, by Product, 2018 to 2030 (USD Million)
- 4.4. API
- 4.4.1. API Market Estimates and Forecasts, 2018 - 2030 (USD Million)
- 4.4.2. Type
- 4.4.2.1. Traditional Active Pharmaceutical Ingredient (Traditional API)
- 4.4.2.1.1. Traditional Active Pharmaceutical Ingredient (Traditional API) Market Estimates and Forecasts, 2018 - 2030 (USD Million)
- 4.4.2.2. Highly Potent Active Pharmaceutical Ingredient (HP-API)
- 4.4.2.2.1. Highly Potent Active Pharmaceutical Ingredient (HP-API) Market Estimates and Forecasts, 2018 - 2030 (USD Million)
- 4.4.2.3. Antibody Drug Conjugate (ADC)
- 4.4.2.3.1. Antibody Drug Conjugate (ADC) Market Estimates and Forecasts, 2018 - 2030 (USD Million)
- 4.4.2.4. Others
- 4.4.2.4.1. Others Market Estimates and Forecasts, 2018 - 2030 (USD Million)
- 4.4.2.1. Traditional Active Pharmaceutical Ingredient (Traditional API)
- 4.4.3. Synthesis
- 4.4.3.1. Synthetic
- 4.4.3.1.1. Synthetic Market Estimates and Forecasts, 2018 - 2030 (USD Million)
- 4.4.3.1.2. Solid
- 4.4.3.1.2.1. Solid Market Estimates and Forecasts, 2018 - 2030 (USD Million)
- 4.4.3.1.3. Liquid
- 4.4.3.1.3.1. Liquid Market Estimates and Forecasts, 2018 - 2030 (USD Million)
- 4.4.3.2. Biotech
- 4.4.3.2.1. Biotech Market Estimates and Forecasts, 2018 - 2030 (USD Million)
- 4.4.3.1. Synthetic
- 4.4.4. Drug
- 4.4.4.1. Market Estimates and Forecasts, 2018 - 2030 (USD Million)
- 4.4.4.2. Innovative
- 4.4.4.2.1. Innovative Market Estimates and Forecasts, 2018 - 2030 (USD Million)
- 4.4.4.3. Generics
- 4.4.4.3.1. Generics Market Estimates and Forecasts, 2018 - 2030 (USD Million)
- 4.4.5. Manufacturing
- 4.4.5.1. Continuous manufacturing
- 4.4.5.1.1. Continuous Manufacturing Market Estimates and Forecasts, 2018 - 2030 (USD Million)
- 4.4.5.2. Batch manufacturing
- 4.4.5.2.1. Batch Manufacturing Market Estimates and Forecasts, 2018 - 2030 (USD Million)
- 4.4.5.1. Continuous manufacturing
- 4.5. Drug Product
- 4.5.1. By Drug Type
- 4.5.1.1. Oral Solid Dose
- 4.5.1.1.1. Oral Solid Dose Market Estimates and Forecasts, 2018 - 2030 (USD Million)
- 4.5.1.2. Semi-Solid Dose
- 4.5.1.2.1. Semi-Solid Dose Market Estimates and Forecasts, 2018 - 2030 (USD Million)
- 4.5.1.3. Liquid Dose
- 4.5.1.3.1. Liquid Dose Market Estimates and Forecasts, 2018 - 2030 (USD Million)
- 4.5.1.4. Others
- 4.5.1.4.1. Others Market Estimates and Forecasts, 2018 - 2030 (USD Million)
- 4.5.1.1. Oral Solid Dose
- 4.5.2. By Type
- 4.5.2.1. Innovative
- 4.5.2.1.1. Innovative Market Estimates and Forecasts, 2018 - 2030 (USD Million)
- 4.5.2.2. Generic
- 4.5.2.2.1. Generic Market Estimates and Forecasts, 2018 - 2030 (USD Million)
- 4.5.2.1. Innovative
- 4.5.3. By Molecule
- 4.5.3.1. Small Molecule
- 4.5.3.1.1. Small Molecule Market Estimates and Forecasts, 2018 - 2030 (USD Million)
- 4.5.3.2. Large Molecule
- 4.5.3.2.1. Large Molecule Market Estimates and Forecasts, 2018 - 2030 (USD Million)
- 4.5.3.1. Small Molecule
- 4.5.1. By Drug Type
Chapter 5. Japan Contract Development and Manufacturing Organizations Market: Workflow Estimates & Trend Analysis
- 5.1. Segment Dashboard
- 5.2. Japan Contract Development and Manufacturing Organizations Market: Workflow Movement Analysis
- 5.3. Japan Contract Development and Manufacturing Organizations Market Size & Trend Analysis, by Workflow, 2018 to 2030 (USD Million)
- 5.4. Clinical
- 5.4.1. Clinical Market Estimates and Forecasts, 2018 - 2030 (USD Million)
- 5.5. Commercial
- 5.5.1. Commercial Market Estimates and Forecasts, 2018 - 2030 (USD Million)
Chapter 6. Japan Contract Development and Manufacturing Organizations Market: Application Estimates & Trend Analysis
- 6.1. Segment Dashboard
- 6.2. Japan Contract Development and Manufacturing Organizations Market: Application Movement Analysis
- 6.3. Japan Contract Development and Manufacturing Organizations Market Size & Trend Analysis, by Application, 2018 to 2030 (USD Million)
- 6.4. Oncology
- 6.4.1. Oncology Market Estimates and Forecasts, 2018 - 2030 (USD Million)
- 6.5. Hormonal
- 6.5.1. Hormonal Market Estimates and Forecasts, 2018 - 2030 (USD Million)
- 6.6. Glaucoma
- 6.6.1. Glaucoma Market Estimates and Forecasts, 2018 - 2030 (USD Million)
- 6.7. Cardiovascular Diseases
- 6.7.1. Cardiovascular Diseases Market Estimates and Forecasts, 2018 - 2030 (USD Million)
- 6.8. Diabetes
- 6.8.1. Diabetes Market Estimates and Forecasts, 2018 - 2030 (USD Million)
- 6.9. Others
- 6.9.1. Others Market Estimates and Forecasts, 2018 - 2030 (USD Million)
Chapter 7. Japan Contract Development and Manufacturing Organizations Market: Service Estimates & Trend Analysis
- 7.1. Segment Dashboard
- 7.2. Japan Contract Development and Manufacturing Organizations Market: Service Movement Analysis
- 7.3. Japan Contract Development and Manufacturing Organizations Market Size & Trend Analysis, by Service, 2018 to 2030 (USD Million)
- 7.4. Contract Development
- 7.4.1. Contract Development Market Estimates and Forecasts, 2018 - 2030 (USD Million)
- 7.5. Contract Manufacturing
- 7.5.1. Contract Manufacturing Market Estimates and Forecasts, 2018 - 2030 (USD Million)
- 7.6. Packaging
- 7.6.1. Packaging Market Estimates and Forecasts, 2018 - 2030 (USD Million)
- 7.7. Quality Control and Assurance
- 7.7.1. Quality Control and Assurance Market Estimates and Forecasts, 2018 - 2030 (USD Million)
- 7.7.2. Visual Inspection
- 7.7.2.1. Visual Inspection Market Estimates and Forecasts, 2018 - 2030 (USD Million)
- 7.7.3. Others
- 7.7.3.1. Others Market Estimates and Forecasts, 2018 - 2030 (USD Million)
- 7.8. Others
- 7.8.1. Others Market Estimates and Forecasts, 2018 - 2030 (USD Million)
Chapter 8. Japan Contract Development and Manufacturing Organizations Market: End Use Estimates & Trend Analysis
- 8.1. Segment Dashboard
- 8.2. Japan Contract Development and Manufacturing Organizations Market: End Use Movement Analysis
- 8.3. Japan Contract Development and Manufacturing Organizations Market Size & Trend Analysis, by End Use, 2018 to 2030 (USD Million)
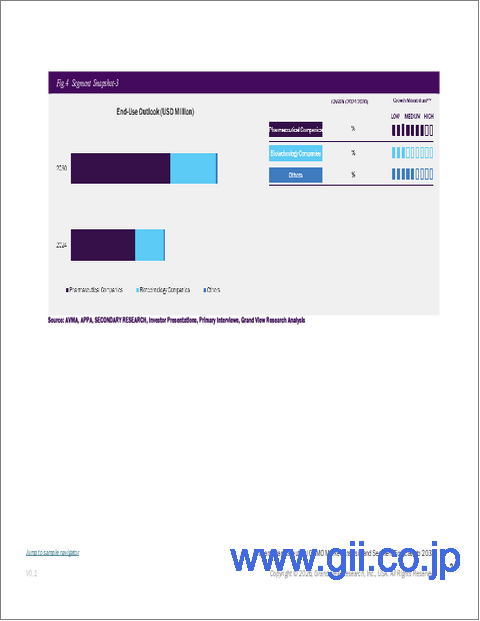
- 8.4. Pharmaceutical Companies
- 8.4.1. Pharmaceutical Companies Market Estimates and Forecasts, 2018 - 2030 (USD Million)
- 8.5. Biotechnology Companies
- 8.5.1. Biotechnology Companies Market Estimates and Forecasts, 2018 - 2030 (USD Million)
- 8.6. Others
- 8.6.1. Others Market Estimates and Forecasts, 2018 - 2030 (USD Million)
Chapter 9. Japan Contract Development and Manufacturing Organizations Market: Competitive Landscape
- 9.1. Market Participant Categorization
- 9.1.1. Market Leaders
- 9.1.2. Emerging Players
- 9.2. Company Market Assessment Analysis, 2024
- 9.3. Company Profiles
- 9.3.1. LabCorp
- 9.3.1.1. Company Overview
- 9.3.1.2. Financial Performance
- 9.3.1.3. Service Benchmarking
- 9.3.1.4. Strategic Initiatives
- 9.3.2. Wuxi AppTec, Inc.
- 9.3.2.1. Company Overview
- 9.3.2.2. Financial Performance
- 9.3.2.3. Service Benchmarking
- 9.3.2.4. Strategic Initiatives
- 9.3.3. Lonza
- 9.3.3.1. Company Overview
- 9.3.3.2. Financial Performance
- 9.3.3.3. Service Benchmarking
- 9.3.3.4. Strategic Initiatives
- 9.3.4. Recipharm AB
- 9.3.4.1. Company Overview
- 9.3.4.2. Financial Performance
- 9.3.4.3. Service Benchmarking
- 9.3.4.4. Strategic Initiatives
- 9.3.5. Samsung Biologics
- 9.3.5.1. Company Overview
- 9.3.5.2. Financial Performance
- 9.3.5.3. Service Benchmarking
- 9.3.5.4. Strategic Initiatives
- 9.3.6. Catalent, Inc.
- 9.3.6.1. Company Overview
- 9.3.6.2. Financial Performance
- 9.3.6.3. Service Benchmarking
- 9.3.6.4. Strategic Initiatives
- 9.3.7. CordenPharma International
- 9.3.7.1. Company Overview
- 9.3.7.2. Financial Performance
- 9.3.7.3. Service Benchmarking
- 9.3.7.4. Strategic Initiatives
- 9.3.8. Cambrex Corporation
- 9.3.8.1. Company Overview
- 9.3.8.2. Financial Performance
- 9.3.8.3. Service Benchmarking
- 9.3.8.4. Strategic Initiatives
- 9.3.9. Thermo Fisher Scientific, Inc.
- 9.3.9.1. Company Overview
- 9.3.9.2. Financial Performance
- 9.3.9.3. Service Benchmarking
- 9.3.9.4. Strategic Initiatives
- 9.3.10. FUJIFILM Diosynth Biotechnologies
- 9.3.10.1. Company Overview
- 9.3.10.2. Financial Performance
- 9.3.10.3. Service Benchmarking
- 9.3.10.4. Strategic Initiatives
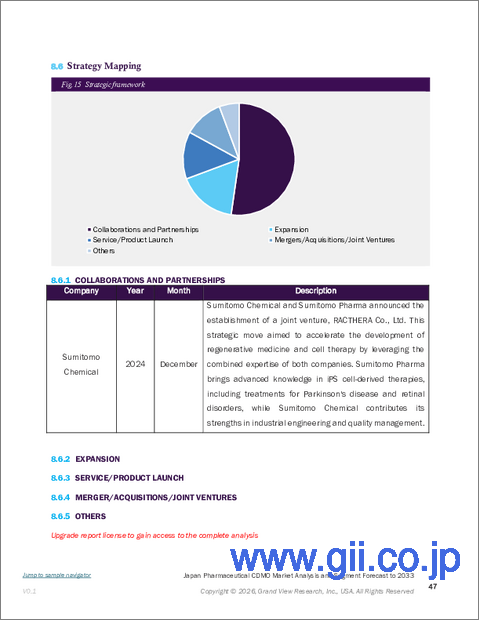
- 9.3.11. Sumitomo Chemical Company, Limited
- 9.3.11.1. Company Overview
- 9.3.11.2. Financial Performance
- 9.3.11.3. Service Benchmarking
- 9.3.11.4. Strategic Initiatives
- 9.3.12. CMIC HOLDINGS Co., LTD.
- 9.3.12.1. Company Overview
- 9.3.12.2. Financial Performance
- 9.3.12.3. Service Benchmarking
- 9.3.12.4. Strategic Initiatives
- 9.3.13. Bushu Pharmaceuticals Ltd.
- 9.3.13.1. Company Overview
- 9.3.13.2. Financial Performance
- 9.3.13.3. Service Benchmarking
- 9.3.13.4. Strategic Initiatives
- 9.3.14. Nipro Corporation
- 9.3.14.1. Company Overview
- 9.3.14.2. Financial Performance
- 9.3.14.3. Service Benchmarking
- 9.3.14.4. Strategic Initiatives
- 9.3.1. LabCorp

