|
|
市場調査レポート
商品コード
1474989
アドバンストセラミックスの市場規模、シェア、動向分析レポート:材料別、製品別、用途別、最終用途別、地域別、セグメント予測、2024年~2030年Advanced Ceramics Market Size, Share & Trends Analysis Report By Material (Alumina, Titanate), By Product (Monolithic, CMCs), By Application (Bioceramics, Filters), By End-use (Automotive, Medical), By Region, And Segment Forecasts, 2024 - 2030 |
||||||
|
|||||||
カスタマイズ可能
|
|||||||

| アドバンストセラミックスの市場規模、シェア、動向分析レポート:材料別、製品別、用途別、最終用途別、地域別、セグメント予測、2024年~2030年 |
|
出版日: 2024年04月23日
発行: Grand View Research
ページ情報: 英文 90 Pages
納期: 2~10営業日
|

全表示
- 概要
- 図表
- 目次
アドバンストセラミックス市場の成長と動向:
Grand View Research, Inc.の最新レポートによると、世界のアドバンストセラミックス市場規模は2030年までに1,473億4,000万米ドルに達し、2024年から2030年までのCAGRは4.2%で成長すると予測されています。
市場成長の主な要因は、硬度、高強度、熱安定性などの優れた特性により、様々な産業で需要が増加していることです。セラミックがコンデンサや絶縁体のような部品の製造に不可欠であるエレクトロニクス分野の拡大や、エンジン部品や最先端センサーの製造のための自動車産業におけるアドバンストセラミックの採用拡大が、市場成長の原動力となるでしょう。
EVの人気の高まりは、アドバンストセラミックスがバッテリーセルやセンサーのような重要な部品に応用され、業界の効率性と持続可能性の追求に貢献していることから、この需要をさらに際立たせています。しかし市場は、高い製造コストや特定のセラミック材料の使用に関する厳しい規制などの抑制要因に直面しています。ビジネスチャンスは、特にヘルスケアと航空宇宙用途における革新的なセラミック材料とプロセスの開発にあります。セラミック材料は、生体適合性、耐摩耗性、高温や腐食環境に耐える能力から、医療機器、インプラント、診断ツールへの応用に大きな可能性を秘めています。例えば、セラミック材料は、歯科インプラント、人工関節、手術器具に使用されることが増えており、従来の材料に比べて性能と寿命が向上しています。
航空宇宙産業では、温度、圧力、機械的応力の極限状態に耐える材料が求められており、燃費の向上、排出ガスの削減、耐用年数の延長にとって、アドバンストセラミックスが魅力的な選択肢となっています。技術が進歩し続けるにつれて、新しいセラミック配合と製造技術の開発は、多様な産業にわたる革新的な用途への扉を開きます。競合情勢の特徴は、京セラ、CeramTec GmbH、Morgan Advanced Materials PLCのような主要プレーヤーが存在することです。これらのプレーヤーは、戦略的パートナーシップや買収を通じて競争力を獲得し、市場プレゼンスを拡大するために研究開発に注力しています。
アドバンストセラミックス市場レポートハイライト
- アルミナ材料セグメントは2023年に34.0%超の最大の収益シェアを占め、予測期間中も成長を続けると予測されます。電気・電子機器需要の高まりと製品採用の拡大がアルミナ需要を促進しています。
- セラミックス基複合材料(CMC)製品セグメントは、高強度、耐熱性、低重量などの特性により高い需要があるため、2024年から2030年にかけて最も速いCAGRで成長すると予想されます。
- 電子機器用途セグメントは、コンピュータ、スマートフォン、テレビ、家電製品への投資の増加により、2023年に最大シェアを占めました。
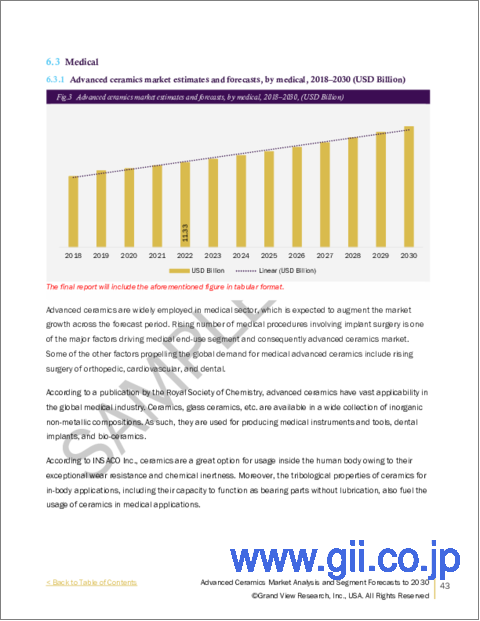
- 医療最終用途セグメントは、アドバンストセラミックスが理想的な医療用途であることが証明されたことにより、2024年から2030年にかけて最も速いCAGRで成長すると予想されています。
- 北米は2023年に28.0%以上の収益シェアを占めました。同地域の製品需要は、EV産業の成長、研究開発プロジェクトの大幅な増加、電気・電子、自動車、機械分野における急速な技術進歩などの要因によって押し上げられると予想されます。
目次
第1章 調査手法と範囲
第2章 エグゼクティブサマリー
第3章 アドバンストセラミックス市場の変数、動向、範囲
- 市場見通し
- 業界バリューチェーン分析
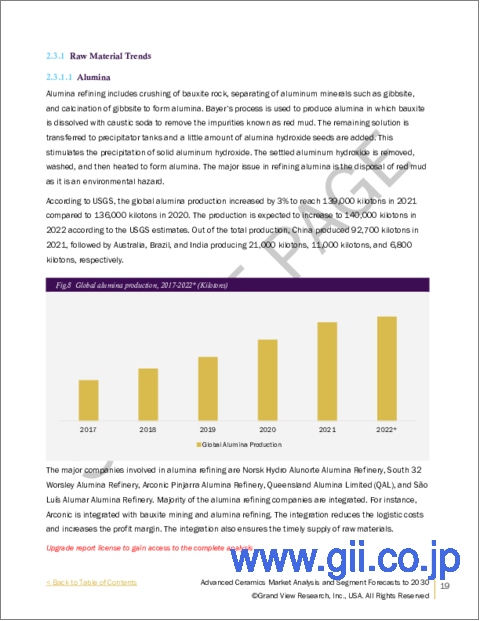
- 原材料の動向
- 販売チャネル分析
- 製造と技術の概要
- 規制の枠組み
- 市場力学
- 市場促進要因分析
- 市場抑制要因分析
- 業界の課題
- 業界の機会
- 業界分析ツール
- ポーターのファイブフォース分析
- PESTEL分析
第4章 アドバンストセラミックス市場:材料の推定・動向分析
- 材料の変動分析と市場シェア、2023年・2030年
- アルミナ
- チタン酸塩
- ジルコネート
- フェライト
- 窒化アルミニウム
- シリコンカーバイド
- 窒化シリコン
第5章 アドバンストセラミックス市場:製品の推定・動向分析
- 製品の変動分析と市場シェア、2023年・2030年
- モノリシック
- セラミックスコーティング
- セラミックス基複合材料(CMC)
第6章 アドバンストセラミックス市場:用途の推定・動向分析
- 用途の変動分析と市場シェア、2023年・2030年
- 電子機器
- 触媒サポート
- 電子デバイス
- 摩耗部品
- エンジン部品
- フィルター
- バイオセラミック
- その他
第7章 アドバンストセラミックス市場:最終用途の推定・動向分析
- 最終用途の変動分析と市場シェア、2023年・2030年
- 電気・電子
- 自動車
- 機械
- 環境
- 医療
- その他
第8章 アドバンストセラミックス市場:地域の推定・動向分析
- 地域の変動分析と市場シェア、2023年・2030年
- 北米
- 米国
- 欧州
- ドイツ
- 英国
- アジア太平洋地域
- 中国
- インド
- 中南米
- ブラジル
- 中東・アフリカ
- サウジアラビア
第9章 アドバンストセラミックス市場-競合情勢
- 主要市場参入企業による最近の動向と影響分析
- 企業分類
- 企業の市場シェア/ポジション分析、2023年
- 企業ヒートマップ分析
- 戦略マッピング
- 企業プロファイル/リスト
- 3M
- AGC Ceramics Co., Ltd.
- CeramTec GmbH
- CoorsTek Inc.
- Elan Technology
- KYOCERA Corporation
- Morgan Advanced Materials
- Murata Manufacturing Co., Ltd.
- Nishimura Advanced Ceramics Co., Ltd.
- Tosoh Ortech Advanced Ceramics
- Saint-Gobain
List of Tables
- Table 1 List of abbreviations
- Table 2 Advanced ceramics market estimates and forecasts, 2018 - 2030 (USD Million)
- Table 3 Advanced ceramics market estimates and forecasts, by material, 2018 - 2030 (USD Million)
- Table 4 Advanced ceramics market estimates and forecasts, by product, 2018 - 2030 (USD Million)
- Table 5 Advanced ceramics market estimates and forecasts, by application, 2018 - 2030 (USD Million)
- Table 6 Advanced ceramics market estimates and forecasts, by end-use, 2018 - 2030 (USD Million)
- Table 7 Advanced ceramics market estimates and forecasts, by region, 2018 - 2030 (USD Million)
- Table 8 North America advanced ceramics market estimates and forecasts, by material, 2018 - 2030 (USD Million)
- Table 9 North America advanced ceramics market estimates and forecasts, by product, 2018 - 2030 (USD Million)
- Table 10 North America advanced ceramics market estimates and forecasts, by application, 2018 - 2030 (USD Million)
- Table 11 North America advanced ceramics market estimates and forecasts, by end-use, 2018 - 2030 (USD Million)
- Table 12 U.S. advanced ceramics market estimates and forecasts, by material, 2018 - 2030 (USD Million)
- Table 13 U.S. advanced ceramics market estimates and forecasts, by product, 2018 - 2030 (USD Million)
- Table 14 U.S. advanced ceramics market estimates and forecasts, by application, 2018 - 2030 (USD Million)
- Table 15 U.S. advanced ceramics market estimates and forecasts, by end-use, 2018 - 2030 (USD Million)
- Table 16 Europe advanced ceramics market estimates and forecasts, by material, 2018 - 2030 (USD Million)
- Table 17 Europe advanced ceramics market estimates and forecasts, by product, 2018 - 2030 (USD Million)
- Table 18 Europe advanced ceramics market estimates and forecasts, by application, 2018 - 2030 (USD Million)
- Table 19 Europe advanced ceramics market estimates and forecasts, by end-use, 2018 - 2030 (USD Million)
- Table 20 Germany advanced ceramics market estimates and forecasts, by material, 2018 - 2030 (USD Million)
- Table 21 Germany advanced ceramics market estimates and forecasts, by product, 2018 - 2030 (USD Million)
- Table 22 Germany advanced ceramics market estimates and forecasts, by application, 2018 - 2030 (USD Million)
- Table 23 Germany advanced ceramics market estimates and forecasts, by end-use, 2018 - 2030 (USD Million)
- Table 24 UK advanced ceramics market estimates and forecasts, by material, 2018 - 2030 (USD Million)
- Table 25 UK advanced ceramics market estimates and forecasts, by product, 2018 - 2030 (USD Million)
- Table 26 UK advanced ceramics market estimates and forecasts, by application, 2018 - 2030 (USD Million)
- Table 27 UK advanced ceramics market estimates and forecasts, by end-use, 2018 - 2030 (USD Million)
- Table 28 Asia Pacific advanced ceramics market estimates and forecasts, by material, 2018 - 2030 (USD Million)
- Table 29 Asia Pacific advanced ceramics market estimates and forecasts, by product, 2018 - 2030 (USD Million)
- Table 30 Asia Pacific advanced ceramics market estimates and forecasts, by application, 2018 - 2030 (USD Million)
- Table 31 Asia Pacific advanced ceramics market estimates and forecasts, by end-use, 2018 - 2030 (USD Million)
- Table 32 China advanced ceramics market estimates and forecasts, by material, 2018 - 2030 (USD Million)
- Table 33 China advanced ceramics market estimates and forecasts, by product, 2018 - 2030 (USD Million)
- Table 34 China advanced ceramics market estimates and forecasts, by application, 2018 - 2030 (USD Million)
- Table 35 China advanced ceramics market estimates and forecasts, by end-use, 2018 - 2030 (USD Million)
- Table 36 India advanced ceramics market estimates and forecasts, by material, 2018 - 2030 (USD Million)
- Table 37 India advanced ceramics market estimates and forecasts, by product, 2018 - 2030 (USD Million)
- Table 38 India advanced ceramics market estimates and forecasts, by application, 2018 - 2030 (USD Million)
- Table 39 India advanced ceramics market estimates and forecasts, by end-use, 2018 - 2030 (USD Million)
- Table 40 Central & South America advanced ceramics market estimates and forecasts, by material, 2018 - 2030 (USD Million)
- Table 41 Central & South America advanced ceramics market estimates and forecasts, by product, 2018 - 2030 (USD Million)
- Table 42 Central & South America advanced ceramics market estimates and forecasts, by application, 2018 - 2030 (USD Million)
- Table 43 Central & South America advanced ceramics market estimates and forecasts, by end-use, 2018 - 2030 (USD Million)
- Table 44 Brazil advanced ceramics market estimates and forecasts, by material, 2018 - 2030 (USD Million)
- Table 45 Brazil advanced ceramics market estimates and forecasts, by product, 2018 - 2030 (USD Million)
- Table 46 Brazil advanced ceramics market estimates and forecasts, by application, 2018 - 2030 (USD Million)
- Table 47 Brazil advanced ceramics market estimates and forecasts, by end-use, 2018 - 2030 (USD Million)
- Table 48 Middle East & Africa advanced ceramics market estimates and forecasts, by material, 2018 - 2030 (USD Million)
- Table 49 Middle East & Africa advanced ceramics market estimates and forecasts, by product, 2018 - 2030 (USD Million)
- Table 50 Middle East & Africa advanced ceramics market estimates and forecasts, by application, 2018 - 2030 (USD Million)
- Table 51 Middle East & Africa advanced ceramics market estimates and forecasts, by end-use, 2018 - 2030 (USD Million)
- Table 52 Saudi Arabia advanced ceramics market estimates and forecasts, by material, 2018 - 2030 (USD Million)
- Table 53 Saudi Arabia advanced ceramics market estimates and forecasts, by product, 2018 - 2030 (USD Million)
- Table 54 Saudi Arabia advanced ceramics market estimates and forecasts, by application, 2018 - 2030 (USD Million)
- Table 55 Saudi Arabia advanced ceramics market estimates and forecasts, by end-use, 2018 - 2030 (USD Million)
List of Figures
- Fig. 1 Market Segmentation
- Fig. 2 Information Procurement
- Fig. 3 Data Analysis Models
- Fig. 4 Market Formulation And Validation
- Fig. 5 Market Snapshot
- Fig. 6 Segmental Outlook - Product, Application
- Fig. 7 Competitive Outlook
- Fig. 8 Advanced Ceramics Market Outlook, 2018 - 2030 (USD Million)
- Fig. 9 Advanced Ceramics Market - Value Chain Analysis
- Fig. 10 Advanced Ceramics Market - Market Dynamics
- Fig. 11 Advanced Ceramics Market - PORTER's Analysis
- Fig. 12 Advanced Ceramics Market - PESTEL Analysis
- Fig. 13 Advanced Ceramics Market Estimates & Forecasts, By Material: Key Takeaways
- Fig. 14 Advanced Ceramics Market Share, By Material, 2023 & 2030
- Fig. 15 Advanced Ceramics Market Estimates & Forecasts, by Alumina, 2018 - 2030 (USD Million)
- Fig. 16 Advanced Ceramics Market Estimates & Forecasts, by Titanate, 2018 - 2030 (USD Million)
- Fig. 17 Advanced Ceramics Market Estimates & Forecasts, by Zirconate, 2018 - 2030 (USD Million)
- Fig. 18 Advanced Ceramics Market Estimates & Forecasts, by Ferrite, 2018 - 2030 (USD Million)
- Fig. 19 Advanced Ceramics Market Estimates & Forecasts, by Aluminum Nitride, 2018 - 2030 (USD Million)
- Fig. 20 Advanced Ceramics Market Estimates & Forecasts, by Silicon Carbide, 2018 - 2030 (USD Million)
- Fig. 21 Advanced Ceramics Market Estimates & Forecasts, by Silicon Nitride, 2018 - 2030 (USD Million)
- Fig. 22 Advanced Ceramics Market Estimates & Forecasts, By Product: Key Takeaways
- Fig. 23 Advanced Ceramics Market Share, By Product, 2023 & 2030
- Fig. 24 Monolithic Market Estimates & Forecasts, 2018 - 2030 (USD Million)
- Fig. 25 Ceramic Coatings Market Estimates & Forecasts, 2018 - 2030 (USD Million)
- Fig. 26 Ceramic Matrix Composites Market Estimates & Forecasts, 2018 - 2030 (USD Million)
- Fig. 27 Advanced Ceramics Market Estimates & Forecasts, By Application: Key Takeaways
- Fig. 28 Advanced Ceramics Market Share, By Application, 2023 & 2030
- Fig. 29 Advanced Ceramics Market Estimates & Forecasts, in Electric Equipment, 2018 - 2030 (USD Million)
- Fig. 30 Advanced Ceramics Market Estimates & Forecasts, in Catalyst Supports, 2018 - 2030 (USD Million)
- Fig. 31 Advanced Ceramics Market Estimates & Forecasts, in Electronic Devices, 2018 - 2030 (USD Million)
- Fig. 32 Advanced Ceramics Market Estimates & Forecasts, in Wear Parts, 2018 - 2030 (USD Million)
- Fig. 33 Advanced Ceramics Market Estimates & Forecasts, in Engine Parts, 2018 - 2030 (USD Million)
- Fig. 34 Advanced Ceramics Market Estimates & Forecasts, in Filters, 2018 - 2030 (USD Million)
- Fig. 35 Advanced Ceramics Market Estimates & Forecasts, in Bioceramics, 2018 - 2030 (USD Million)
- Fig. 36 Advanced Ceramics Market Estimates & Forecasts, in Other Applications, 2018 - 2030 (USD Million)
- Fig. 37 Advanced Ceramics Market Estimates & Forecasts, By End-Use: Key Takeaways
- Fig. 38 Advanced Ceramics Market Share, By End-Use, 2023 & 2030
- Fig. 39 Advanced Ceramics Market Estimates & Forecasts, in Electric & Electronics, 2018 - 2030 (USD Million)
- Fig. 40 Advanced Ceramics Market Estimates & Forecasts, in Automotive, 2018 - 2030 (USD Million)
- Fig. 41 Advanced Ceramics Market Estimates & Forecasts, in Machinery, 2018 - 2030 (USD Million)
- Fig. 42 Advanced Ceramics Market Estimates & Forecasts, in Environmental, 2018 - 2030 (USD Million)
- Fig. 43 Advanced Ceramics Market Estimates & Forecasts, in Medical, 2018 - 2030 (USD Million)
- Fig. 44 Advanced Ceramics Market Estimates & Forecasts, in Other End-Use, 2018 - 2030 (USD Million)
- Fig. 45 Advanced Ceramics Market Revenue, By Region, 2023 & 2030 (USD Million)
- Fig. 46 North America Advanced Ceramics Market Estimates & Forecasts, 2018 - 2030 (USD Million)
- Fig. 47 U.S. Advanced Ceramics Market Estimates & Forecasts, 2018 - 2030 (USD Million)
- Fig. 48 Europe Advanced Ceramics Market Estimates & Forecasts, 2018 - 2030 (USD Million)
- Fig. 49 Germany Advanced Ceramics Market Estimates & Forecasts, 2018 - 2030 (USD Million)
- Fig. 50 UK Advanced Ceramics Market Estimates & Forecasts, 2018 - 2030 (USD Million)
- Fig. 51 Asia Pacific Advanced Ceramics Market Estimates & Forecasts, 2018 - 2030 (USD Million)
- Fig. 52 China Advanced Ceramics Market Estimates & Forecasts, 2018 - 2030 (USD Million)
- Fig. 53 India Advanced Ceramics Market Estimates & Forecasts, 2018 - 2030 (USD Million)
- Fig. 54 Central & South America Advanced Ceramics Market Estimates & Forecasts, 2018 - 2030 (USD Million)
- Fig. 55 Brazil Advanced Ceramics Market Estimates & Forecasts, 2018 - 2030 (USD Million)
- Fig. 56 Middle East & Africa Advanced Ceramics Market Estimates & Forecasts, 2018 - 2030 (USD Million)
- Fig. 57 Key Company Categorization
- Fig. 58 Company Market Positioning
- Fig. 59 Strategy Mapping
Advanced Ceramics Market Growth & Trends:
The global advanced ceramics market size is anticipated to reach USD 147.34 billion by 2030 and is anticipated to grow at a CAGR of 4.2% from 2024 to 2030, according to a new report by Grand View Research, Inc. The market growth is primarily driven by the increasing demand across various industries due to their superior properties, such as hardness, high strength, and thermal stability. The expanding electronics sector, where ceramics are essential for manufacturing components like capacitors and insulators, and the growing adoption of advanced ceramics in the automotive industry for manufacturing engine components and cutting-edge sensors will drive the market growth.
The rising popularity of EVs further highlights this demand, as advanced ceramics find applications in critical components like battery cells and sensors, contributing to the industry's pursuit of efficiency and sustainability. However, the market faces restraints, such as high production costs and stringent regulations regarding the use of certain ceramic materials. Opportunities lie in the development of innovative ceramic materials and processes, particularly in healthcare and aerospace applications. It holds immense potential for applications in medical devices, implants, and diagnostic tools due to its biocompatibility, wear resistance, and ability to withstand high temperatures and corrosive environments. For instance, ceramic materials are increasingly used in dental implants, joint replacements, and surgical tools, offering improved performance and longevity compared to traditional materials.
The aerospace industry demands materials that can withstand extreme conditions of temperature, pressure, and mechanical stress, making advanced ceramics an attractive choice for enhancing fuel efficiency, reducing emissions, and extending service life. As technology continues to advance, the development of new ceramic formulations and fabrication techniques opens doors for innovative applications across diverse industries. The competitive landscape is characterized by the presence of key players like Kyocera Corporation, CeramTec GmbH, and Morgan Advanced Materials PLC, who focus on R&D to gain a competitive edge and expand their market presence through strategic partnerships and acquisitions.
Advanced Ceramics Market Report Highlights:
- The alumina material segment held the largest revenue share of over 34.0% in 2023 and is expected to continue the growth over the forecast period. The rising demand for electrical & electronic devices and growing product adoption are propelling the demand for alumina
- The ceramic matrix composites (CMCs) product segment is expected to grow at the fastest CAGR from 2024 to 2030 owing to high demand as a result of its properties, such as high strength, thermal resistance, and low weight
- The electronic device application segment held the maximum share in 2023 due to increased investments in computers, smartphones, television, and consumer appliances
- The medical end-use segment is expected to grow at the fastest CAGR from 2024 to 2030 owing to advanced ceramics proving to be an ideal medical application
- North America held a revenue share of over 28.0% in 2023. Product demand in the region is expected to receive a boost due to factors, such as the growing EV industry, a significant increase in the number of R&D projects, and rapid technological advancements in the electrical & electronics, automotive, and machinery sectors
Table of Contents
Chapter 1. Methodology and Scope
- 1.1. Market Segmentation & Scope
- 1.2. Market Definition
- 1.3. Information Procurement
- 1.3.1. Information Analysis
- 1.3.2. Market Formulation & Data Visualization
- 1.3.3. Data Validation & Publishing
- 1.4. Research Scope and Assumptions
- 1.4.1. List of Data Sources
Chapter 2. Executive Summary
- 2.1. Market Snapshot
- 2.2. Segment Snapshot
- 2.3. Competitive Landscape Snapshot
Chapter 3. Advanced Ceramics Market Variables, Trends & Scope
- 3.1. Market Outlook
- 3.2. Industry Value Chain Analysis
- 3.2.1. Raw Material Trends
- 3.2.2. Sales Channel Analysis
- 3.3. Manufacturing & Technology Overview
- 3.4. Regulatory Framework
- 3.5. Market Dynamics
- 3.5.1. Market Driver Analysis
- 3.5.2. Market Restraint Analysis
- 3.5.3. Industry Challenges
- 3.5.4. Industry Opportunities
- 3.6. Industry Analysis Tools
- 3.6.1. Porter's Five Forces Analysis
- 3.6.2. PESTEL Analysis
Chapter 4. Advanced Ceramics Market: Material Estimates & Trend Analysis
- 4.1. Material Movement Analysis & Market Share, 2023 & 2030
- 4.2. Alumina
- 4.2.1. Market Estimates and Forecasts, 2018 - 2030 (USD Million)
- 4.3. Titanate
- 4.3.1. Market Estimates and Forecasts, 2018 - 2030 (USD Million)
- 4.4. Zirconate
- 4.4.1. Market Estimates and Forecasts, 2018 - 2030 (USD Million)
- 4.5. Ferrite
- 4.5.1. Market Estimates and Forecasts, 2018 - 2030 (USD Million)
- 4.6. Aluminum Nitride
- 4.6.1. Market Estimates and Forecasts, 2018 - 2030 (USD Million)
- 4.7. Silicon Carbide
- 4.7.1. Market Estimates and Forecasts, 2018 - 2030 (USD Million)
- 4.8. Silicon Nitride
- 4.8.1. Market Estimates and Forecasts, 2018 - 2030 (USD Million)
Chapter 5. Advanced Ceramics Market: Product Estimates & Trend Analysis
- 5.1. Product Movement Analysis & Market Share, 2023 & 2030
- 5.2. Monolithic
- 5.2.1. Market Estimates and Forecasts, 2018 - 2030 (USD Million)
- 5.3. Ceramic Coatings
- 5.3.1. Market Estimates and Forecasts, 2018 - 2030 (USD Million)
- 5.4. Ceramic Matrix Composites (CMCs)
- 5.4.1. Market Estimates and Forecasts, 2018 - 2030 (USD Million)
Chapter 6. Advanced Ceramics Market: Application Estimates & Trend Analysis
- 6.1. Application Movement Analysis & Market Share, 2023 & 2030
- 6.2. Electric Equipment
- 6.2.1. Market Estimates and Forecasts, 2018 - 2030 (USD Million)
- 6.3. Catalyst Supports
- 6.3.1. Market Estimates and Forecasts, 2018 - 2030 (USD Million)
- 6.4. Electronic Devices
- 6.4.1. Market Estimates and Forecasts, 2018 - 2030 (USD Million)
- 6.5. Wear Parts
- 6.5.1. Market Estimates and Forecasts, 2018 - 2030 (USD Million)
- 6.6. Engine Parts
- 6.6.1. Market Estimates and Forecasts, 2018 - 2030 (USD Million)
- 6.7. Filters
- 6.7.1. Market Estimates and Forecasts, 2018 - 2030 (USD Million)
- 6.8. Bioceramic
- 6.8.1. Market Estimates and Forecasts, 2018 - 2030 (USD Million)
- 6.9. Other Applications
- 6.9.1. Market Estimates and Forecasts, 2018 - 2030 (USD Million)
Chapter 7. Advanced Ceramics Market: End-use Estimates & Trend Analysis
- 7.1. End-Use Movement Analysis & Market Share, 2023 & 2030
- 7.2. Electrical & Electronics
- 7.2.1. Market Estimates and Forecasts, 2018 - 2030 (USD Million)
- 7.3. Automotive
- 7.3.1. Market Estimates and Forecasts, 2018 - 2030 (USD Million)
- 7.4. Machinery
- 7.4.1. Market Estimates and Forecasts, 2018 - 2030 (USD Million)
- 7.5. Environmental
- 7.5.1. Market Estimates and Forecasts, 2018 - 2030 (USD Million)
- 7.6. Medical
- 7.6.1. Market Estimates and Forecasts, 2018 - 2030 (USD Million)
- 7.7. Other End-use
- 7.7.1. Market Estimates and Forecasts, 2018 - 2030 (USD Million)
Chapter 8. Advanced Ceramics Market: Regional Estimates & Trend Analysis
- 8.1. Regional Movement Analysis & Market Share, 2023 & 2030
- 8.2. North America
- 8.2.1. Market Estimates and Forecasts, 2018 - 2030 (USD Million)
- 8.2.2. Market Estimates and Forecasts, By Material, 2018 - 2030 (USD Million)
- 8.2.3. Market Estimates and Forecasts, By Product, 2018 - 2030 (USD Million)
- 8.2.4. Market Estimates and Forecasts, By Application, 2018 - 2030 (USD Million)
- 8.2.5. Market Estimates and Forecasts, By End-Use, 2018 - 2030 (USD Million)
- 8.2.6. U.S.
- 8.2.6.1. Key country dynamics
- 8.2.6.2. Market Estimates & Forecasts, 2018 - 2030 (USD Million)
- 8.2.6.3. Market Estimates & Forecasts, By Material, 2018 - 2030 (USD Million)
- 8.2.6.4. Market Estimates & Forecasts, By Product, 2018 - 2030 (USD Million)
- 8.2.6.5. Market Estimates & Forecasts, By Application, 2018 - 2030 (USD Million)
- 8.2.6.6. Market Estimates & Forecasts, By End-Use, 2018 - 2030 (USD Million)
- 8.3. Europe
- 8.3.1. Market Estimates and Forecasts, 2018 - 2030 (USD Million)
- 8.3.2. Market Estimates and Forecasts, By Material, 2018 - 2030 (USD Million)
- 8.3.3. Market Estimates and Forecasts, By Product, 2018 - 2030 (USD Million)
- 8.3.4. Market Estimates and Forecasts, By Application, 2018 - 2030 (USD Million)
- 8.3.5. Market Estimates and Forecasts, By End-Use, 2018 - 2030 (USD Million)
- 8.3.6. Germany
- 8.3.6.1. Key country dynamics
- 8.3.6.2. Market Estimates & Forecasts, 2018 - 2030 (USD Million)
- 8.3.6.3. Market Estimates & Forecasts, By Material, 2018 - 2030 (USD Million)
- 8.3.6.4. Market Estimates & Forecasts, By Product, 2018 - 2030 (USD Million)
- 8.3.6.5. Market Estimates & Forecasts, By Application, 2018 - 2030 (USD Million)
- 8.3.6.6. Market Estimates & Forecasts, By End-Use, 2018 - 2030 (USD Million)
- 8.3.7. UK
- 8.3.7.1. Key country dynamics
- 8.3.7.2. Market Estimates & Forecasts, 2018 - 2030 (USD Million)
- 8.3.7.3. Market Estimates & Forecasts, By Material, 2018 - 2030 (USD Million)
- 8.3.7.4. Market Estimates & Forecasts, By Product, 2018 - 2030 (USD Million)
- 8.3.7.5. Market Estimates & Forecasts, By Application, 2018 - 2030 (USD Million)
- 8.3.7.6. Market Estimates & Forecasts, By End-Use, 2018 - 2030 (USD Million)
- 8.4. Asia Pacific
- 8.4.1. Market Estimates and Forecasts, 2018 - 2030 (USD Million)
- 8.4.2. Market Estimates and Forecasts, By Material, 2018 - 2030 (USD Million)
- 8.4.3. Market Estimates and Forecasts, By Product, 2018 - 2030 (USD Million)
- 8.4.4. Market Estimates and Forecasts, By Application, 2018 - 2030 (USD Million)
- 8.4.5. Market Estimates and Forecasts, By End-Use, 2018 - 2030 (USD Million)
- 8.4.6. China
- 8.4.6.1. Key country dynamics
- 8.4.6.2. Market Estimates & Forecasts, 2018 - 2030 (USD Million)
- 8.4.6.3. Market Estimates & Forecasts, By Material, 2018 - 2030 (USD Million)
- 8.4.6.4. Market Estimates & Forecasts, By Product, 2018 - 2030 (USD Million)
- 8.4.6.5. Market Estimates & Forecasts, By Application, 2018 - 2030 (USD Million)
- 8.4.6.6. Market Estimates & Forecasts, By End-Use, 2018 - 2030 (USD Million)
- 8.4.7. India
- 8.4.7.1. Key country dynamics
- 8.4.7.2. Market Estimates & Forecasts, 2018 - 2030 (USD Million)
- 8.4.7.3. Market Estimates & Forecasts, By Material, 2018 - 2030 (USD Million)
- 8.4.7.4. Market Estimates & Forecasts, By Product, 2018 - 2030 (USD Million)
- 8.4.7.5. Market Estimates & Forecasts, By Application, 2018 - 2030 (USD Million)
- 8.4.7.6. Market Estimates & Forecasts, By End-Use, 2018 - 2030 (USD Million)
- 8.5. Central & South America
- 8.5.1. Market Estimates and Forecasts, 2018 - 2030 (USD Million)
- 8.5.2. Market Estimates and Forecasts, By Material, 2018 - 2030 (USD Million)
- 8.5.3. Market Estimates and Forecasts, By Product, 2018 - 2030 (USD Million)
- 8.5.4. Market Estimates and Forecasts, By Application, 2018 - 2030 (USD Million)
- 8.5.5. Market Estimates and Forecasts, By End-Use, 2018 - 2030 (USD Million)
- 8.5.6. Brazil
- 8.5.6.1. Key country dynamics
- 8.5.6.2. Market Estimates & Forecasts, 2018 - 2030 (USD Million)
- 8.5.6.3. Market Estimates & Forecasts, By Material, 2018 - 2030 (USD Million)
- 8.5.6.4. Market Estimates & Forecasts, By Product, 2018 - 2030 (USD Million)
- 8.5.6.5. Market Estimates & Forecasts, By Application, 2018 - 2030 (USD Million)
- 8.5.6.6. Market Estimates & Forecasts, By End-Use, 2018 - 2030 (USD Million)
- 8.6. Middle East & Africa
- 8.6.1. Market Estimates and Forecasts, 2018 - 2030 (USD Million)
- 8.6.2. Market Estimates and Forecasts, By Material, 2018 - 2030 (USD Million)
- 8.6.3. Market Estimates and Forecasts, By Product, 2018 - 2030 (USD Million)
- 8.6.4. Market Estimates and Forecasts, By Application, 2018 - 2030 (USD Million)
- 8.6.5. Market Estimates and Forecasts, By End-Use, 2018 - 2030 (USD Million)
- 8.6.6. Saudi Arabia
- 8.6.6.1. Key country dynamics
- 8.6.6.2. Market Estimates & Forecasts, 2018 - 2030 (USD Million)
- 8.6.6.3. Market Estimates & Forecasts, By Material, 2018 - 2030 (USD Million)
- 8.6.6.4. Market Estimates & Forecasts, By Product, 2018 - 2030 (USD Million)
- 8.6.6.5. Market Estimates & Forecasts, By Application, 2018 - 2030 (USD Million)
- 8.6.6.6. Market Estimates & Forecasts, By End-Use, 2018 - 2030 (USD Million)
Chapter 9. Advanced Ceramics Market - Competitive Landscape
- 9.1. Recent Developments & Impact Analysis, By Key Market Participants
- 9.2. Company Categorization
- 9.3. Company Market Share/Position Analysis, 2023
- 9.4. Company Heat Map Analysis
- 9.5. Strategy Mapping
- 9.6. Company Profiles/Listings
- 9.6.1. 3M
- 9.6.1.1. Participant's overview
- 9.6.1.2. Financial performance
- 9.6.1.3. Product benchmarking
- 9.6.1.4. Recent developments
- 9.6.2. AGC Ceramics Co., Ltd.
- 9.6.2.1. Participant's overview
- 9.6.2.2. Financial performance
- 9.6.2.3. Product benchmarking
- 9.6.2.4. Recent developments
- 9.6.3. CeramTec GmbH
- 9.6.3.1. Participant's overview
- 9.6.3.2. Financial performance
- 9.6.3.3. Product benchmarking
- 9.6.3.4. Recent developments
- 9.6.4. CoorsTek Inc.
- 9.6.4.1. Participant's overview
- 9.6.4.2. Financial performance
- 9.6.4.3. Product benchmarking
- 9.6.4.4. Recent developments
- 9.6.5. Elan Technology
- 9.6.5.1. Participant's overview
- 9.6.5.2. Financial performance
- 9.6.5.3. Product benchmarking
- 9.6.5.4. Recent developments
- 9.6.6. KYOCERA Corporation
- 9.6.6.1. Participant's overview
- 9.6.6.2. Financial performance
- 9.6.6.3. Product benchmarking
- 9.6.6.4. Recent developments
- 9.6.7. Morgan Advanced Materials
- 9.6.7.1. Participant's overview
- 9.6.7.2. Financial performance
- 9.6.7.3. Product benchmarking
- 9.6.7.4. Recent developments
- 9.6.8. Murata Manufacturing Co., Ltd.
- 9.6.8.1. Participant's overview
- 9.6.8.2. Financial performance
- 9.6.8.3. Product benchmarking
- 9.6.8.4. Recent developments
- 9.6.9. Nishimura Advanced Ceramics Co., Ltd.
- 9.6.9.1. Participant's overview
- 9.6.9.2. Financial performance
- 9.6.9.3. Product benchmarking
- 9.6.9.4. Recent developments
- 9.6.10. Tosoh Ortech Advanced Ceramics
- 9.6.10.1. Participant's overview
- 9.6.10.2. Financial performance
- 9.6.10.3. Product benchmarking
- 9.6.10.4. Recent developments
- 9.6.11. Saint-Gobain
- 9.6.11.1. Participant's overview
- 9.6.11.2. Financial performance
- 9.6.11.3. Product benchmarking
- 9.6.11.4. Recent developments
- 9.6.1. 3M

