|
|
市場調査レポート
商品コード
1446563
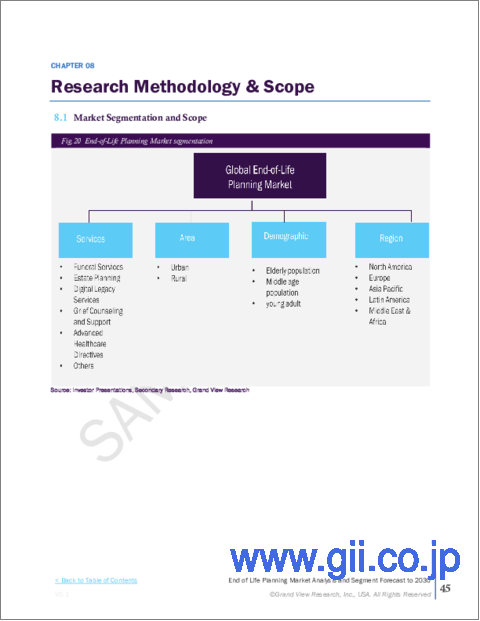
終活計画の市場規模、シェア、動向分析レポート:タイプ別、サービス別、地域別、人口動態別、セグメント予測、2024年~2030年End of Life Planning Market Size, Share & Trends Analysis Report By Type, By Service (Funeral Services, Estate Planning, Digital Legacy Services, Grief Counseling and Support), By Area, By Demographic, By Region, And Segment Forecasts, 2024 - 2030 |
||||||

|
|||||||
カスタマイズ可能
|
|||||||

| 終活計画の市場規模、シェア、動向分析レポート:タイプ別、サービス別、地域別、人口動態別、セグメント予測、2024年~2030年 |
|
出版日: 2024年02月29日
発行: Grand View Research
ページ情報: 英文 133 Pages
納期: 2~10営業日
|

全表示
- 概要
- 図表
- 目次
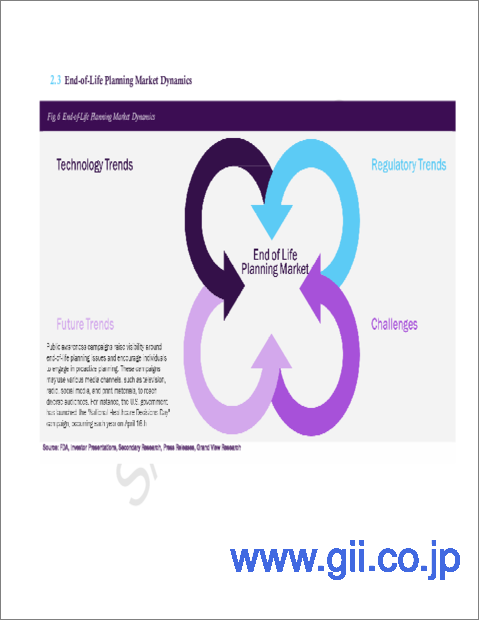
終活計画(End of Life Planning)市場の成長と動向:
Grand View Research, Inc.の最新レポートによると、世界の終活計画市場規模は2030年までに451億7,000万米ドルに達すると予測され、2024年から2030年までのCAGRは6.52%で成長すると予測されています。
同市場の成長の主な要因は、終活プランニングの重要性に対する意識の高まりや、デジタル化とテクノロジーの採用拡大などです。
老人人口の増加は市場成長の主な要因です。国連のWorld Population Prospectsによると、2022年の65歳以上の世界人口は7億7,100万人で、世界人口の10%近くを占める。この人口集団は急速な成長を遂げており、2050年には16%、2100年には24%に達すると予測されています。世界の人口が高齢化するにつれて、終末期医療に対する需要が高まっています。高齢者は自分の死について考え、遺産、葬儀の希望、ヘルスケアに関する指示書などの手配をする傾向が強くなっています。
個人の嗜好、文化的伝統、宗教的信条に対応した、個別化・カスタマイズされた終末期プランニング・ソリューションへの需要が高まっています。サービス・プロバイダーは、多様なニーズに対応し、クライアントの希望が尊重されるよう、幅広い選択肢を提供しています。さらに、終末期医療や葬儀費用の経済的影響に対する懸念から、多くの個人が事前に計画を立て、愛する人の負担を軽減するための手配を行うようになっています。
さらに、同市場の主要企業は、市場でのプレゼンスと製品リーチを拡大するため、さまざまな戦略的取り組みを行っています。例えば、2023年2月、OneAccord HealthとADVault Inc.は、終末期の意思決定を強化することを目的とした革新的なデジタルサービスを拡張します。このイニシアチブは、より直接的な消費者エンゲージメントを取り入れることで、その焦点を広げることを目指しています。その目標は、ヘルスケア専門家、利害関係者、地域社会が、事前ケア計画中の患者の価値観、目標、嗜好に関する議論に参加できるようにすることです。
終活計画市場レポートハイライト
- サービス別では、遺産計画分野が2023年に28.74%の最大売上シェアで市場を占めました。法律的に複雑なため、遺産法を専門とする弁護士による専門的な支援が必要となることが多く、有利なセグメントとなっています。
- 高度ヘルスケア指示書セグメントは、予測数年間で最も速いCAGR 7.09%で成長すると予想されています。高度医療指示書の重要性に対する個人の意識が高まっています。人々は自分の医療について事前に決定することの重要性に気づいています。
- 都市部は通常、法律、金融、ヘルスケアサービスを含む幅広いサービスへのアクセスが良いためです。
- 農村部セグメントは、予測数年間で最も速いCAGRで成長すると予想されます。同地域における終末期プランニングサービスに対する意識の高まりが、予測期間における市場成長の原動力となります。
- 人口動態に基づくと、高齢者人口セグメントは2023年に73.89%の最大収益シェアで市場をリードしました。高齢になるにつれて、人々は自分の死を意識するようになり、遺産分配、ヘルスケア嗜好、葬儀の手配といった終末期に関する計画を立てる必要性が高まっています。
- 北米は、2023年に35.76%の最大の売上シェアを占めました。同地域は、終末期プランニング活動を支援する法的・金融的インフラが確立されています。個人は、経験豊富な弁護士やファイナンシャル・プランナーなど、遺産計画や関連サービスを専門とする専門家にアクセスすることができます。
目次
第1章 調査手法と範囲
第2章 エグゼクティブサマリー
第3章 終活計画市場の変数、動向、および範囲
- 市場系統の見通し
- 市場力学
- 市場促進要因分析
- 市場抑制要因分析
- 終活計画市場分析ツール
- 業界分析- ポーターのファイブフォース分析
- PESTEL分析
第4章 終活計画市場:サービスの推定・動向分析
- セグメントダッシュボード
- 終活計画市場:サービス変動分析
- 世界の終活計画市場規模とサービス別動向分析、2018年から2030年
- 葬儀サービス
- エステートプランニング
- デジタルレガシーサービス
- カウンセリングとサポート
- ヘルスケア指令
- その他
第5章 終活計画市場:エリア推定・動向分析
- セグメントダッシュボード
- 終活計画市場:エリア変動分析
- 世界の終活計画市場規模と動向分析、エリア別、2018年から2030年
- 都市部
- 田舎
第6章 終活計画市場:人口推定・動向分析
- セグメントダッシュボード
- 終活計画市場:人口変動分析、2022年および2030年
- 人口動態別の世界の終活計画市場規模と動向分析、2018年から2030年
- 高齢者人口
- 中年人口
- ヤングアダルト
第7章 終活計画市場:サービス別、地域別、人口動態別の地域推定・動向分析
- 終活計画市場:地域変動分析、2022年および2030年
- 北米
- 欧州
- アジア太平洋地域
- ラテンアメリカ
- 中東とアフリカ
第8章 競合情勢
- 企業の分類
- 企業の市場シェア分析、2023年
- 戦略マッピング
- 企業プロファイル・一覧表
- Everplans
- Cake
- TrustandWill
- Funeralocity
- Eterneva
- Gathered Here Pvt Ltd.
- Sue Mackey
- Dignity
- Service Corporation International(SCI)
- Death with Dignity
List of Tables
- Table 1 List of Secondary Sources
- Table 2 List of Abbreviations
- Table 3 Global End of Life Planning Market, by Service, 2018 - 2030 (USD Million)
- Table 4 Global End of Life Planning Market, By Area, 2018 - 2030 (USD Million)
- Table 5 Global End of Life Planning Market, By Demographic, 2018 - 2030 (USD Million)
- Table 6 Global End of Life Planning Market, By Region, 2018 - 2030 (USD Million)
- Table 7 North America End of Life Planning Market, By Country, 2018 - 2030 (USD Million)
- Table 8 North America End of Life Planning Market, By Service, 2018 - 2030 (USD Million)
- Table 9 North America End of Life Planning Market, By Area, 2018 - 2030 (USD Million)
- Table 10 North America End of Life Planning Market, By Demographic, 2018 - 2030 (USD Million)
- Table 11 U.S. End of Life Planning Market, By Service, 2018 - 2030 (USD Million)
- Table 12 U.S. End of Life Planning Market, By Area, 2018 - 2030 (USD Million)
- Table 13 U.S. End of Life Planning Market, By Demographic, 2018 - 2030 (USD Million)
- Table 14 Canada End of Life Planning Market, By Service, 2018 - 2030 (USD Million)
- Table 15 Canada End of Life Planning Market, By Area, 2018 - 2030 (USD Million)
- Table 16 Canada End of Life Planning Market, By Demographic, 2018 - 2030 (USD Million)
- Table 17 Europe End of Life Planning Market, By Country, 2018 - 2030 (USD Million)
- Table 18 Europe End of Life Planning Market, By Service, 2018 - 2030 (USD Million)
- Table 19 Europe End of Life Planning Market, By Area, 2018 - 2030 (USD Million)
- Table 20 Europe End of Life Planning Market, By Demographic, 2018 - 2030 (USD Million)
- Table 21 Germany End of Life Planning Market, By Service, 2018 - 2030 (USD Million)
- Table 22 Germany End of Life Planning Market, By Area, 2018 - 2030 (USD Million)
- Table 23 Germany End of Life Planning Market, By Demographic, 2018 - 2030 (USD Million)
- Table 24 UK End of Life Planning Market, By Service, 2018 - 2030 (USD Million)
- Table 25 UK End of Life Planning Market, By Area, 2018 - 2030 (USD Million)
- Table 26 UK End of Life Planning Market, By Demographic, 2018 - 2030 (USD Million)
- Table 27 France End of Life Planning Market, By Service, 2018 - 2030 (USD Million)
- Table 28 France End of Life Planning Market, By Area, 2018 - 2030 (USD Million)
- Table 29 France End of Life Planning Market, By Demographic, 2018 - 2030 (USD Million)
- Table 30 Italy End of Life Planning Market, By Service, 2018 - 2030 (USD Million)
- Table 31 Italy End of Life Planning Market, By Area, 2018 - 2030 (USD Million)
- Table 32 Italy End of Life Planning Market, By Demographic, 2018 - 2030 (USD Million)
- Table 33 Spain End of Life Planning Market, By Service, 2018 - 2030 (USD Million)
- Table 34 Spain End of Life Planning Market, By Area, 2018 - 2030 (USD Million)
- Table 35 Spain End of Life Planning Market, By Demographic, 2018 - 2030 (USD Million)
- Table 36 Denmark End of Life Planning Market, By Service, 2018 - 2030 (USD Million)
- Table 37 Denmark End of Life Planning Market, By Area, 2018 - 2030 (USD Million)
- Table 38 Denmark End of Life Planning Market, By Demographic, 2018 - 2030 (USD Million)
- Table 39 Sweden End of Life Planning Market, By Service, 2018 - 2030 (USD Million)
- Table 40 Sweden End of Life Planning Market, By Area, 2018 - 2030 (USD Million)
- Table 41 Sweden End of Life Planning Market, By Demographic, 2018 - 2030 (USD Million)
- Table 42 Norway End of Life Planning Market, By Service, 2018 - 2030 (USD Million)
- Table 43 Norway End of Life Planning Market, By Area, 2018 - 2030 (USD Million)
- Table 44 Norway End of Life Planning Market, By Demographic, 2018 - 2030 (USD Million)
- Table 45 Asia Pacific End of Life Planning Market, By Country, 2018 - 2030 (USD Million)
- Table 46 Asia Pacific End of Life Planning Market, By Service, 2018 - 2030 (USD Million)
- Table 47 Asia Pacific End of Life Planning Market, By Area, 2018 - 2030 (USD Million)
- Table 48 Asia Pacific End of Life Planning Market, By Demographic, 2018 - 2030 (USD Million)
- Table 49 China End of Life Planning Market, By Service, 2018 - 2030 (USD Million)
- Table 50 China End of Life Planning Market, By Area, 2018 - 2030 (USD Million)
- Table 51 China End of Life Planning Market, By Demographic, 2018 - 2030 (USD Million)
- Table 52 Japan End of Life Planning Market, By Service, 2018 - 2030 (USD Million)
- Table 53 Japan End of Life Planning Market, By Area, 2018 - 2030 (USD Million)
- Table 54 Japan End of Life Planning Market, By Demographic, 2018 - 2030 (USD Million)
- Table 55 India End of Life Planning Market, By Service, 2018 - 2030 (USD Million)
- Table 56 India End of Life Planning Market, By Area, 2018 - 2030 (USD Million)
- Table 57 India End of Life Planning Market, By Demographic, 2018 - 2030 (USD Million)
- Table 58 South Korea End of Life Planning Market, By Service, 2018 - 2030 (USD Million)
- Table 59 South Korea End of Life Planning Market, By Area, 2018 - 2030 (USD Million)
- Table 60 South Korea End of Life Planning Market, By Demographic, 2018 - 2030 (USD Million)
- Table 61 Australia End of Life Planning Market, By Service, 2018 - 2030 (USD Million)
- Table 62 Australia End of Life Planning Market, By Area, 2018 - 2030 (USD Million)
- Table 63 Australia End of Life Planning Market, By Demographic, 2018 - 2030 (USD Million)
- Table 64 ThailandEnd of Life Planning Market, By Service, 2018 - 2030 (USD Million)
- Table 65 ThailandEnd of Life Planning Market, By Area, 2018 - 2030 (USD Million)
- Table 66 ThailandEnd of Life Planning Market, By Demographic, 2018 - 2030 (USD Million)
- Table 67 Latin America End of Life Planning Market, By Country, 2018 - 2030 (USD Million)
- Table 68 Latin America End of Life Planning Market, By Service, 2018 - 2030 (USD Million)
- Table 69 Latin America End of Life Planning Market, By Area, 2018 - 2030 (USD Million)
- Table 70 Latin America End of Life Planning Market, By Demographic, 2018 - 2030 (USD Million)
- Table 71 Brazil End of Life Planning Market, By Service, 2018 - 2030 (USD Million)
- Table 72 Brazil End of Life Planning Market, By Area, 2018 - 2030 (USD Million)
- Table 73 Brazil End of Life Planning Market, By Demographic, 2018 - 2030 (USD Million)
- Table 74 Mexico End of Life Planning Market, By Service, 2018 - 2030 (USD Million)
- Table 75 Mexico End of Life Planning Market, By Area, 2018 - 2030 (USD Million)
- Table 76 Mexico End of Life Planning Market, By Demographic, 2018 - 2030 (USD Million)
- Table 77 Argentina End of Life Planning Market, By Service, 2018 - 2030 (USD Million)
- Table 78 Argentina End of Life Planning Market, By Area, 2018 - 2030 (USD Million)
- Table 79 Argentina End of Life Planning Market, By Demographic, 2018 - 2030 (USD Million)
- Table 80 Middle East & Africa End of Life Planning Market, By Country, 2018 - 2030 (USD Million)
- Table 81 Middle East & Africa End of Life Planning Market, By Service, 2018 - 2030 (USD Million)
- Table 82 Middle East & Africa End of Life Planning Market, By Area, 2018 - 2030 (USD Million)
- Table 83 Middle East & Africa End of Life Planning Market, By Demographic, 2018 - 2030 (USD Million)
- Table 84 South Africa End of Life Planning Market, By Service, 2018 - 2030 (USD Million)
- Table 85 South Africa End of Life Planning Market, By Area, 2018 - 2030 (USD Million)
- Table 86 South Africa End of Life Planning Market, By Demographic, 2018 - 2030 (USD Million)
- Table 87 Saudi Arabia End of Life Planning Market, By Service, 2018 - 2030 (USD Million)
- Table 88 Saudi Arabia End of Life Planning Market, By Area, 2018 - 2030 (USD Million)
- Table 89 Saudi Arabia End of Life Planning Market, By Demographic, 2018 - 2030 (USD Million)
- Table 90 UAE End of Life Planning Market, By Service, 2018 - 2030 (USD Million)
- Table 91 UAE End of Life Planning Market, By Area, 2018 - 2030 (USD Million)
- Table 92 UAE End of Life Planning Market, By Demographic, 2018 - 2030 (USD Million)
- Table 93 Kuwait End of Life Planning Market, By Service, 2018 - 2030 (USD Million)
- Table 94 Kuwait End of Life Planning Market, By Area, 2018 - 2030 (USD Million)
- Table 95 Kuwait End of Life Planning Market, By Demographic, 2018 - 2030 (USD Million)
List of Figures
- Fig. 1 Information Procurement
- Fig. 2 Primary Research Pattern
- Fig. 3 Market Research Approaches
- Fig. 4 Value Chain-Based Sizing & Forecasting
- Fig. 5 Market Formulation & Validation
- Fig. 6 End of Life Planning Market: Market Segmentation
- Fig. 7 Market Driver Relevance Analysis (Current & Future Impact)
- Fig. 8 Market Restraint Relevance Analysis (Current & Future Impact)
- Fig. 9 Market Challenge Relevance Analysis (Current & Future Impact)
- Fig. 10 Penetration & Growth Prospect Mapping
- Fig. 11 SWOT Analysis, By Factor (Political & Legal, Economic and Technological)
- Fig. 12 Porter's Five Forces Analysis
- Fig. 13 Market Penetration Vs Growth Prospect Mapping, 2021
- Fig. 14 Regional Marketplace: Key Takeaways
- Fig. 15 Global End of Life Planning Market for Funeral Services, 2018 - 2030 (USD Million)
- Fig. 16 Global End of Life Planning Market for Estate Planning, 2018 - 2030 (USD Million)
- Fig. 17 Global End of Life Planning Market for Digital Legacy Services, 2018 - 2030 (USD Million)
- Fig. 18 Global End of Life Planning Market for Grief Counseling and Support, 2018 - 2030 (USD Million)
- Fig. 19 Global End of Life Planning Market for Advanced Healthcare Directives, 2018 - 2030 (USD Million)
- Fig. 20 Global End of Life Planning Market for Others, 2018 - 2030 (USD Million)
- Fig. 21 Global End of Life Planning Market for Urban, 2018 - 2030 (USD Million)
- Fig. 22 Global End of Life Planning Market for Rural, 2018 - 2030 (USD Million)
- Fig. 23 Global End of Life Planning Market for Elderly population, 2018 - 2030 (USD Million)
- Fig. 24 Global End of Life Planning Market for Middle age population, 2018 - 2030 (USD Million)
- Fig. 25 Global End of Life Planning Market for young adult, 2018 - 2030 (USD Million)
- Fig. 26 Regional Outlook, 2021 & 2030
- Fig. 27 North America End of Life Planning Market, 2018 - 2030 (USD Million)
- Fig. 28 U.S. End of Life Planning Market, 2018 - 2030 (USD Million)
- Fig. 29 Canada End of Life Planning Market, 2018 - 2030 (USD Million)
- Fig. 30 Europe End of Life Planning Market, 2018 - 2030 (USD Million)
- Fig. 31 Germany End of Life Planning Market, 2018 - 2030 (USD Million)
- Fig. 32 UK End of Life Planning Market, 2018 - 2030 (USD Million)
- Fig. 33 France End of Life Planning Market, 2018 - 2030 (USD Million)
- Fig. 34 Italy End of Life Planning Market, 2018 - 2030 (USD Million)
- Fig. 35 Spain End of Life Planning Market, 2018 - 2030 (USD Million)
- Fig. 36 Denmark End of Life Planning Market, 2018 - 2030 (USD Million)
- Fig. 37 Sweden End of Life Planning Market, 2018 - 2030 (USD Million)
- Fig. 38 Norway End of Life Planning Market, 2018 - 2030 (USD Million)
- Fig. 39 Asia Pacific End of Life Planning Market, 2018 - 2030 (USD Million)
- Fig. 40 Japan End of Life Planning Market, 2018 - 2030 (USD Million)
- Fig. 41 China End of Life Planning Market, 2018 - 2030 (USD Million)
- Fig. 42 India End of Life Planning Market, 2018 - 2030 (USD Million)
- Fig. 43 Australia End of Life Planning Market, 2018 - 2030 (USD Million)
- Fig. 44 South Korea End of Life Planning Market, 2018 - 2030 (USD Million)
- Fig. 45 Thailand End of Life Planning Market, 2018 - 2030 (USD Million)
- Fig. 46 Latin America End of Life Planning Market, 2018 - 2030 (USD Million)
- Fig. 47 Brazil End of Life Planning Market, 2018 - 2030 (USD Million)
- Fig. 48 Mexico End of Life Planning Market, 2018 - 2030 (USD Million)
- Fig. 49 Argentina End of Life Planning Market, 2018 - 2030 (USD Million)
- Fig. 50 Middle East and Africa End of Life Planning Market, 2018 - 2030 (USD Million)
- Fig. 51 South Africa End of Life Planning Market, 2018 - 2030 (USD Million)
- Fig. 52 Saudi Arabia End of Life Planning Market, 2018 - 2030 (USD Million)
- Fig. 53 UAE End of Life Planning Market, 2018 - 2030 (USD Million)
- Fig. 54 Kuwait End of Life Planning Market, 2018 - 2030 (USD Million)
End of Life Planning Market Growth & Trends:
The global end of life planning market size is expected to reach USD 45.17 billion by 2030 and it is projected to grow at a CAGR of 6.52% from 2024 to 2030, according to a new report by Grand View Research, Inc. The market's growth is primarily attributed to factors such as growing awareness about the importance of end-of-life planning and growing adoption of digitalization and technology.
The increasing geriatric population is a major contributor to the market growth. According to the United Nations World Population Prospects, in 2022, the global population of individuals aged 65 and above stood at 771 million, constituting nearly 10% of the world's populace. This demographic cohort has been experiencing rapid growth, projected to reach 16% by 2050 and an estimated 24% by 2100. As the global population ages, there is an increasing demand for end-of-life planning services. Older individuals are more likely to consider their mortality and make arrangements for their estates, funeral preferences, and healthcare directives.
There is a growing demand for personalized and customized end-of-life planning solutions that cater to individual preferences, cultural traditions, and religious beliefs. Service providers offer a wide range of options to accommodate diverse needs and ensure that client's wishes are respected. Moreover, Concerns about the financial implications of end-of-life care and funeral expenses drive many individuals to plan ahead and make arrangements to alleviate the burden on their loved ones.
Furthermore, key companies in the market are undertaking various strategic initiatives to expand their market presence and product reach. For instance, in February 2023, OneAccord Health, and ADVault Inc. are extending their innovative digital service aimed at empowering end-of-life decisions. This initiative aims to broaden its focus by incorporating more direct-to-consumer engagement. Its goal is to empower healthcare professionals, stakeholders, and the community to participate in discussions about patients' values, goals, and preferences during advance care planning.
End of Life Planning Market Report Highlights:
- Based on service, the estate planning segment held the market with the largest revenue share of 28.74% in 2023. The legal complexities often require professional assistance from lawyers specializing in estate law, making it a lucrative segment
- The advanced healthcare directives segment is expected to grow at the fastest CAGR of 7.09% in the forecast years. There has been an increasing awareness among individuals about the importance of advanced healthcare directives. People are realizing the significance of making decisions about their medical care in advance
- Based on area, the urban segment led the market with the largest revenue share of in 2023, due to Urban areas usually have better access to a wide range of services, including legal, financial, and healthcare services
- The rural segment is expected to grow at the fastest CAGR in the forecast years. The increasing awareness about the end-of-line planning services in the area drive market growth in the forecast period
- Based on demographic, the elderly population segment led the market with a largest revenue share of 73.89% in 2023. As people age, they become more aware of their mortality and the need to plan for end-of-life matters such as estate distribution, healthcare preferences, and funeral arrangements
- North America held the market with the largest revenue share of 35.76% in 2023. The region has well-established legal and financial infrastructures that support end-of-life planning activities. Individuals can access experienced lawyers, financial planners, and other professionals specializing in estate planning and related services
Table of Contents
Chapter 1. Methodology and Scope
- 1.1. Market Segmentation and Scope
- 1.2. Market Definitions
- 1.3. Research Methodology
- 1.4. Information Procurement
- 1.4.1. Purchased Database
- 1.4.2. GVR's Internal Database
- 1.5. Details of primary research
- 1.5.1. Data for primary interviews in North America
- 1.5.2. Data for primary interviews in Europe
- 1.5.3. Data for primary interviews in Asia Pacific
- 1.5.4. Data for primary interviews in Latin America
- 1.5.5. Data for Primary interviews in MEA
- 1.6. Market Formulation & Validation
- 1.7. Model Details
- 1.7.1. Commodity flow analysis (Model 1)
- 1.7.1.1. Approach 1: Commodity flow approach
- 1.7.2. Volume price analysis (Model 2)
- 1.7.2.1. Approach 2: Volume price analysis
- 1.7.1. Commodity flow analysis (Model 1)
- 1.8. Research Scope and Assumptions
- 1.8.1. List of Secondary Sources
- 1.8.2. List of Primary Sources
- 1.8.3. Objectives
Chapter 2. Executive Summary
- 2.1. Market Outlook
- 2.2. Segment Outlook
- 2.3. Competitive Insights
Chapter 3. End of Life Planning Market Variables, Trends, & Scope
- 3.1. Market Lineage Outlook
- 3.2. Market Dynamics
- 3.2.1. Market Driver Analysis
- 3.2.1.1. Rising Aging Population
- 3.2.1.2. Increasing Awareness and Education
- 3.2.1.3. Digitalization and Technology
- 3.2.2. Market Restraint Analysis
- 3.2.2.1. Cost Concerns
- 3.2.2.2. Cultural and Religious Differences
- 3.2.1. Market Driver Analysis
- 3.3. End of Life Planning Market Analysis Tools
- 3.3.1. Industry Analysis - Porter's
- 3.3.1.1. Bargaining power of the suppliers
- 3.3.1.2. Bargaining power of the buyers
- 3.3.1.3. Threats of substitution
- 3.3.1.4. Threats from new entrants
- 3.3.1.5. Competitive rivalry
- 3.3.2. PESTEL Analysis
- 3.3.2.1. Political landscape
- 3.3.2.2. Economic and Social Landscape
- 3.3.2.3. Technological landscape
- 3.3.1. Industry Analysis - Porter's
Chapter 4. End of Life Planning Market: Service Estimates & Trend Analysis
- 4.1. Segment Dashboard
- 4.2. End of Life Planning Market: Service Movement Analysis
- 4.3. Global End of Life Planning Market Size & Trend Analysis, by Service, 2018 to 2030 (USD Million)
- 4.4. Funeral Services
- 4.4.1. Funeral Services Market Revenue Estimates and Forecasts, 2018 - 2030 (USD Million)
- 4.5. Estate Planning
- 4.5.1. Estate Planning Market Revenue Estimates and Forecasts, 2018 - 2030 (USD Million)
- 4.6. Digital Legacy Services
- 4.6.1. Digital Legacy Services Market Revenue Estimates and Forecasts, 2018 - 2030 (USD Million)
- 4.7. Grief Counseling and Support
- 4.7.1. Grief Counseling and Support Market Revenue Estimates and Forecasts, 2018 - 2030 (USD Million)
- 4.8. Advanced Healthcare Directives
- 4.8.1. Advanced Healthcare Directives Market Revenue Estimates and Forecasts, 2018 - 2030 (USD Million)
- 4.9. Others
- 4.9.1. Other Market Revenue Estimates and Forecasts, 2018 - 2030 (USD Million)
Chapter 5. End of Life Planning Market: Area Estimates & Trend Analysis
- 5.1. Segment Dashboard
- 5.2. End-of-Life Planning Market: Area Movement Analysis
- 5.3. Global End of Life Planning Market Size & Trend Analysis, by Area, 2018 to 2030 (USD Million)
- 5.4. Urban
- 5.4.1. Urban Market Revenue Estimates and Forecasts, 2018 - 2030 (USD Million)
- 5.5. Rural
- 5.5.1. Rural Market Revenue Estimates and Forecasts, 2018 - 2030 (USD Million)
Chapter 6. End of Life Planning Market: Demographic Estimates & Trend Analysis
- 6.1. Segment Dashboard
- 6.2. End-of-Life Planning Market: Demographic Movement Analysis, 2022 & 2030 (USD Million)
- 6.3. Global End of Life Planning Market Size & Trend Analysis, by Demographic, 2018 to 2030 (USD Million)
- 6.4. Elderly population
- 6.4.1. Elderly Population Market Revenue Estimates and Forecasts, 2018 - 2030 (USD Million)
- 6.5. Middle age population
- 6.5.1. Middle age population Market Revenue Estimates and Forecasts, 2018 - 2030 (USD Million)
- 6.6. Young Adult
- 6.6.1. Young Adult Market Revenue Estimates and Forecasts, 2018 - 2030 (USD Million)
Chapter 7. End-of-Life Planning Market: Regional Estimates & Trend Analysis, by Services, by Area, by Demographic
- 7.1. End-of-Life Planning Market: Regional Movement Analysis, 2022 & 2030
- 7.2. North America
- 7.2.1. North America End-of-Life Planning Market Estimates and Forecasts, 2018 - 2030 (USD Million)
- 7.2.2. U.S.
- 7.2.2.1. Key Country Dynamics
- 7.2.2.2. Competitive Scenario
- 7.2.2.3. Prevalence Insights
- 7.2.2.4. Regulatory Framework
- 7.2.2.5. Reimbursement Structure
- 7.2.2.6. U.S. End-of-Life Planning Market Estimates and Forecasts, 2018 - 2030 (USD Million)
- 7.2.3. Canada
- 7.2.3.1. Key Country Dynamics
- 7.2.3.2. Competitive Scenario
- 7.2.3.3. Prevalence Insights
- 7.2.3.4. Regulatory Framework
- 7.2.3.5. Reimbursement Structure
- 7.2.3.6. Canada End-of-Life Planning Market Estimates and Forecasts, 2018 - 2030 (USD Million)
- 7.3. Europe
- 7.3.1. Europe End-of-Life Planning Market Estimates and Forecasts, 2018 - 2030 (USD Million)
- 7.3.2. UK
- 7.3.2.1. Key Country Dynamics
- 7.3.2.2. Competitive Scenario
- 7.3.2.3. Prevalence Insights
- 7.3.2.4. Regulatory Framework
- 7.3.2.5. Reimbursement Structure
- 7.3.2.6. UK End-of-Life Planning Market Estimates and Forecasts, 2018 - 2030 (USD Million)
- 7.3.3. Germany
- 7.3.3.1. Key Country Dynamics
- 7.3.3.2. Competitive Scenario
- 7.3.3.3. Prevalence Insights
- 7.3.3.4. Regulatory Framework
- 7.3.3.5. Reimbursement Structure
- 7.3.3.6. Germany End-of-Life Planning Market Estimates and Forecasts, 2018 - 2030 (USD Million)
- 7.3.4. France
- 7.3.4.1. Key Country Dynamics
- 7.3.4.2. Competitive Scenario
- 7.3.4.3. Prevalence Insights
- 7.3.4.4. Regulatory Framework
- 7.3.4.5. Reimbursement Structure
- 7.3.4.6. France End-of-Life Planning Market Estimates and Forecasts, 2018 - 2030 (USD Million)
- 7.3.5. Italy
- 7.3.5.1. Key Country Dynamics
- 7.3.5.2. Competitive Scenario
- 7.3.5.3. Prevalence Insights
- 7.3.5.4. Regulatory Framework
- 7.3.5.5. Reimbursement Structure
- 7.3.5.6. Italy End-of-Life Planning Market Estimates and Forecasts, 2018 - 2030 (USD Million)
- 7.3.6. Spain
- 7.3.6.1. Key Country Dynamics
- 7.3.6.2. Competitive Scenario
- 7.3.6.3. Prevalence Insights
- 7.3.6.4. Regulatory Framework
- 7.3.6.5. Reimbursement Structure
- 7.3.6.6. Spain End-of-Life Planning Market Estimates and Forecasts, 2018 - 2030 (USD Million)
- 7.3.7. Denmark
- 7.3.7.1. Key Country Dynamics
- 7.3.7.2. Competitive Scenario
- 7.3.7.3. Prevalence Insights
- 7.3.7.4. Regulatory Framework
- 7.3.7.5. Reimbursement Structure
- 7.3.7.6. Denmark End-of-Life Planning Market Estimates and Forecasts, 2018 - 2030 (USD Million)
- 7.3.8. Sweden
- 7.3.8.1. Key Country Dynamics
- 7.3.8.2. Competitive Scenario
- 7.3.8.3. Prevalence Insights
- 7.3.8.4. Regulatory Framework
- 7.3.8.5. Reimbursement Structure
- 7.3.8.6. Sweden End-of-Life Planning Market Estimates and Forecasts, 2018 - 2030 (USD Million)
- 7.3.9. Norway
- 7.3.9.1. Key Country Dynamics
- 7.3.9.2. Competitive Scenario
- 7.3.9.3. Prevalence Insights
- 7.3.9.4. Regulatory Framework
- 7.3.9.5. Reimbursement Structure
- 7.3.9.6. Norway End-of-Life Planning Market Estimates and Forecasts, 2018 - 2030 (USD Million)
- 7.4. Asia Pacific
- 7.4.1. Asia Pacific End-of-Life Planning Market Estimates and Forecasts, 2018 - 2030 (USD Million)
- 7.4.2. Japan
- 7.4.2.1. Key Country Dynamics
- 7.4.2.2. Competitive Scenario
- 7.4.2.3. Prevalence Insights
- 7.4.2.4. Regulatory Framework
- 7.4.2.5. Reimbursement Structure
- 7.4.2.6. Japan End-of-Life Planning Market Estimates and Forecasts, 2018 - 2030 (USD Million)
- 7.4.3. China
- 7.4.3.1. Key Country Dynamics
- 7.4.3.2. Competitive Scenario
- 7.4.3.3. Prevalence Insights
- 7.4.3.4. Regulatory Framework
- 7.4.3.5. Reimbursement Structure
- 7.4.3.6. China End-of-Life Planning Market Estimates and Forecasts, 2018 - 2030 (USD Million)
- 7.4.4. India
- 7.4.4.1. Key Country Dynamics
- 7.4.4.2. Competitive Scenario
- 7.4.4.3. Prevalence Insights
- 7.4.4.4. Regulatory Framework
- 7.4.4.5. Reimbursement Structure
- 7.4.4.6. India End-of-Life Planning Market Estimates and Forecasts, 2018 - 2030 (USD Million)
- 7.4.5. Australia
- 7.4.5.1. Key Country Dynamics
- 7.4.5.2. Competitive Scenario
- 7.4.5.3. Prevalence Insights
- 7.4.5.4. Regulatory Framework
- 7.4.5.5. Reimbursement Structure
- 7.4.5.6. Australia End-of-Life Planning Market Estimates and Forecasts, 2018 - 2030 (USD Million)
- 7.4.6. Thailand
- 7.4.6.1. Key Country Dynamics
- 7.4.6.2. Competitive Scenario
- 7.4.6.3. Prevalence Insights
- 7.4.6.4. Regulatory Framework
- 7.4.6.5. Reimbursement Structure
- 7.4.6.6. Thailand End-of-Life Planning Market Estimates and Forecasts, 2018 - 2030 (USD Million)
- 7.4.7. South Korea
- 7.4.7.1. Key Country Dynamics
- 7.4.7.2. Competitive Scenario
- 7.4.7.3. Prevalence Insights
- 7.4.7.4. Regulatory Framework
- 7.4.7.5. Reimbursement Structure
- 7.4.7.6. South Korea End-of-Life Planning Market Estimates and Forecasts, 2018 - 2030 (USD Million)
- 7.5. Latin America
- 7.5.1. Latin America End-of-Life Planning Market Estimates and Forecasts, 2018 - 2030 (USD Million)
- 7.5.2. Brazil
- 7.5.2.1. Key Country Dynamics
- 7.5.2.2. Competitive Scenario
- 7.5.2.3. Prevalence Insights
- 7.5.2.4. Regulatory Framework
- 7.5.2.5. Reimbursement Structure
- 7.5.2.6. Brazil End-of-Life Planning Market Estimates and Forecasts, 2018 - 2030 (USD Million)
- 7.5.3. Mexico
- 7.5.3.1. Key Country Dynamics
- 7.5.3.2. Competitive Scenario
- 7.5.3.3. Prevalence Insights
- 7.5.3.4. Regulatory Framework
- 7.5.3.5. Reimbursement Structure
- 7.5.3.6. Mexico End-of-Life Planning Market Estimates and Forecasts, 2018 - 2030 (USD Million)
- 7.5.4. Argentina
- 7.5.4.1. Key Country Dynamics
- 7.5.4.2. Competitive Scenario
- 7.5.4.3. Prevalence Insights
- 7.5.4.4. Regulatory Framework
- 7.5.4.5. Reimbursement Structure
- 7.5.4.6. Argentina End-of-Life Planning Market Estimates and Forecasts, 2018 - 2030 (USD Million)
- 7.6. Middle East & Africa
- 7.6.1. Middle East & Africa End-of-Life Planning Market Estimates and Forecasts, 2018 - 2030 (USD Million)
- 7.6.2. South Africa
- 7.6.2.1. Key Country Dynamics
- 7.6.2.2. Competitive Scenario
- 7.6.2.3. Prevalence Insights
- 7.6.2.4. Regulatory Framework
- 7.6.2.5. Reimbursement Structure
- 7.6.2.6. South Africa End-of-Life Planning Market Estimates and Forecasts, 2018 - 2030 (USD Million)
- 7.6.3. Saudi Arabia
- 7.6.3.1. Key Country Dynamics
- 7.6.3.2. Competitive Scenario
- 7.6.3.3. Prevalence Insights
- 7.6.3.4. Regulatory Framework
- 7.6.3.5. Reimbursement Structure
- 7.6.3.6. Saudi Arabia End-of-Life Planning Market Estimates and Forecasts, 2018 - 2030 (USD Million)
- 7.6.4. UAE
- 7.6.4.1. Key Country Dynamics
- 7.6.4.2. Competitive Scenario
- 7.6.4.3. Prevalence Insights
- 7.6.4.4. Regulatory Framework
- 7.6.4.5. Reimbursement Structure
- 7.6.4.6. UAE End-of-Life Planning Market Estimates and Forecasts, 2018 - 2030 (USD Million)
- 7.6.5. Kuwait
- 7.6.5.1. Key Country Dynamics
- 7.6.5.2. Competitive Scenario
- 7.6.5.3. Prevalence Insights
- 7.6.5.4. Regulatory Framework
- 7.6.5.5. Reimbursement Structure
- 7.6.5.6. Kuwait End-of-Life Planning Market Estimates and Forecasts, 2018 - 2030 (USD Million)
Chapter 8. Competitive Landscape
- 8.1. Company Categorization
- 8.2. Company Market Share Analysis, 2023
- 8.3. Strategy Mapping
- 8.4. Company Profiles/Listing
- 8.4.1. Everplans
- 8.4.1.1. Overview
- 8.4.1.2. Financial Performance
- 8.4.1.3. Product Benchmarking
- 8.4.1.4. Strategic Initiatives
- 8.4.2. Cake
- 8.4.2.1. Overview
- 8.4.2.2. Financial Performance
- 8.4.2.3. Product Benchmarking
- 8.4.2.4. Strategic Initiatives
- 8.4.3. TrustandWill
- 8.4.3.1. Overview
- 8.4.3.2. Financial Performance
- 8.4.3.3. Product Benchmarking
- 8.4.3.4. Strategic Initiatives
- 8.4.4. Funeralocity
- 8.4.4.1. Overview
- 8.4.4.2. Financial Performance
- 8.4.4.3. Product Benchmarking
- 8.4.4.4. Strategic Initiatives
- 8.4.5. Eterneva
- 8.4.5.1. Overview
- 8.4.5.2. Financial Performance
- 8.4.5.3. Product Benchmarking
- 8.4.5.4. Strategic Initiatives
- 8.4.6. Gathered Here Pvt Ltd.
- 8.4.6.1. Overview
- 8.4.6.2. Financial Performance
- 8.4.6.3. Product Benchmarking
- 8.4.6.4. Strategic Initiatives
- 8.4.7. Sue Mackey
- 8.4.7.1. Overview
- 8.4.7.2. Financial Performance
- 8.4.7.3. Product Benchmarking
- 8.4.7.4. Strategic Initiatives
- 8.4.8. Dignity
- 8.4.8.1. Overview
- 8.4.8.2. Financial Performance
- 8.4.8.3. Product Benchmarking
- 8.4.8.4. Strategic Initiatives
- 8.4.9. Service Corporation International (SCI)
- 8.4.9.1. Overview
- 8.4.9.2. Financial Performance
- 8.4.9.3. Product Benchmarking
- 8.4.9.4. Strategic Initiatives
- 8.4.10. Death with Dignity
- 8.4.10.1. Overview
- 8.4.10.2. Financial Performance
- 8.4.10.3. Product Benchmarking
- 8.4.10.4. Strategic Initiatives
- 8.4.1. Everplans

