|
|
市場調査レポート
商品コード
1446513
ハイパースペクトルイメージングシステムの市場規模、シェア、動向分析レポート:用途別、製品別、技術別、地域別、セグメント予測、2024~2030年Hyperspectral Imaging Systems Market Size, Share & Trends Analysis Report By Application (Military, Remote Sensing), By Product (Camera, Accessories), By Technology (Push Broom, Snapshot), By Region, And Segment Forecasts, 2024 - 2030 |
||||||

|
|||||||
カスタマイズ可能
|
|||||||

| ハイパースペクトルイメージングシステムの市場規模、シェア、動向分析レポート:用途別、製品別、技術別、地域別、セグメント予測、2024~2030年 |
|
出版日: 2024年02月13日
発行: Grand View Research
ページ情報: 英文 110 Pages
納期: 2~10営業日
|

全表示
- 概要
- 図表
- 目次
ハイパースペクトルイメージングシステム市場の成長と動向:
Grand View Research Incの新しいレポートによると、世界のハイパースペクトルイメージングシステム市場規模は、2024年から2030年までCAGR 10.7%で拡大し、2030年には286億3,000万米ドルに達すると予測されています。
予測期間中のCAGRは10.3%で拡大すると予測されています。技術、設計、機能の進歩と相まって新製品の発売が、軍事、リモートセンシング、ヘルスケア、鉱業、視覚・光学、気象など様々な分野からの需要を牽引しています。ハイパースペクトルイメージングには、スペクトルやサンプルに関する予備知識を必要としないなどの利点があります。
さらに、画像を分析・処理するための広範な情報が得られます。こうした利点が市場プレイヤの投資を促進し、予測期間中の需要を押し上げると予測されています。ハイパースペクトルイメージングは、主に眼科、消化器系処置、組織診断、蛍光顕微鏡、血管系イメージングなど、ヘルスケア分野で幅広く利用されています。アプリケーションの増加は、主にこのイメージング法の高い鮮明度と精度に起因しています。
急速な産業化と高帯域幅通信の需要は、ハイパースペクトルイメージングシステム市場の成長を今後数年で加速させる見通しです。また、既存の市場競争者は競争優位性を得るために先端技術に切り替えつつあります。新興国における研究開発と成長機会の増加、国際的な製品品質基準の維持が市場拡大の原動力になると予想されます。
手頃な価格の電子回路と高速技術は、先進的なセンサー技術の導入に連鎖しています。さらに、センサー技術の進歩は、画質、経済効率、技術製品の信頼性を向上させており、市場成長を促進すると予想されます。
ハイパースペクトルイメージングシステム市場レポートハイライト
- ハイパースペクトルカメラは、最近のセンサ開拓の進歩がカメラ分野の成長につながったことから、近い将来最大の市場シェアを占めると推定されます。
- 軍用分野は、ハイパースペクトルイメージングのデータ管理の進歩、部品製造技術、他の従来のイメージング技術に比べ優れた精度、一貫性により、最大の市場シェアを占めました。
- アジア太平洋地域は、多くの患者の存在、ヘルスケア意識の高まり、研究開発に対する政府資金の増加、今後の研究プロジェクトにより、最も急成長する地域と推定されています。
目次
第1章 調査手法と範囲
第2章 エグゼクティブサマリー
第3章 ハイパースペクトルイメージングシステム市場の変数、動向、範囲
- 市場系統の見通し
- 親市場の見通し
- 関連/付随市場の見通し
- 市場力学
- 市場促進要因分析
- 市場抑制要因分析
- ハイパースペクトルイメージングシステム市場分析ツール
- 業界分析- ポーターのファイブフォース分析
- PESTEL分析
第4章 ハイパースペクトルイメージングシステム市場:製品推定・動向分析
- モダリティ市場シェア、2023年と2030年
- セグメントダッシュボード
- 製品別の世界のハイパースペクトルイメージングシステム市場の見通し
- 市場規模、予測および動向分析、2018年から2030年まで
第5章 ハイパースペクトルイメージングシステム市場:技術推定・動向分析
- モダリティ市場シェア、2023年と2030年
- セグメントダッシュボード
- 技術展望別の世界のハイパースペクトルイメージングシステム市場
- 市場規模、予測および動向分析、2018年から2030年まで
第6章 ハイパースペクトルイメージングシステム市場:アプリケーションの推定・動向分析
- アプリケーション市場シェア、2023年と2030年
- セグメントダッシュボード
- アプリケーション別の世界のハイパースペクトルイメージングシステム市場の見通し
- 市場規模、予測および動向分析、2018年から2030年まで
第7章 ハイパースペクトルイメージングシステム市場:地域別の推定・動向分析
- 地域市場シェア分析、2023年および2030年
- 地域市場ダッシュボード
- 世界の地域市場のスナップショット
- 市場規模と予測トレンド分析、2018年から2030年:
- 北米
- 規制の枠組み/償還構造
- 米国
- カナダ
- 欧州
- 規制の枠組み/償還構造
- 英国
- ドイツ
- フランス
- イタリア
- スペイン
- ノルウェー
- スウェーデン
- デンマーク
- アジア太平洋地域
- 規制の枠組み/償還構造
- 日本
- 中国
- インド
- オーストラリア
- 韓国
- タイ
- ラテンアメリカ
- 規制の枠組み/償還構造
- ブラジル
- メキシコ
- アルゼンチン
- 中東・アフリカ
- 規制の枠組み/償還構造
- 南アフリカ
- サウジアラビア
- アラブ首長国連邦
- クウェート
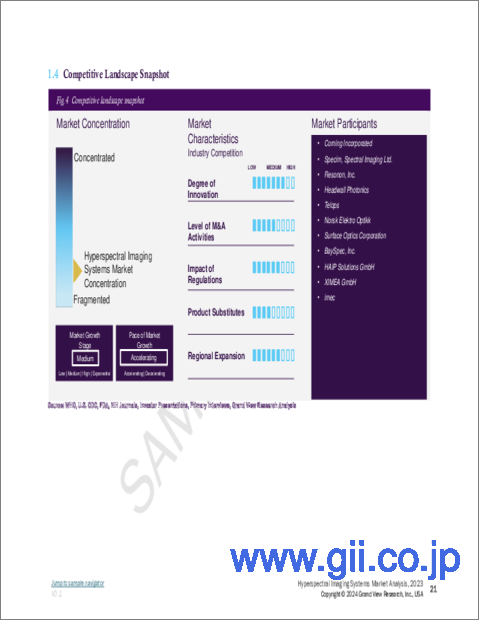
第8章 競合情勢
- 主要市場参入企業による最近の動向と影響分析
- 会社/競合の分類
- ベンダー情勢
- Key customers
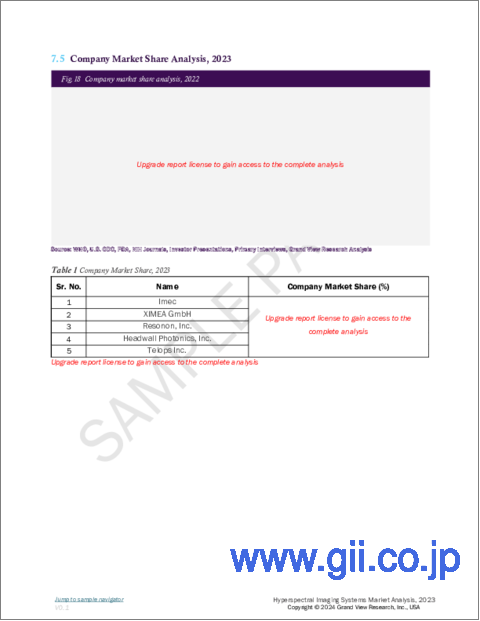
- Key company market share analysis, 2023
- Corning Incorporated
- Specim, Spectral Imaging Ltd
- Resonon Inc.
- Headwall Photonics
- Telops
- Norsk Elektro Optikk
- Surface Optics Corporation
- BaySpec, Inc.
- HAIP Solutions GmbH
- XIMEA GmbH
- imec
第9章 アナリストの視点
List of Tables
- Table 1. List of secondary sources
- Table 2. List of abbreviation
- Table 3. North America hyperspectral imaging systems market, By country, 2018 - 2030 (USD Million)
- Table 4. North America hyperspectral imaging systems market, By product, 2018 - 2030 (USD Million)
- Table 5. North America hyperspectral imaging systems market, By technology, 2018 - 2030 (USD Million)
- Table 6. North America hyperspectral imaging systems market, By application, 2018 - 2030 (USD Million)
- Table 7. U.S. hyperspectral imaging systems market, By product, 2018 - 2030 (USD Million)
- Table 8. U.S. hyperspectral imaging systems market, By technology, 2018 - 2030 (USD Million)
- Table 9. U.S. hyperspectral imaging systems market, By application, 2018 - 2030 (USD Million)
- Table 10. Canada hyperspectral imaging systems market, By product, 2018 - 2030 (USD Million)
- Table 11. Canada hyperspectral imaging systems market, By technology, 2018 - 2030 (USD Million)
- Table 12. Canada hyperspectral imaging systems market, By application, 2018 - 2030 (USD Million)
- Table 13. Europe hyperspectral imaging systems market, By country, 2018 - 2030 (USD Million)
- Table 14. Europe hyperspectral imaging systems market, By product, 2018 - 2030 (USD Million)
- Table 15. Europe hyperspectral imaging systems market, By technology, 2018 - 2030 (USD Million)
- Table 16. Europe hyperspectral imaging systems market, By application, 2018 - 2030 (USD Million)
- Table 17. UK hyperspectral imaging systems market, By product, 2018 - 2030 (USD Million)
- Table 18. UK hyperspectral imaging systems market, By technology, 2018 - 2030 (USD Million)
- Table 19. UK hyperspectral imaging systems market, By application, 2018 - 2030 (USD Million)
- Table 20. Germany hyperspectral imaging systems market, By product, 2018 - 2030 (USD Million)
- Table 21. Germany hyperspectral imaging systems market, By technology, 2018 - 2030 (USD Million)
- Table 22. Germany hyperspectral imaging systems market, By application, 2018 - 2030 (USD Million)
- Table 23. France hyperspectral imaging systems market, By product, 2018 - 2030 (USD Million)
- Table 24. France hyperspectral imaging systems market, By technology, 2018 - 2030 (USD Million)
- Table 25. France hyperspectral imaging systems market, By application, 2018 - 2030 (USD Million)
- Table 26. Italy hyperspectral imaging systems market, By product, 2018 - 2030 (USD Million)
- Table 27. Italy hyperspectral imaging systems market, By technology, 2018 - 2030 (USD Million)
- Table 28. Italy hyperspectral imaging systems market, By application, 2018 - 2030 (USD Million)
- Table 29. Denmark hyperspectral imaging systems market, By product, 2018 - 2030 (USD Million)
- Table 30. Denmark hyperspectral imaging systems market, By technology, 2018 - 2030 (USD Million)
- Table 31. Denmark hyperspectral imaging systems market, By application, 2018 - 2030 (USD Million)
- Table 32. Sweden hyperspectral imaging systems market, By product, 2018 - 2030 (USD Million)
- Table 33. Sweden hyperspectral imaging systems market, By technology, 2018 - 2030 (USD Million)
- Table 34. Sweden hyperspectral imaging systems market, By application, 2018 - 2030 (USD Million)
- Table 35. Norway hyperspectral imaging systems market, By product, 2018 - 2030 (USD Million)
- Table 36. Norway hyperspectral imaging systems market, By technology, 2018 - 2030 (USD Million)
- Table 37. Norway hyperspectral imaging systems market, By application, 2018 - 2030 (USD Million)
- Table 38. Asia Pacific hyperspectral imaging systems market, By country, 2018 - 2030 (USD Million)
- Table 39. Asia Pacific hyperspectral imaging systems market, By product, 2018 - 2030 (USD Million)
- Table 40. Asia Pacific hyperspectral imaging systems market, By technology, 2018 - 2030 (USD Million)
- Table 41. Asia Pacific hyperspectral imaging systems market, By application, 2018 - 2030 (USD Million)
- Table 42. Japan hyperspectral imaging systems market, By product, 2018 - 2030 (USD Million)
- Table 43. Japan hyperspectral imaging systems market, By technology, 2018 - 2030 (USD Million)
- Table 44. Japan hyperspectral imaging systems market, By application, 2018 - 2030 (USD Million)
- Table 45. China hyperspectral imaging systems market, By product, 2018 - 2030 (USD Million)
- Table 46. China hyperspectral imaging systems market, By technology, 2018 - 2030 (USD Million)
- Table 47. China hyperspectral imaging systems market, By application, 2018 - 2030 (USD Million)
- Table 48. India hyperspectral imaging systems market, By product, 2018 - 2030 (USD Million)
- Table 49. India hyperspectral imaging systems market, By technology, 2018 - 2030 (USD Million)
- Table 50. India hyperspectral imaging systems market, By application, 2018 - 2030 (USD Million)
- Table 51. Australia hyperspectral imaging systems market, By product, 2018 - 2030 (USD Million)
- Table 52. Australia hyperspectral imaging systems market, By technology, 2018 - 2030 (USD Million)
- Table 53. Australia hyperspectral imaging systems market, By application, 2018 - 2030 (USD Million)
- Table 54. South Korea hyperspectral imaging systems market, By product, 2018 - 2030 (USD Million)
- Table 55. South Korea hyperspectral imaging systems market, By technology, 2018 - 2030 (USD Million)
- Table 56. South Korea hyperspectral imaging systems market, By application, 2018 - 2030 (USD Million)
- Table 57. Thailand hyperspectral imaging systems market, By product, 2018 - 2030 (USD Million)
- Table 58. Thailand hyperspectral imaging systems market, By technology, 2018 - 2030 (USD Million)
- Table 59. Thailand hyperspectral imaging systems market, By application, 2018 - 2030 (USD Million)
- Table 60. Latin America hyperspectral imaging systems market, By Country, 2018 - 2030 (USD Million)
- Table 61. Latin America hyperspectral imaging systems market, By product, 2018 - 2030 (USD Million)
- Table 62. Latin America hyperspectral imaging systems market, By technology, 2018 - 2030 (USD Million)
- Table 63. Latin America hyperspectral imaging systems market, By application, 2018 - 2030 (USD Million)
- Table 64. Brazil hyperspectral imaging systems market, By product, 2018 - 2030 (USD Million)
- Table 65. Brazil hyperspectral imaging systems market, By technology, 2018 - 2030 (USD Million)
- Table 66. Brazil hyperspectral imaging systems market, By application, 2018 - 2030 (USD Million)
- Table 67. Mexico hyperspectral imaging systems market, By product, 2018 - 2030 (USD Million)
- Table 68. Mexico hyperspectral imaging systems market, By technology, 2018 - 2030 (USD Million)
- Table 69. Mexico hyperspectral imaging systems market, By application, 2018 - 2030 (USD Million)
- Table 70. Argentina hyperspectral imaging systems market, By product, 2018 - 2030 (USD Million)
- Table 71. Argentina hyperspectral imaging systems market, By technology, 2018 - 2030 (USD Million)
- Table 72. Argentina hyperspectral imaging systems market, By application, 2018 - 2030 (USD Million)
- Table 73. Middle East & Africa hyperspectral imaging systems market, By country, 2018 - 2030 (USD Million)
- Table 74. Middle East & Africa hyperspectral imaging systems market, By product, 2018 - 2030 (USD Million)
- Table 75. Middle East & Africa hyperspectral imaging systems market, By technology, 2018 - 2030 (USD Million)
- Table 76. Middle East & Africa hyperspectral imaging systems market, By application, 2018 - 2030 (USD Million)
- Table 77. South Africa hyperspectral imaging systems market, By product, 2018 - 2030 (USD Million)
- Table 78. South Africa hyperspectral imaging systems market, By technology, 2018 - 2030 (USD Million)
- Table 79. South Africa hyperspectral imaging systems market, By application, 2018 - 2030 (USD Million)
- Table 80. Saudi Arabia hyperspectral imaging systems market, By product, 2018 - 2030 (USD Million)
- Table 81. Saudi Arabia hyperspectral imaging systems market, By technology, 2018 - 2030 (USD Million)
- Table 82. Saudi Arabia hyperspectral imaging systems market, By application, 2018 - 2030 (USD Million)
- Table 83. UAE hyperspectral imaging systems market, By product, 2018 - 2030 (USD Million)
- Table 84. UAE hyperspectral imaging systems market, By technology, 2018 - 2030 (USD Million)
- Table 85. UAE hyperspectral imaging systems market, By application, 2018 - 2030 (USD Million)
- Table 86. Kuwait hyperspectral imaging systems market, By product, 2018 - 2030 (USD Million)
- Table 87. Kuwait hyperspectral imaging systems market, By technology, 2018 - 2030 (USD Million)
- Table 88. Kuwait hyperspectral imaging systems market, By application, 2018 - 2030 (USD Million)
List of Figures
- Fig. 1 Market research process
- Fig. 2 Data triangulation techniques
- Fig. 3 Primary research pattern
- Fig. 4 Primary interviews in North America
- Fig. 5 Primary interviews in Europe
- Fig. 6 Primary interviews in APAC
- Fig. 7 Primary interviews in Latin America
- Fig. 8 Primary interviews in MEA
- Fig. 9 Market research approaches
- Fig. 10 Value-chain-based sizing & forecasting
- Fig. 11 QFD modeling for market share assessment
- Fig. 12 Market formulation & validation
- Fig. 13 Hyperspectral imaging systems market: market outlook
- Fig. 14 Parent market outlook
- Fig. 15 Related/ancillary market outlook
- Fig. 16 Penetration and growth prospect mapping
- Fig. 17 Industry value chain analysis
- Fig. 18 Hyperspectral imaging systems market driver impact
- Fig. 19 Hyperspectral imaging systems market restraint impact
- Fig. 20 Hyperspectral imaging systems market: Product movement analysis
- Fig. 21 Hyperspectral imaging systems market: Product outlook and key takeaways
- Fig. 22 Camera market estimates and forecast, 2018 - 2030
- Fig. 23 Accessories market estimates and forecast, 2018 - 2030
- Fig. 24 Hyperspectral imaging systems market: Technology movement analysis
- Fig. 25 Hyperspectral imaging systems market: Technology outlook and key takeaways
- Fig. 26 Snapshot market estimates and forecast, 2018 - 2030
- Fig. 27 Push broom market estimates and forecast, 2018 - 2030
- Fig. 28 Others market estimates and forecast, 2018 - 2030
- Fig. 29 Hyperspectral imaging systems Market: Application movement analysis
- Fig. 30 Hyperspectral imaging systems market: Application outlook and key takeaways
- Fig. 31 Military surveillance market estimates and forecast, 2018 - 2030
- Fig. 32 Remote sensing market estimates and forecast, 2018 - 2030
- Fig. 33 Medical diagnostics market estimates and forecast, 2018 - 2030
- Fig. 34 Machine vision & optical sorting market estimates and forecast, 2018 - 2030
- Fig. 35 Others market estimates and forecast, 2018 - 2030
- Fig. 36 Global hyperspectral imaging systems market: Regional movement analysis
- Fig. 37 Global hyperspectral imaging systems market: Regional outlook and key takeaways
- Fig. 38 North America, by country
- Fig. 39 North America
- Fig. 40 North America market estimates and forecasts, 2018 - 2030
- Fig. 41 U.S.
- Fig. 42 U.S. market estimates and forecasts, 2018 - 2030
- Fig. 43 Canada
- Fig. 44 Canada market estimates and forecasts, 2018 - 2030
- Fig. 45 Europe
- Fig. 46 Europe market estimates and forecasts, 2018 - 2030
- Fig. 47 UK
- Fig. 48 UK market estimates and forecasts, 2018 - 2030
- Fig. 49 Germany
- Fig. 50 Germany market estimates and forecasts, 2018 - 2030
- Fig. 51 France
- Fig. 52 France market estimates and forecasts, 2018 - 2030
- Fig. 53 Italy
- Fig. 54 Italy market estimates and forecasts, 2018 - 2030
- Fig. 55 Spain
- Fig. 56 Spain market estimates and forecasts, 2018 - 2030
- Fig. 57 Denmark
- Fig. 58 Denmark market estimates and forecasts, 2018 - 2030
- Fig. 59 Sweden
- Fig. 60 Sweden market estimates and forecasts, 2018 - 2030
- Fig. 61 Norway
- Fig. 62 Norway market estimates and forecasts, 2018 - 2030
- Fig. 63 Asia Pacific
- Fig. 64 Asia Pacific market estimates and forecasts, 2018 - 2030
- Fig. 65 China
- Fig. 66 China market estimates and forecasts, 2018 - 2030
- Fig. 67 Japan
- Fig. 68 Japan market estimates and forecasts, 2018 - 2030
- Fig. 69 India
- Fig. 70 India market estimates and forecasts, 2018 - 2030
- Fig. 71 Thailand
- Fig. 72 Thailand market estimates and forecasts, 2018 - 2030
- Fig. 73 South Korea
- Fig. 74 South Korea market estimates and forecasts, 2018 - 2030
- Fig. 75 Australia
- Fig. 76 Australia market estimates and forecasts, 2018 - 2030
- Fig. 77 Latin America
- Fig. 78 Latin America market estimates and forecasts, 2018 - 2030
- Fig. 79 Brazil
- Fig. 80 Brazil market estimates and forecasts, 2018 - 2030
- Fig. 81 Mexico
- Fig. 82 Mexico market estimates and forecasts, 2018 - 2030
- Fig. 83 Argentina
- Fig. 84 Argentina market estimates and forecasts, 2018 - 2030
- Fig. 85 Middle East and Africa
- Fig. 86 Middle East and Africa market estimates and forecasts, 2018 - 2030
- Fig. 87 South Africa
- Fig. 88 South Africa market estimates and forecasts, 2018 - 2030
- Fig. 89 Saudi Arabia
- Fig. 90 Saudi Arabia market estimates and forecasts, 2018 - 2030
- Fig. 91 UAE
- Fig. 92 UAE market estimates and forecasts, 2018 - 2030
- Fig. 93 Kuwait
- Fig. 94 Kuwait market estimates and forecasts, 2018 - 2030
- Fig. 95 Market share of key market players- Hyperspectral imaging systems market
Hyperspectral Imaging Systems Market Growth & Trends:
The global hyperspectral imaging systems market size is expected to reach USD 28.63 billion by 2030, expanding at a CAGR of 10.7% from 2024 to 2030, according to a new report by Grand View Research Inc. It is anticipated to expand at a CAGR of 10.3% during the forecast period. New product launches coupled with advancements in technology, designs, and features are driving the demand from various fields, such as military, remote sensing, healthcare, mining, vision and optical, and meteorology. There are certain advantages of hyperspectral imaging, such as the non-requirement of prior knowledge of the spectrum and sample.
In addition, it provides extensive information for analyzing and processing the image. These advantages are anticipated to drive investments from market players, which is anticipated to drive the demand during the forecast period. Hyperspectral imaging is being used extensively in the healthcare sector, mainly for ophthalmology, gastrointestinal procedures, tissue diagnosis, fluorescence microscopy, and vascular system imaging. The increasing application can be attributed mainly to the high clarity and accuracy of this imaging method.
Rapid industrialization along with demand for high bandwidth communication is poised to fuel the growth of the hyperspectral imaging systems market in the forthcoming years. In addition, existing market players are switching to advanced technologies to gain competitive advantages. A rise in R&D and growth opportunities in emerging countries and the aim to maintain international product quality standards are anticipated to drive market expansion.
Affordable electronic circuits and high-speed technologies have cascaded into the introduction of advanced sensor technologies. Furthermore, advancements in sensor technologies have improved the image quality, economic efficiency, and reliability of the technical products and thus, are anticipated to fuel the market growth.
Hyperspectral Imaging Systems Market Report Highlights:
- Hyperspectral camera is estimated to hold the largest market share in the near future due to the recent advancements in sensor development, which have led to the growth of the camera segment
- The military segment accounted for the largest market share due to advancements in data management of hyperspectral imaging along with component fabrication techniques, better accuracy, and consistency compared to other conventional imaging techniques
- Asia Pacific has been estimated to be the fastest growing region due to the presence of a large pool of patients, increasing healthcare awareness, rising government funding for R&D, and upcoming research projects
Table of Contents
Chapter 1. Methodology and Scope
- 1.1. Market Segmentation & Scope
- 1.2. Segment Definitions
- 1.2.1. Product
- 1.2.2. Technology
- 1.2.3. Application
- 1.2.4. Regional scope
- 1.2.5. Estimates and forecasts timeline
- 1.3. Research Methodology
- 1.4. Information Procurement
- 1.4.1. Purchased database
- 1.4.2. GVR's internal database
- 1.4.3. Secondary sources
- 1.4.4. Primary research
- 1.4.5. Details of primary research
- 1.4.5.1. Data for primary interviews in North America
- 1.4.5.2. Data for primary interviews in Europe
- 1.4.5.3. Data for primary interviews in Asia Pacific
- 1.4.5.4. Data for primary interviews in Latin America
- 1.4.5.5. Data for Primary interviews in MEA
- 1.5. Information or Data Analysis
- 1.5.1. Data analysis models
- 1.6. Market Formulation & Validation
- 1.7. Model Details
- 1.7.1. Commodity flow analysis (Model 1)
- 1.7.2. Approach 1: Commodity flow approach
- 1.7.3. Volume price analysis (Model 2)
- 1.7.4. Approach 2: Volume price analysis
- 1.8. List of Secondary Sources
- 1.9. List of Primary Sources
- 1.10. Objectives
Chapter 2. Executive Summary
- 2.1. Market Outlook
- 2.2. Segment Outlook
- 2.2.1. Product outlook
- 2.2.2. Technology outlook
- 2.2.3. Application outlook
- 2.2.4. Regional outlook
- 2.3. Competitive Insights
Chapter 3. Hyperspectral Imaging Systems Market Variables, Trends & Scope
- 3.1. Market Lineage Outlook
- 3.1.1. Parent market outlook
- 3.1.2. Related/ancillary market outlook
- 3.2. Market Dynamics
- 3.2.1. Market driver analysis
- 3.2.1.1. Technological advancements and wide applications in various industries
- 3.2.1.2. Rising demand for remote sensing
- 3.2.1.3. Rising need for data accuracy and consistency
- 3.2.2. Market restraint analysis
- 3.2.2.1. High cost of equipment
- 3.2.2.2. Lack of standardization and interoperability
- 3.2.1. Market driver analysis
- 3.3. Hyperspectral Imaging Systems Market Analysis Tools
- 3.3.1. Industry Analysis - Porter's
- 3.3.1.1. Supplier power
- 3.3.1.2. Buyer power
- 3.3.1.3. Substitution threat
- 3.3.1.4. Threat of new entrant
- 3.3.1.5. Competitive rivalry
- 3.3.2. PESTEL Analysis
- 3.3.2.1. Political landscape
- 3.3.2.2. Technological landscape
- 3.3.2.3. Economic landscape
- 3.3.1. Industry Analysis - Porter's
Chapter 4. Hyperspectral Imaging Systems Market: Product Estimates & Trend Analysis
- 4.1. Modality Market Share, 2023 & 2030
- 4.2. Segment Dashboard
- 4.3. Global Hyperspectral Imaging Systems Market by Product Outlook
- 4.4. Market Size & Forecasts and Trend Analyses, 2018 to 2030 for the following
- 4.4.1. Camera
- 4.4.1.1. Camera market estimates and forecasts 2018 to 2030 (USD Million)
- 4.4.2. Accessories
- 4.4.2.1. Accessories ultrasound market estimates and forecasts 2018 to 2030 (USD Million)
- 4.4.1. Camera
Chapter 5. Hyperspectral Imaging Systems Market: Technology Estimates & Trend Analysis
- 5.1. Modality Market Share, 2023 & 2030
- 5.2. Segment Dashboard
- 5.3. Global Hyperspectral Imaging Systems Market by Technology Outlook
- 5.4. Market Size & Forecasts and Trend Analyses, 2018 to 2030 for the following
- 5.4.1. Snapshot
- 5.4.1.1. Snapshot market estimates and forecasts 2018 to 2030 (USD Million)
- 5.4.2. Push Broom
- 5.4.2.1. Push Broom market estimates and forecasts 2018 to 2030 (USD Million)
- 5.4.3. Others
- 5.4.3.1. Others market estimates and forecasts 2018 to 2030 (USD Million)
- 5.4.1. Snapshot
Chapter 6. Hyperspectral Imaging Systems Market: Application Estimates & Trend Analysis
- 6.1. Application Market Share, 2023 & 2030
- 6.2. Segment Dashboard
- 6.3. Global Hyperspectral Imaging Systems Market by Application Outlook
- 6.4. Market Size & Forecasts and Trend Analyses, 2018 to 2030 for the following
- 6.4.1. Military Surveillance
- 6.4.1.1. Military surveillance market estimates and forecasts 2018 to 2030 (USD Million)
- 6.4.2. Remote Sensing
- 6.4.2.1. Remote sensing market estimates and forecasts 2018 to 2030 (USD Million)
- 6.4.3. Medical Diagnostics
- 6.4.3.1. Medical diagnostics market estimates and forecasts 2018 to 2030 (USD Million)
- 6.4.4. Machine Vision & Optical Sorting
- 6.4.4.1. Machine vision & optical sorting market estimates and forecasts 2018 to 2030 (USD Million)
- 6.4.5. Others
- 6.4.5.1. Others market estimates and forecasts 2018 to 2030 (USD Million)
- 6.4.1. Military Surveillance
Chapter 7. Hyperspectral Imaging Systems Market: Regional Estimates & Trend Analysis
- 7.1. Regional Market Share Analysis, 2023 & 2030
- 7.2. Regional Market Dashboard
- 7.3. Global Regional Market Snapshot
- 7.4. Market Size, & Forecasts Trend Analysis, 2018 to 2030:
- 7.5. North America
- 7.5.1. Regulatory framework/ reimbursement structure
- 7.5.2. U.S.
- 7.5.2.1. Key country dynamics
- 7.5.2.2. Competitive scenario
- 7.5.2.3. U.S. market estimates and forecasts 2018 to 2030 (USD Million)
- 7.5.3. Canada
- 7.5.3.1. Key country dynamics
- 7.5.3.2. Competitive scenario
- 7.5.3.3. Canada market estimates and forecasts 2018 to 2030 (USD Million)
- 7.6. Europe
- 7.6.1. Regulatory framework/ reimbursement structure
- 7.6.2. UK
- 7.6.2.1. Key country dynamics
- 7.6.2.2. Competitive scenario
- 7.6.2.3. UK market estimates and forecasts 2018 to 2030 (USD Million)
- 7.6.3. Germany
- 7.6.3.1. Key country dynamics
- 7.6.3.2. Competitive scenario
- 7.6.3.3. Germany market estimates and forecasts 2018 to 2030 (USD Million)
- 7.6.4. France
- 7.6.4.1. Key country dynamics
- 7.6.4.2. Competitive scenario
- 7.6.4.3. France market estimates and forecasts 2018 to 2030 (USD Million)
- 7.6.5. Italy
- 7.6.5.1. Key country dynamics
- 7.6.5.2. Competitive scenario
- 7.6.5.3. Italy market estimates and forecasts 2018 to 2030 (USD Million)
- 7.6.6. Spain
- 7.6.6.1. Key country dynamics
- 7.6.6.2. Competitive scenario
- 7.6.6.3. Spain market estimates and forecasts 2018 to 2030 (USD Million)
- 7.6.7. Norway
- 7.6.7.1. Key country dynamics
- 7.6.7.2. Competitive scenario
- 7.6.7.3. Norway market estimates and forecasts 2018 to 2030 (USD Million)
- 7.6.8. Sweden
- 7.6.8.1. Key country dynamics
- 7.6.8.2. Competitive scenario
- 7.6.8.3. Sweden market estimates and forecasts 2018 to 2030 (USD Million)
- 7.6.9. Denmark
- 7.6.9.1. Key country dynamics
- 7.6.9.2. Competitive scenario
- 7.6.9.3. Denmark market estimates and forecasts 2018 to 2030 (USD Million)
- 7.7. Asia Pacific
- 7.7.1. Regulatory framework/ reimbursement structure
- 7.7.2. Japan
- 7.7.2.1. Key country dynamics
- 7.7.2.2. Competitive scenario
- 7.7.2.3. Japan market estimates and forecasts 2018 to 2030 (USD Million)
- 7.7.3. China
- 7.7.3.1. Key country dynamics
- 7.7.3.2. Competitive scenario
- 7.7.3.3. China market estimates and forecasts 2018 to 2030 (USD Million)
- 7.7.4. India
- 7.7.4.1. Key country dynamics
- 7.7.4.2. Competitive scenario
- 7.7.4.3. India market estimates and forecasts 2018 to 2030 (USD Million)
- 7.7.5. Australia
- 7.7.5.1. Key country dynamics
- 7.7.5.2. Competitive scenario
- 7.7.5.3. Australia market estimates and forecasts 2018 to 2030 (USD Million)
- 7.7.6. South Korea
- 7.7.6.1. Key country dynamics
- 7.7.6.2. Competitive scenario
- 7.7.6.3. South Korea market estimates and forecasts 2018 to 2030 (USD Million)
- 7.7.7. Thailand
- 7.7.7.1. Key country dynamics
- 7.7.7.2. Competitive scenario
- 7.7.7.3. Thailand market estimates and forecasts 2018 to 2030 (USD Million)
- 7.8. Latin America
- 7.8.1. Regulatory framework/ reimbursement structure
- 7.8.2. Brazil
- 7.8.2.1. Key country dynamics
- 7.8.2.2. Competitive scenario
- 7.8.2.3. Brazil market estimates and forecasts 2018 to 2030 (USD Million)
- 7.8.3. Mexico
- 7.8.3.1. Key country dynamics
- 7.8.3.2. Competitive scenario
- 7.8.3.3. Mexico market estimates and forecasts 2018 to 2030 (USD Million)
- 7.8.4. Argentina
- 7.8.4.1. Key country dynamics
- 7.8.4.2. Competitive scenario
- 7.8.4.3. Argentina market estimates and forecasts 2018 to 2030 (USD Million)
- 7.9. MEA
- 7.9.1. Regulatory framework/ reimbursement structure
- 7.9.2. South Africa
- 7.9.2.1. Key country dynamics
- 7.9.2.2. Competitive scenario
- 7.9.2.3. South Africa market estimates and forecasts 2018 to 2030 (USD Million)
- 7.9.3. Saudi Arabia
- 7.9.3.1. Key country dynamics
- 7.9.3.2. Competitive scenario
- 7.9.3.3. Saudi Arabia market estimates and forecasts 2018 to 2030 (USD Million)
- 7.9.4. UAE
- 7.9.4.1. Key country dynamics
- 7.9.4.2. Competitive scenario
- 7.9.4.3. UAE market estimates and forecasts 2018 to 2030 (USD Million)
- 7.9.5. Kuwait
- 7.9.5.1. Key country dynamics
- 7.9.5.2. Competitive scenario
- 7.9.5.3. Kuwait market estimates and forecasts 2018 to 2030 (USD Million)
Chapter 8. Competitive Landscape
- 8.1. Recent Developments & Impact Analysis, By Key Market Participants
- 8.2. Company/Competition Categorization
- 8.3. Vendor Landscape
- 8.3.1. Key customers
- 8.3.2. Key company market share analysis, 2023
- 8.3.3. Corning Incorporated
- 8.3.3.1. Company overview
- 8.3.3.2. Financial performance
- 8.3.3.3. Product benchmarking
- 8.3.3.4. Strategic initiatives
- 8.3.4. Specim, Spectral Imaging Ltd
- 8.3.4.1. Company overview
- 8.3.4.2. Financial performance
- 8.3.4.3. Product benchmarking
- 8.3.4.4. Strategic initiatives
- 8.3.5. Resonon Inc.
- 8.3.5.1. Company overview
- 8.3.5.2. Financial performance
- 8.3.5.3. Product benchmarking
- 8.3.5.4. Strategic initiatives
- 8.3.6. Headwall Photonics
- 8.3.6.1. Company overview
- 8.3.6.2. Financial performance
- 8.3.6.3. Product benchmarking
- 8.3.6.4. Strategic initiatives
- 8.3.7. Telops
- 8.3.7.1. Company overview
- 8.3.7.2. Financial performance
- 8.3.7.3. Product benchmarking
- 8.3.7.4. Strategic initiatives
- 8.3.8. Norsk Elektro Optikk
- 8.3.8.1. Company overview
- 8.3.8.2. Financial performance
- 8.3.8.3. Product benchmarking
- 8.3.8.4. Strategic initiatives
- 8.3.9. Surface Optics Corporation
- 8.3.9.1. Company overview
- 8.3.9.2. Financial performance
- 8.3.9.3. Product benchmarking
- 8.3.9.4. Strategic initiatives
- 8.3.10. BaySpec, Inc.
- 8.3.10.1. Company overview
- 8.3.10.2. Financial performance
- 8.3.10.3. Product benchmarking
- 8.3.10.4. Strategic initiatives
- 8.3.11. HAIP Solutions GmbH
- 8.3.11.1. Company overview
- 8.3.11.2. Financial performance
- 8.3.11.3. Product benchmarking
- 8.3.11.4. Strategic initiatives
- 8.3.12. XIMEA GmbH
- 8.3.12.1. Company overview
- 8.3.12.2. Financial performance
- 8.3.12.3. Product benchmarking
- 8.3.12.4. Strategic initiatives
- 8.3.13. imec
- 8.3.13.1. Company overview
- 8.3.13.2. Financial performance
- 8.3.13.3. Product benchmarking
- 8.3.13.4. Strategic initiatives

