
|
市場調査レポート
商品コード
1667189
ハイパースペクトル画像システム市場の機会、成長促進要因、産業動向分析、2025年~2034年の予測Hyperspectral Imaging Systems Market Opportunity, Growth Drivers, Industry Trend Analysis, and Forecast 2025 - 2034 |
||||||
カスタマイズ可能
|
|||||||
| ハイパースペクトル画像システム市場の機会、成長促進要因、産業動向分析、2025年~2034年の予測 |
|
出版日: 2024年12月30日
発行: Global Market Insights Inc.
ページ情報: 英文 180 Pages
納期: 2~3営業日
|

全表示
- 概要
- 目次
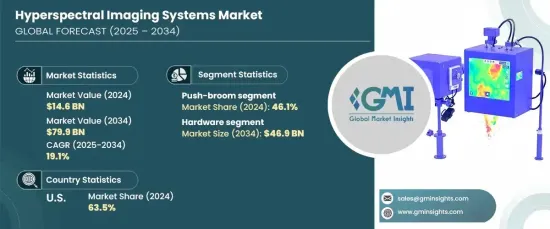
世界のハイパースペクトル画像システム市場は、2024年に146億米ドルと評価され、2025年から2034年にかけてCAGR 19.1%で拡大すると予測されています。
市場成長の原動力となっているのは、センサーの小型化、スペクトル分解能の向上、コスト効率の高いソリューションなど、ハイパースペクトルイメージング技術の継続的な進歩です。これらの技術革新により、ドローンや無人航空機(UAV)、携帯機器に組み込むことができる小型ハイパースペクトルカメラや軽量センサが開発され、この技術がより身近なものとなっています。ハイパースペクトル画像は、リモートセンシングや現地調査への利用が増加しており、地質学、林業、災害管理などの分野でその存在感を拡大しています。さらに、スナップショット・ハイパースペクトルカメラやプッシュブルーム・スキャナーのような高度なスキャン技術の採用により、操作が簡素化され、小規模な産業でもシステムを使いやすくなっています。こうした技術的躍進により、ハイパースペクトルイメージングはさまざまな分野で新たな扉を開いています。
ハイパースペクトル画像システムの需要は、飲食品など精密な品質管理を必要とする産業で特に高いです。これらのシステムは、汚染物質の検出、食品の安全性の確保、製品の品質監視に不可欠なツールになりつつあります。ハイパースペクトル画像は、食品中の異物、腐敗、不一致を効果的に識別することができ、食品安全規制の厳格化と高品質製品に対する消費者の需要の高まりを支えています。
| 市場範囲 | |
|---|---|
| 開始年 | 2024 |
| 予測年 | 2025-2034 |
| 開始金額 | 146億米ドル |
| 予測金額 | 799億米ドル |
| CAGR | 19.1% |
市場は技術別にプッシュブルーム型、スナップショット型、ウィスクブルーム型ハイパースペクトルイメージングに分類できます。プッシュブルームハイパースペクトルイメージング分野は、2024年に市場の46.1%を占めて最大となりました。プッシュブルーム技術は、空間分解能とスペクトル分解能が高く、特に農業、環境モニタリング、防衛監視などのアプリケーションで詳細なスペクトルデータの取り込みを可能にするため、広く支持されています。しかし、この技術は優れた性能を発揮する反面、スキャン時の精密なモーションコントロールとアライメントが必要なため、展開が複雑でコストがかかります。
ハイパースペクトル画像システム市場はまた、ハードウェアとソフトウェアコンポーネントに分けられます。ハードウェア・セグメントは2034年までに469億米ドルを創出すると予想されています。このセグメントには、ハイパースペクトルセンサ、カメラ、光源、データ収集システムなどの主要コンポーネントが含まれます。センサ技術と小型化の進歩に伴い、コンパクトでポータブルなハイパースペクトルイメージングソリューションの需要が急増しています。こうした改善により、ハイパースペクトル画像システムをドローン、UAV、ハンドヘルド形式で展開することが可能になり、農業、防衛、ヘルスケアなどの分野での利用が拡大しています。
2024年には、米国が北米市場で63.5%と圧倒的なシェアを占め、防衛、航空宇宙、ヘルスケアへの多額の投資がその原動力となっています。米国国防省は、軍事監視、標的検出、国境警備にハイパースペクトルイメージングを利用しています。さらに、ヘルスケア産業は、非侵襲的診断、疾病検出、手術ガイダンスにこれらのシステムの恩恵を受けています。米国市場の成長は、精密農業と食品安全におけるハイパースペクトルイメージングの採用の増加、研究機関の強力な存在と政府のイニシアチブによっても支えられています。
目次
第1章 調査手法と調査範囲
- 市場範囲と定義
- 基本推定と計算
- 予測計算
- データソース
- 1次データ
- 2次データ
- 有料情報源
- 公的情報源
第2章 エグゼクティブサマリー
第3章 業界洞察
- エコシステム分析
- バリューチェーンに影響を与える要因
- 利益率分析
- 破壊
- 将来の展望
- メーカー
- 流通業者
- サプライヤーの状況
- 利益率分析
- 主要ニュースと取り組み
- 規制状況
- 影響要因
- 促進要因
- センサーの技術的進歩と小型化
- 飲食品の品質管理における需要の増加
- 農業や環境モニタリングでの採用
- 防衛および監視アプリケーションにおける需要の増加
- 業界の潜在的リスク&課題
- 高い導入コストと複雑性
- 標準化されたデータ処理と熟練労働力の不足
- 促進要因
- 成長可能性分析
- ポーターの分析
- PESTEL分析
第4章 競合情勢
- イントロダクション
- 企業シェア分析
- 競合のポジショニング・マトリックス
- 戦略展望マトリックス
第5章 市場推計・予測:コンポーネント別、2021年~2034年
- 主要動向
- ハードウェア
- カメラ
- センサー
- レンズ
- 検出器
- ソフトウェア
- 画像処理ソフトウェア
- データ解析ソフトウェア
- 可視化ソフトウェア
- キャリブレーション・ソフトウェア
- スペクトル解析ソフトウェア
- 機械学習・AIソフトウェア
第6章 市場推計・予測:技術別、2021年~2034年
- 主要動向
- プッシュブルーム型ハイパースペクトルイメージング
- スナップショット・ハイパースペクトルイメージング
- ウィスクブルームハイパースペクトルイメージング
- その他
第7章 市場推計・予測:スペクトル範囲別、2021年~2034年
- 主要動向
- 可視/近赤外(VNIR)
- 短波長赤外線(SWIR)
- 長波長赤外線(LWIR)
第8章 市場推計・予測:用途別、2021年~2034年
- 主要動向
- 農業
- 医療診断
- 環境モニタリング
- 食品・飲料
- 工業検査
- その他
第9章 市場推計・予測:地域別、2021-2034年
- 主要動向
- 北米
- 米国
- カナダ
- 欧州
- 英国
- ドイツ
- フランス
- イタリア
- スペイン
- ロシア
- アジア太平洋
- 中国
- インド
- 日本
- 韓国
- オーストラリア
- ラテンアメリカ
- ブラジル
- メキシコ
- 中東・アフリカ
- 南アフリカ
- サウジアラビア
- アラブ首長国連邦
第10章 企業プロファイル
- Applied Spectral Imaging
- BaySpec, Inc.
- ClydeHSI
- Corning Incorporated
- Cubert GmbH
- Diaspective Vision
- Gamaya
- Headwall Photonics, Inc.
- Hinalea Imaging Corp.
- HyperMed Imaging, Inc.
- imec
- Malvern Panalytical Ltd
- Norsk Elektro Optikk AS
- Orbital Sidekick
- Photon Etc
- Resonon
- Specim, Spectral Imaging Ltd.
- Surface Optics Corporation
- Telops Inc.
- XIMEA GmbH
The Global Hyperspectral Imaging Systems Market was valued at USD 14.6 billion in 2024 and is expected to expand at a CAGR of 19.1% from 2025 to 2034. The market growth is driven by continuous advancements in hyperspectral imaging technology, such as sensor miniaturization, enhanced spectral resolution, and cost-effective solutions. These innovations have led to the development of compact hyperspectral cameras and lightweight sensors that can be integrated into drones, unmanned aerial vehicles (UAVs), and portable devices, making the technology more accessible. Hyperspectral imaging is increasingly used for remote sensing and field surveys, expanding its presence in sectors like geology, forestry, and disaster management. Additionally, the adoption of advanced scanning technologies like snapshot hyperspectral cameras and push-broom scanners has simplified operations and made the systems easier to use for smaller industries. These technological breakthroughs are opening new doors for hyperspectral imaging in various fields.
The demand for hyperspectral imaging systems is particularly high in industries that require precise quality control, such as food and beverages. These systems are becoming vital tools for detecting contaminants, ensuring food safety, and monitoring product quality. Hyperspectral imaging can effectively identify foreign materials, spoilage, and inconsistencies in food items, supporting stricter food safety regulations and the growing consumer demand for high-quality products.
| Market Scope | |
|---|---|
| Start Year | 2024 |
| Forecast Year | 2025-2034 |
| Start Value | $14.6 billion |
| Forecast Value | $79.9 billion |
| CAGR | 19.1% |
The market can be categorized by technology into push-broom, snapshot, and whiskbroom hyperspectral imaging. The push-broom hyperspectral imaging segment was the largest in 2024, accounting for 46.1% of the market. Push-broom technology is widely favored due to its high spatial and spectral resolution, allowing for detailed spectral data capture, especially in applications like agriculture, environmental monitoring, and defense surveillance. However, while this technology provides excellent performance, its need for precise motion control and alignment during scanning makes deployment more complex and costly.
The hyperspectral imaging systems market is also divided into hardware and software components. The hardware segment is expected to generate USD 46.9 billion by 2034. This segment includes key components such as hyperspectral sensors, cameras, light sources, and data acquisition systems. With advancements in sensor technology and miniaturization, the demand for compact and portable hyperspectral imaging solutions has surged. These improvements make it possible to deploy hyperspectral imaging systems in drone, UAV, and handheld formats, expanding their use in fields like agriculture, defense, and healthcare.
In 2024, the U.S. held the dominant share of the North American market at 63.5%, driven by substantial investments in defense, aerospace, and healthcare. The U.S. Department of Defense utilizes hyperspectral imaging for military surveillance, target detection, and border security. Additionally, the healthcare industry benefits from these systems for non-invasive diagnostics, disease detection, and surgical guidance. The U.S. market's growth is also supported by the increasing adoption of hyperspectral imaging in precision agriculture and food safety, along with a strong presence of research institutions and government initiatives.
Table of Contents
Chapter 1 Methodology & Scope
- 1.1 Market scope & definitions
- 1.2 Base estimates & calculations
- 1.3 Forecast calculations
- 1.4 Data sources
- 1.4.1 Primary
- 1.4.2 Secondary
- 1.4.2.1 Paid sources
- 1.4.2.2 Public sources
Chapter 2 Executive Summary
- 2.1 Industry synopsis, 2021-2034
Chapter 3 Industry Insights
- 3.1 Industry ecosystem analysis
- 3.1.1 Factor affecting the value chain
- 3.1.2 Profit margin analysis
- 3.1.3 Disruptions
- 3.1.4 Future outlook
- 3.1.5 Manufacturers
- 3.1.6 Distributors
- 3.2 Supplier landscape
- 3.3 Profit margin analysis
- 3.4 Key news & initiatives
- 3.5 Regulatory landscape
- 3.6 Impact forces
- 3.6.1 Growth drivers
- 3.6.1.1 Technological advancements in sensors and miniaturization
- 3.6.1.2 Increased demand in food and beverage quality control
- 3.6.1.3 Adoption in agriculture and environmental monitoring
- 3.6.1.4 Rising demand in defense and surveillance applications
- 3.6.2 Industry pitfalls & challenges
- 3.6.2.1 High implementation costs and complexity
- 3.6.2.2 Lack of standardized data processing and skilled workforce
- 3.6.1 Growth drivers
- 3.7 Growth potential analysis
- 3.8 Porter’s analysis
- 3.9 PESTEL analysis
Chapter 4 Competitive Landscape, 2024
- 4.1 Introduction
- 4.2 Company market share analysis
- 4.3 Competitive positioning matrix
- 4.4 Strategic outlook matrix
Chapter 5 Market Estimates & Forecast, By Component, 2021-2034 (USD Billion)
- 5.1 Key trends
- 5.2 Hardware
- 5.2.1 Cameras
- 5.2.2 Sensors
- 5.2.3 Lenses
- 5.2.4 Detectors
- 5.3 Software
- 5.3.1 Image processing software
- 5.3.2 Data analysis software:
- 5.3.3 Visualization software
- 5.3.4 Calibration software
- 5.3.5 Spectral analysis software
- 5.3.6 Machine learning and AI software
Chapter 6 Market Estimates & Forecast, By Technology, 2021-2034 (USD Billion)
- 6.1 Key trends
- 6.2 Push-broom hyperspectral imaging
- 6.3 Snapshot hyperspectral imaging
- 6.4 Whiskbroom hyperspectral imaging
- 6.5 Others
Chapter 7 Market Estimates & Forecast, By Spectrum Range, 2021-2034 (USD Billion)
- 7.1 Key trends
- 7.2 Visible/Near-Infrared (VNIR)
- 7.3 Shortwave Infrared (SWIR)
- 7.4 Longwave Infrared (LWIR)
Chapter 8 Market Estimates & Forecast, By Application, 2021-2034 (USD Billion)
- 8.1 Key trends
- 8.2 Agriculture
- 8.3 Medical diagnostics
- 8.4 Environmental monitoring
- 8.5 Food and beverages
- 8.6 Industrial inspection
- 8.7 Others
Chapter 9 Market Estimates & Forecast, By Region, 2021-2034 (USD Billion)
- 9.1 Key trends
- 9.2 North America
- 9.2.1 U.S.
- 9.2.2 Canada
- 9.3 Europe
- 9.3.1 UK
- 9.3.2 Germany
- 9.3.3 France
- 9.3.4 Italy
- 9.3.5 Spain
- 9.3.6 Russia
- 9.4 Asia Pacific
- 9.4.1 China
- 9.4.2 India
- 9.4.3 Japan
- 9.4.4 South Korea
- 9.4.5 Australia
- 9.5 Latin America
- 9.5.1 Brazil
- 9.5.2 Mexico
- 9.6 MEA
- 9.6.1 South Africa
- 9.6.2 Saudi Arabia
- 9.6.3 UAE
Chapter 10 Company Profiles
- 10.1 Applied Spectral Imaging
- 10.2 BaySpec, Inc.
- 10.3 ClydeHSI
- 10.4 Corning Incorporated
- 10.5 Cubert GmbH
- 10.6 Diaspective Vision
- 10.7 Gamaya
- 10.8 Headwall Photonics, Inc.
- 10.9 Hinalea Imaging Corp.
- 10.10 HyperMed Imaging, Inc.
- 10.11 imec
- 10.12 Malvern Panalytical Ltd
- 10.13 Norsk Elektro Optikk AS
- 10.14 Orbital Sidekick
- 10.15 Photon Etc
- 10.16 Resonon
- 10.17 Specim, Spectral Imaging Ltd.
- 10.18 Surface Optics Corporation
- 10.19 Telops Inc.
- 10.20 XIMEA GmbH

