デフォルト表紙
市場調査レポート
商品コード
1446479

原薬CDMOの市場規模、シェア、動向分析レポート:製品別、合成別、薬剤別、用途別、ワークフロー別、地域別、セグメント別予測、2024年~2030年

Active Pharmaceutical Ingredient CDMO Market Size, Share & Trends Analysis Report By Product, By Synthesis, By Drug, By Application, By Workflow, By Region, And Segment Forecasts, 2024 - 2030

出版日: | 発行: Grand View Research | ページ情報: 英文 137 Pages | 納期: 2~10営業日

● お客様のご希望に応じて、既存データの加工や未掲載情報(例:国別セグメント)の追加などの対応が可能です。  詳細はお問い合わせください。

価格
価格表記: USDを日本円(税抜)に換算
本日の銀行送金レート: 1USD=156.76円
原薬CDMOの市場規模、シェア、動向分析レポート:製品別、合成別、薬剤別、用途別、ワークフロー別、地域別、セグメント別予測、2024年~2030年
出版日: 2024年02月05日
発行: Grand View Research
ページ情報: 英文 137 Pages
納期: 2~10営業日
  • 全表示
  • 概要
  • 図表
  • 目次
概要

原薬CDMO市場の成長と動向:

世界の原薬CDMO市場規模は2030年に1,645億米ドルとなり、2024年から2030年にかけてCAGR7.4%で成長すると予測されます。

医薬品R&D投資の増加、特許切れ、ジェネリック医薬品と生物学的イノベーションに対する需要の高まりがアウトソーシングの促進要因となっています。

低分子医薬品の増加、原薬(API)の複雑化、コスト削減の必要性が、医薬品分野におけるアウトソーシング・サービスの急速な拡大に寄与しています。開発・製造受託機関(CDMO)分野で世界のリーチと規模を獲得している企業はわずかであり、まだ断片的です。また、多くの企業が原薬と製剤の統合ソースとしてワンストップショップのソリューションを提供しています。

医療業界はダイナミックな変化の過程にあり、急速な技術進歩(自動化やAIなど)、CRO/CMO/CDMOの必要性、研究投資の増加などの要因が医療市場に影響を与えています。活動のアウトソーシングは、業務効率の改善、地理的プレゼンスの拡大、リソースコストの削減、治療に関する専門知識の獲得、オンデマンドサービスの強化など、多くの製薬企業に利益をもたらしています。

COVID-19のパンデミックは、人工呼吸中の重症患者を管理するために必要な医薬品の需要が大幅に増加したことからも明らかなように、原薬メーカーにかつてない期待をかけました。その結果、急激な増産が必要になったことで、原薬CDMOには医薬品供給を維持するための適応力が求められるようになりました。世界の新治療に対する需要の高まりと、パンデミック後の臨床研究の増加が、今後数年間の市場を下支えすると予想されます。

原薬CDMO市場レポートハイライト

  • 従来型の原薬セグメントが市場を独占し、2022年には39.8%の最大収益シェアを占めました。
  • 革新的な医薬品セグメントは2022年に73.7%の収益シェアを占めました。これは主に、新規分子体に対するFDA承認の増加、革新的API企業による研究開発への注力の高まりによるものです。
  • オンコロジー分野は2022年に35.5%の最高売上高シェアで市場をリードしました。これは、がん治療用の高活性APIに対する需要が増加しているためです。
  • バイオ分野は、慢性疾患や感染症の治療にバイオ医薬品が多く採用されていることから、予測期間中に7.0%の最速成長が見込まれています。
  • 臨床ワークフロー分野は、予測期間で最も速いCAGR 7.3%が見込まれています。原薬の需要を支える臨床研究件数の増加が、同分野の成長を促進する主な要因の1つです。
  • アジア太平洋地域では、予測期間中に最速のCAGR 9.1%を記録する見込みです。インドや中国などの発展途上国では製薬会社や製造受託機関の数が急増しているため、この地域は近い将来、欧州や北米を追い抜く可能性が高いです。

目次

第1章 原薬CDMO市場:調査手法と範囲

第2章 原薬CDMO市場:エグゼクティブサマリー

  • 市場スナップショット
  • 製品と合成のスナップショット
  • 医薬品と用途のスナップショット
  • ワークフローのスナップショット
  • 競合情勢のスナップショット

第3章 原薬CDMO市場:変数、動向、および範囲

  • 市場セグメンテーションと範囲
  • 市場系統の見通し
  • 市場力学
  • 市場促進要因分析
  • 市場抑制要因分析
  • 原薬CDMO市場分析ツール

第4章 原薬CDMO市場:製品の推定・動向分析

  • 製品の市場シェア、2023年と2030年
  • セグメントダッシュボード
  • 世界の原薬CDMO市場、製品展望
  • 市場規模、予測、動向分析、2018年から2030年まで

第5章 原薬CDMO市場:合成の推定と推定・動向分析

  • 合成の市場シェア、2023年および2030年
  • セグメントダッシュボード
  • 世界の原薬CDMO市場、合成の見通し
  • 市場規模、予測、動向分析、2018年から2030年まで

第6章 原薬CDMO市場:薬剤の推定・動向分析

  • 薬剤の市場シェア、2023年と2030年
  • セグメントダッシュボード
  • 世界の原薬CDMO市場、医薬品の見通し
  • 市場規模、予測、動向分析、2018年から2030年まで

第7章 原薬CDMO市場:用途の推定・動向分析

  • 用途の市場シェア、2023年と2030年
  • セグメントダッシュボード
  • 世界の原薬CDMO市場、用途の展望
  • 市場規模、予測、動向分析、2018年から2030年まで

第8章 原薬CDMO市場:ワークフローの推定・動向分析

  • ワークフロー市場シェア、2023年と2030年
  • セグメントダッシュボード
  • 世界の原薬CDMO市場、ワークフローの展望
  • 市場規模、予測、動向分析、2018年から2030年まで

第9章 原薬CDMO市場:地域のビジネス分析

  • 地域の市場シェア分析、2023年および2030年
  • 地域の市場ダッシュボード
  • 世界の地域の市場スナップショット
  • 市場規模と予測動向分析、2018年から2030年まで
  • 北米
  • 欧州
  • アジア太平洋地域
  • ラテンアメリカ
  • 中東・アフリカ

第10章 競合情勢

  • 主要市場参入企業別の最近の動向と影響分析
  • 会社/競合の分類
  • ベンダー情勢
    • List Of Key Distributors And Channel Partners
    • Key Customers
    • Key Company Market Share Analysis, 2023
    • Cambrex Corporation
    • Recipharm CP
    • Thermo Fisher Scientific Inc.(Pantheon)
    • CordenPharma International
    • Samsung Biologics
    • Lonza
    • Catalent, Inc.
    • Siegfried Holding AG
    • Piramal Pharma Solutions
    • Boehringer Ingelheim International GmbH
図表

List of Tables

  • Table 1 List of abbreviations
  • Table 2 North America Active Pharmaceutical Ingredient CDMO Market, By Country, 2018 - 2030 (USD Million)
  • Table 3 North America Active Pharmaceutical Ingredient CDMO Market, By Product, 2018 - 2030 (USD Million)
  • Table 4 North America Active Pharmaceutical Ingredient CDMO Market, By Synthesis, 2018 - 2030 (USD Million)
  • Table 5 North America Active Pharmaceutical Ingredient CDMO Market, By Drug, 2018 - 2030 (USD Million)
  • Table 6 North America Active Pharmaceutical Ingredient CDMO Market, By Application, 2018 - 2030 (USD Million)
  • Table 7 North America Active Pharmaceutical Ingredient CDMO Market, By Workflow, 2018 - 2030 (USD Million)
  • Table 8 U.S. Active Pharmaceutical Ingredient CDMO Market, By Product, 2018 - 2030 (USD Million)
  • Table 9 U.S. Active Pharmaceutical Ingredient CDMO Market, By Synthesis, 2018 - 2030 (USD Million)
  • Table 10 U.S. Active Pharmaceutical Ingredient CDMO Market, By Drug, 2018 - 2030 (USD Million)
  • Table 11 U.S. Active Pharmaceutical Ingredient CDMO Market, By Application, 2018 - 2030 (USD Million)
  • Table 12 U.S. Active Pharmaceutical Ingredient CDMO Market, By Workflow, 2018 - 2030 (USD Million)
  • Table 13 Canada Active Pharmaceutical Ingredient CDMO Market, By Product, 2018 - 2030 (USD Million)
  • Table 14 Canada Active Pharmaceutical Ingredient CDMO Market, By Synthesis, 2018 - 2030 (USD Million)
  • Table 15 Canada Active Pharmaceutical Ingredient CDMO Market, By Drug, 2018 - 2030 (USD Million)
  • Table 16 Canada Active Pharmaceutical Ingredient CDMO Market, By Application, 2018 - 2030 (USD Million)
  • Table 17 Canada Active Pharmaceutical Ingredient CDMO Market, By Workflow, 2018 - 2030 (USD Million)
  • Table 18 Europe Active Pharmaceutical Ingredient CDMO Market, By Country, 2018 - 2030 (USD Million)
  • Table 19 Europe Active Pharmaceutical Ingredient CDMO Market, By Product, 2018 - 2030 (USD Million)
  • Table 20 Europe Active Pharmaceutical Ingredient CDMO Market, By Synthesis, 2018 - 2030 (USD Million)
  • Table 21 Europe Active Pharmaceutical Ingredient CDMO Market, By Drug, 2018 - 2030 (USD Million)
  • Table 22 Europe Active Pharmaceutical Ingredient CDMO Market, By Application, 2018 - 2030 (USD Million)
  • Table 23 Europe Active Pharmaceutical Ingredient CDMO Market, By Workflow, 2018 - 2030 (USD Million)
  • Table 24 UK Active Pharmaceutical Ingredient CDMO Market, By Product, 2018 - 2030 (USD Million)
  • Table 25 UK Active Pharmaceutical Ingredient CDMO Market, By Synthesis, 2018 - 2030 (USD Million)
  • Table 26 UK Active Pharmaceutical Ingredient CDMO Market, By Drug, 2018 - 2030 (USD Million)
  • Table 27 UK Active Pharmaceutical Ingredient CDMO Market, By Application, 2018 - 2030 (USD Million)
  • Table 28 UK Active Pharmaceutical Ingredient CDMO Market, By Workflow, 2018 - 2030 (USD Million)
  • Table 29 Germany Active Pharmaceutical Ingredient CDMO Market, By Product, 2018 - 2030 (USD Million)
  • Table 30 Germany Active Pharmaceutical Ingredient CDMO Market, By Synthesis, 2018 - 2030 (USD Million)
  • Table 31 Germany Active Pharmaceutical Ingredient CDMO Market, By Drug, 2018 - 2030 (USD Million)
  • Table 32 Germany Active Pharmaceutical Ingredient CDMO Market, By Application, 2018 - 2030 (USD Million)
  • Table 33 Germany Active Pharmaceutical Ingredient CDMO Market, By Workflow, 2018 - 2030 (USD Million)
  • Table 34 France Active Pharmaceutical Ingredient CDMO Market, By Product, 2018 - 2030 (USD Million)
  • Table 35 France Active Pharmaceutical Ingredient CDMO Market, By Synthesis, 2018 - 2030 (USD Million)
  • Table 36 France Active Pharmaceutical Ingredient CDMO Market, By Drug, 2018 - 2030 (USD Million)
  • Table 37 France Active Pharmaceutical Ingredient CDMO Market, By Application, 2018 - 2030 (USD Million)
  • Table 38 France Active Pharmaceutical Ingredient CDMO Market, By Workflow, 2018 - 2030 (USD Million)
  • Table 39 Italy Active Pharmaceutical Ingredient CDMO Market, By Product, 2018 - 2030 (USD Million)
  • Table 40 Italy Active Pharmaceutical Ingredient CDMO Market, By Synthesis, 2018 - 2030 (USD Million)
  • Table 41 Italy Active Pharmaceutical Ingredient CDMO Market, By Drug, 2018 - 2030 (USD Million)
  • Table 42 Italy Active Pharmaceutical Ingredient CDMO Market, By Application, 2018 - 2030 (USD Million)
  • Table 43 Italy Active Pharmaceutical Ingredient CDMO Market, By Workflow, 2018 - 2030 (USD Million)
  • Table 44 Spain Active Pharmaceutical Ingredient CDMO Market, By Product, 2018 - 2030 (USD Million)
  • Table 45 Spain Active Pharmaceutical Ingredient CDMO Market, By Synthesis, 2018 - 2030 (USD Million)
  • Table 46 Spain Active Pharmaceutical Ingredient CDMO Market, By Drug, 2018 - 2030 (USD Million)
  • Table 47 Spain Active Pharmaceutical Ingredient CDMO Market, By Application, 2018 - 2030 (USD Million)
  • Table 48 Spain Active Pharmaceutical Ingredient CDMO Market, By Workflow, 2018 - 2030 (USD Million)
  • Table 49 Sweden Active Pharmaceutical Ingredient CDMO Market, By Product, 2018 - 2030 (USD Million)
  • Table 50 Sweden Active Pharmaceutical Ingredient CDMO Market, By Synthesis, 2018 - 2030 (USD Million)
  • Table 51 Sweden Active Pharmaceutical Ingredient CDMO Market, By Drug, 2018 - 2030 (USD Million)
  • Table 52 Sweden Active Pharmaceutical Ingredient CDMO Market, By Application, 2018 - 2030 (USD Million)
  • Table 53 Sweden Active Pharmaceutical Ingredient CDMO Market, By Workflow, 2018 - 2030 (USD Million)
  • Table 54 Norway Active Pharmaceutical Ingredient CDMO Market, By Product, 2018 - 2030 (USD Million)
  • Table 55 Norway Active Pharmaceutical Ingredient CDMO Market, By Synthesis, 2018 - 2030 (USD Million)
  • Table 56 Norway Active Pharmaceutical Ingredient CDMO Market, By Drug, 2018 - 2030 (USD Million)
  • Table 57 Norway Active Pharmaceutical Ingredient CDMO Market, By Application, 2018 - 2030 (USD Million)
  • Table 58 Norway Active Pharmaceutical Ingredient CDMO Market, By Workflow, 2018 - 2030 (USD Million)
  • Table 59 Denmark Active Pharmaceutical Ingredient CDMO Market, By Product, 2018 - 2030 (USD Million)
  • Table 60 Denmark Active Pharmaceutical Ingredient CDMO Market, By Synthesis, 2018 - 2030 (USD Million)
  • Table 61 Denmark Active Pharmaceutical Ingredient CDMO Market, By Drug, 2018 - 2030 (USD Million)
  • Table 62 Denmark Active Pharmaceutical Ingredient CDMO Market, By Application, 2018 - 2030 (USD Million)
  • Table 63 Denmark Active Pharmaceutical Ingredient CDMO Market, By Workflow, 2018 - 2030 (USD Million)
  • Table 64 Asia Pacific Active Pharmaceutical Ingredient CDMO Market, By Country, 2018 - 2030 (USD Million)
  • Table 65 Asia Pacific Active Pharmaceutical Ingredient CDMO Market, By Product, 2018 - 2030 (USD Million)
  • Table 66 Asia Pacific Active Pharmaceutical Ingredient CDMO Market, By Synthesis, 2018 - 2030 (USD Million)
  • Table 67 Asia Pacific Active Pharmaceutical Ingredient CDMO Market, By Drug, 2018 - 2030 (USD Million)
  • Table 68 Asia Pacific Active Pharmaceutical Ingredient CDMO Market, By Application, 2018 - 2030 (USD Million)
  • Table 69 Asia Pacific Active Pharmaceutical Ingredient CDMO Market, By Workflow, 2018 - 2030 (USD Million)
  • Table 70 Japan Active Pharmaceutical Ingredient CDMO Market, By Product, 2018 - 2030 (USD Million)
  • Table 71 Japan Active Pharmaceutical Ingredient CDMO Market, By Synthesis, 2018 - 2030 (USD Million)
  • Table 72 Japan Active Pharmaceutical Ingredient CDMO Market, By Drug, 2018 - 2030 (USD Million)
  • Table 73 Japan Active Pharmaceutical Ingredient CDMO Market, By Application, 2018 - 2030 (USD Million)
  • Table 74 Japan Active Pharmaceutical Ingredient CDMO Market, By Workflow, 2018 - 2030 (USD Million)
  • Table 75 China Active Pharmaceutical Ingredient CDMO Market, By Product, 2018 - 2030 (USD Million)
  • Table 76 China Active Pharmaceutical Ingredient CDMO Market, By Synthesis, 2018 - 2030 (USD Million)
  • Table 77 China Active Pharmaceutical Ingredient CDMO Market, By Drug, 2018 - 2030 (USD Million)
  • Table 78 China Active Pharmaceutical Ingredient CDMO Market, By Application, 2018 - 2030 (USD Million)
  • Table 79 China Active Pharmaceutical Ingredient CDMO Market, By Workflow, 2018 - 2030 (USD Million)
  • Table 80 India Active Pharmaceutical Ingredient CDMO Market, By Product, 2018 - 2030 (USD Million)
  • Table 81 India Active Pharmaceutical Ingredient CDMO Market, By Synthesis, 2018 - 2030 (USD Million)
  • Table 82 India Active Pharmaceutical Ingredient CDMO Market, By Drug, 2018 - 2030 (USD Million)
  • Table 83 India Active Pharmaceutical Ingredient CDMO Market, By Application, 2018 - 2030 (USD Million)
  • Table 84 India Active Pharmaceutical Ingredient CDMO Market, By Workflow, 2018 - 2030 (USD Million)
  • Table 85 Australia Active Pharmaceutical Ingredient CDMO Market, By Product, 2018 - 2030 (USD Million)
  • Table 86 Australia Active Pharmaceutical Ingredient CDMO Market, By Synthesis, 2018 - 2030 (USD Million)
  • Table 87 Australia Active Pharmaceutical Ingredient CDMO Market, By Drug, 2018 - 2030 (USD Million)
  • Table 88 Australia Active Pharmaceutical Ingredient CDMO Market, By Application, 2018 - 2030 (USD Million)
  • Table 89 Australia Active Pharmaceutical Ingredient CDMO Market, By Workflow, 2018 - 2030 (USD Million)
  • Table 90 South Korea Active Pharmaceutical Ingredient CDMO Market, By Product, 2018 - 2030 (USD Million)
  • Table 91 South Korea Active Pharmaceutical Ingredient CDMO Market, By Synthesis, 2018 - 2030 (USD Million)
  • Table 92 South Korea Active Pharmaceutical Ingredient CDMO Market, By Drug, 2018 - 2030 (USD Million)
  • Table 93 South Korea Active Pharmaceutical Ingredient CDMO Market, By Application, 2018 - 2030 (USD Million)
  • Table 94 South Korea Active Pharmaceutical Ingredient CDMO Market, By Workflow, 2018 - 2030 (USD Million)
  • Table 95 Thailand Active Pharmaceutical Ingredient CDMO Market, By Product, 2018 - 2030 (USD Million)
  • Table 96 Thailand Active Pharmaceutical Ingredient CDMO Market, By Synthesis, 2018 - 2030 (USD Million)
  • Table 97 Thailand Active Pharmaceutical Ingredient CDMO Market, By Drug, 2018 - 2030 (USD Million)
  • Table 98 Thailand Active Pharmaceutical Ingredient CDMO Market, By Application, 2018 - 2030 (USD Million)
  • Table 99 Thailand Active Pharmaceutical Ingredient CDMO Market, By Workflow, 2018 - 2030 (USD Million)
  • Table 100 Latin America Active Pharmaceutical Ingredient CDMO Market, By Country, 2018 - 2030 (USD Million)
  • Table 101 Latin America Active Pharmaceutical Ingredient CDMO Market, By Product, 2018 - 2030 (USD Million)
  • Table 102 Latin America Active Pharmaceutical Ingredient CDMO Market, By Synthesis, 2018 - 2030 (USD Million)
  • Table 103 Latin America Active Pharmaceutical Ingredient CDMO Market, By Drug, 2018 - 2030 (USD Million)
  • Table 104 Latin America Active Pharmaceutical Ingredient CDMO Market, By Application, 2018 - 2030 (USD Million)
  • Table 105 Latin America Active Pharmaceutical Ingredient CDMO Market, By Workflow, 2018 - 2030 (USD Million)
  • Table 106 Brazil Active Pharmaceutical Ingredient CDMO Market, By Product, 2018 - 2030 (USD Million)
  • Table 107 Brazil Active Pharmaceutical Ingredient CDMO Market, By Synthesis, 2018 - 2030 (USD Million)
  • Table 108 Brazil Active Pharmaceutical Ingredient CDMO Market, By Drug, 2018 - 2030 (USD Million)
  • Table 109 Brazil Active Pharmaceutical Ingredient CDMO Market, By Application, 2018 - 2030 (USD Million)
  • Table 110 Brazil Active Pharmaceutical Ingredient CDMO Market, By Workflow, 2018 - 2030 (USD Million)
  • Table 111 Mexico Active Pharmaceutical Ingredient CDMO Market, By Product, 2018 - 2030 (USD Million)
  • Table 112 Mexico Active Pharmaceutical Ingredient CDMO Market, By Synthesis, 2018 - 2030 (USD Million)
  • Table 113 Mexico Active Pharmaceutical Ingredient CDMO Market, By Drug, 2018 - 2030 (USD Million)
  • Table 114 Mexico Active Pharmaceutical Ingredient CDMO Market, By Application, 2018 - 2030 (USD Million)
  • Table 115 Mexico Active Pharmaceutical Ingredient CDMO Market, By Workflow, 2018 - 2030 (USD Million)
  • Table 116 Argentina Active Pharmaceutical Ingredient CDMO Market, By Product, 2018 - 2030 (USD Million)
  • Table 117 Argentina Active Pharmaceutical Ingredient CDMO Market, By Synthesis, 2018 - 2030 (USD Million)
  • Table 118 Argentina Active Pharmaceutical Ingredient CDMO Market, By Drug, 2018 - 2030 (USD Million)
  • Table 119 Argentina Active Pharmaceutical Ingredient CDMO Market, By Application, 2018 - 2030 (USD Million)
  • Table 120 Argentina Active Pharmaceutical Ingredient CDMO Market, By Workflow, 2018 - 2030 (USD Million)
  • Table 121 Colombia Active Pharmaceutical Ingredient CDMO Market, By Product, 2018 - 2030 (USD Million)
  • Table 122 Colombia Active Pharmaceutical Ingredient CDMO Market, By Synthesis, 2018 - 2030 (USD Million)
  • Table 123 Colombia Active Pharmaceutical Ingredient CDMO Market, By Drug, 2018 - 2030 (USD Million)
  • Table 124 Colombia Active Pharmaceutical Ingredient CDMO Market, By Application, 2018 - 2030 (USD Million)
  • Table 125 Colombia Active Pharmaceutical Ingredient CDMO Market, By Workflow, 2018 - 2030 (USD Million)
  • Table 126 Chile Active Pharmaceutical Ingredient CDMO Market, By Product, 2018 - 2030 (USD Million)
  • Table 127 Chile Active Pharmaceutical Ingredient CDMO Market, By Synthesis, 2018 - 2030 (USD Million)
  • Table 128 Chile Active Pharmaceutical Ingredient CDMO Market, By Drug, 2018 - 2030 (USD Million)
  • Table 129 Chile Active Pharmaceutical Ingredient CDMO Market, By Application, 2018 - 2030 (USD Million)
  • Table 130 Chile Active Pharmaceutical Ingredient CDMO Market, By Workflow, 2018 - 2030 (USD Million)
  • Table 131 MEA Active Pharmaceutical Ingredient CDMO Market, By Country, 2018 - 2030 (USD Million)
  • Table 132 MEA Active Pharmaceutical Ingredient CDMO Market, By Product, 2018 - 2030 (USD Million)
  • Table 133 MEA Active Pharmaceutical Ingredient CDMO Market, By Synthesis, 2018 - 2030 (USD Million)
  • Table 134 MEA Active Pharmaceutical Ingredient CDMO Market, By Drug, 2018 - 2030 (USD Million)
  • Table 135 MEA Active Pharmaceutical Ingredient CDMO Market, By Application, 2018 - 2030 (USD Million)
  • Table 136 MEA Active Pharmaceutical Ingredient CDMO Market, By Workflow, 2018 - 2030 (USD Million)
  • Table 137 South Africa Active Pharmaceutical Ingredient CDMO Market, By Product, 2018 - 2030 (USD Million)
  • Table 138 South Africa Active Pharmaceutical Ingredient CDMO Market, By Synthesis, 2018 - 2030 (USD Million)
  • Table 139 South Africa Active Pharmaceutical Ingredient CDMO Market, By Drug, 2018 - 2030 (USD Million)
  • Table 140 South Africa Active Pharmaceutical Ingredient CDMO Market, By Application, 2018 - 2030 (USD Million)
  • Table 141 South Africa Active Pharmaceutical Ingredient CDMO Market, By Workflow, 2018 - 2030 (USD Million)
  • Table 142 Saudi Arabia Active Pharmaceutical Ingredient CDMO Market, By Product, 2018 - 2030 (USD Million)
  • Table 143 Saudi Arabia Active Pharmaceutical Ingredient CDMO Market, By Synthesis, 2018 - 2030 (USD Million)
  • Table 144 Saudi Arabia Active Pharmaceutical Ingredient CDMO Market, By Drug, 2018 - 2030 (USD Million)
  • Table 145 Saudi Arabia Active Pharmaceutical Ingredient CDMO Market, By Application, 2018 - 2030 (USD Million)
  • Table 146 Saudi Arabia Active Pharmaceutical Ingredient CDMO Market, By Workflow, 2018 - 2030 (USD Million)
  • Table 147 UAE Active Pharmaceutical Ingredient CDMO Market, By Product, 2018 - 2030 (USD Million)
  • Table 148 UAE Active Pharmaceutical Ingredient CDMO Market, By Synthesis, 2018 - 2030 (USD Million)
  • Table 149 UAE Active Pharmaceutical Ingredient CDMO Market, By Drug, 2018 - 2030 (USD Million)
  • Table 150 UAE Active Pharmaceutical Ingredient CDMO Market, By Application, 2018 - 2030 (USD Million)
  • Table 151 UAE Active Pharmaceutical Ingredient CDMO Market, By Workflow, 2018 - 2030 (USD Million)
  • Table 152 Kuwait Active Pharmaceutical Ingredient CDMO Market, By Product, 2018 - 2030 (USD Million)
  • Table 153 Kuwait Active Pharmaceutical Ingredient CDMO Market, By Synthesis, 2018 - 2030 (USD Million)
  • Table 154 Kuwait Active Pharmaceutical Ingredient CDMO Market, By Drug, 2018 - 2030 (USD Million)
  • Table 155 Kuwait Active Pharmaceutical Ingredient CDMO Market, By Application, 2018 - 2030 (USD Million)
  • Table 156 Kuwait Active Pharmaceutical Ingredient CDMO Market, By Workflow, 2018 - 2030 (USD Million)

List of Figures

  • Fig. 1 Market Research Process
  • Fig. 2 Data Triangulation Techniques
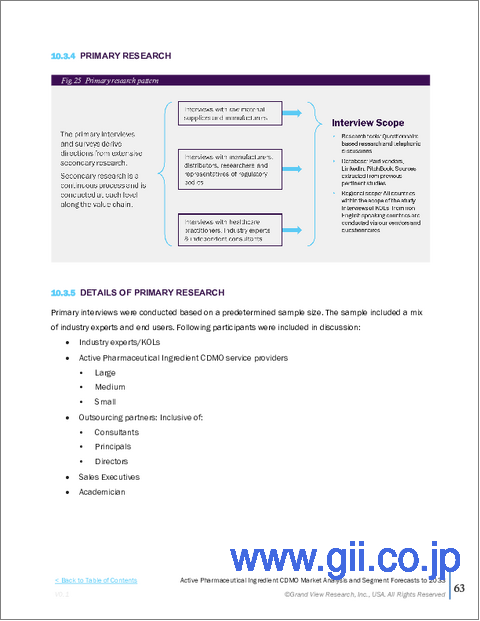
  • Fig. 3 Primary Research Pattern
  • Fig. 4 Primary Interviews In North America
  • Fig. 5 Primary Interviews In Europe
  • Fig. 6 Primary Interviews In APAC
  • Fig. 7 Primary Interviews In Latin America
  • Fig. 8 Primary Interviews In MEA
  • Fig. 9 Market Research Approaches
  • Fig. 10 Value-Chain-Based Sizing & Forecasting
  • Fig. 11 QFD Modeling For Market Share Assessment
  • Fig. 12 Market Formulation & Validation
  • Fig. 13 Active Pharmaceutical Ingredient CDMO Market: Market Outlook
  • Fig. 14 Active Pharmaceutical Ingredient CDMO Market Competitive Insights
  • Fig. 15 Parent Market Outlook
  • Fig. 16 Related/Ancillary Market Outlook
  • Fig. 17 Penetration And Growth Prospect Mapping
  • Fig. 18 Industry Value Chain Analysis
  • Fig. 19 Active Pharmaceutical Ingredient CDMO Market: Driver Impact
  • Fig. 20 Active Pharmaceutical Ingredient CDMO Market: Restraint Impact
  • Fig. 21 Active Pharmaceutical Ingredient CDMO Market Strategic Initiatives Analysis
  • Fig. 22 Active Pharmaceutical Ingredient CDMO Market: Product Movement Analysis
  • Fig. 23 Active Pharmaceutical Ingredient CDMO Market: Product Outlook And Key Takeaways
  • Fig. 24 Traditional API Market Estimates And Forecast, 2018 - 2030
  • Fig. 25 HP-API Market Estimates And Forecast, 2018 - 2030
  • Fig. 26 Antibody-drug Conjugate Market Estimates And Forecast, 2018 - 2030
  • Fig. 27 Other Products Market Estimates And Forecast, 2018 - 2030
  • Fig. 28 Active Pharmaceutical Ingredient CDMO Market: Synthesis Movement Analysis
  • Fig. 29 Active Pharmaceutical Ingredient CDMO Market: Synthesis Outlook And Key Takeaways
  • Fig. 30 Synthetic Market Estimates And Forecasts, 2018 - 2030
  • Fig. 31 Biotech Market Estimates And Forecasts, 2018 - 2030
  • Fig. 32 Active Pharmaceutical Ingredient CDMO Market: Drug Movement Analysis
  • Fig. 33 Active Pharmaceutical Ingredient CDMO Market: Drug Outlook And Key Takeaways
  • Fig. 34 Innovative Market Estimates And Forecasts, 2018 - 2030
  • Fig. 35 Generics Market Estimates And Forecasts, 2018 - 2030
  • Fig. 36 Active Pharmaceutical Ingredient CDMO Market: Application Movement Analysis
  • Fig. 37 Active Pharmaceutical Ingredient CDMO Market: Application Outlook And Key Takeaways
  • Fig. 38 Oncology Market Estimates And Forecasts, 2018 - 2030
  • Fig. 39 Hormonal Market Estimates And Forecasts, 2018 - 2030
  • Fig. 40 Glaucoma Market Estimates And Forecasts, 2018 - 2030
  • Fig. 41 Cardiovascular Diseases Market Estimates And Forecasts, 2018 - 2030
  • Fig. 42 Diabetes Market Estimates And Forecasts, 2018 - 2030
  • Fig. 43 Others Market Estimates And Forecasts, 2018 - 2030
  • Fig. 44 Active Pharmaceutical Ingredient CDMO Market: Workflow Analysis
  • Fig. 45 Active Pharmaceutical Ingredient CDMO Market: Workflow Outlook And Key Takeaways
  • Fig. 46 Clinical Market Estimates And Forecasts, 2018 - 2030
  • Fig. 47 Commercial Market Estimates And Forecasts, 2018 - 2030
  • Fig. 48 Global Active Pharmaceutical Ingredient CDMO Market: Regional Movement Analysis
  • Fig. 49 Global Active Pharmaceutical Ingredient CDMO Market: Regional Outlook And Key Takeaways
  • Fig. 50 Global Active Pharmaceutical Ingredient CDMO Market Share And Leading Players
  • Fig. 51 North America Market Share And Leading Players
  • Fig. 52 Europe Market Share And Leading Players
  • Fig. 53 Asia Pacific Market Share And Leading Players
  • Fig. 54 Latin America Market Share And Leading Players
  • Fig. 55 Middle East & Africa Market Share And Leading Players
  • Fig. 56 North America: SWOT
  • Fig. 57 Europe SWOT
  • Fig. 58 Asia Pacific SWOT
  • Fig. 59 Latin America SWOT
  • Fig. 60 MEA SWOT
  • Fig. 61 North America, By Country
  • Fig. 62 North America
  • Fig. 63 North America Market Estimates And Forecasts, 2018 - 2030
  • Fig. 64 U.S.
  • Fig. 65 U.S. Market Estimates And Forecasts, 2018 - 2030
  • Fig. 66 Canada
  • Fig. 67 Canada Market Estimates And Forecasts, 2018 - 2030
  • Fig. 68 Europe
  • Fig. 69 Europe Market Estimates And Forecasts, 2018 - 2030
  • Fig. 70 UK
  • Fig. 71 UK Market Estimates And Forecasts, 2018 - 2030
  • Fig. 72 Germany
  • Fig. 73 Germany Market Estimates And Forecasts, 2018 - 2030
  • Fig. 74 France
  • Fig. 75 France Market Estimates And Forecasts, 2018 - 2030
  • Fig. 76 Italy
  • Fig. 77 Italy Market Estimates And Forecasts, 2018 - 2030
  • Fig. 78 Spain
  • Fig. 79 Spain Market Estimates And Forecasts, 2018 - 2030
  • Fig. 80 Denmark
  • Fig. 81 Denmark Market Estimates And Forecasts, 2018 - 2030
  • Fig. 82 Sweden
  • Fig. 83 Sweden Market Estimates And Forecasts, 2018 - 2030
  • Fig. 84 Norway
  • Fig. 85 Norway Market Estimates And Forecasts, 2018 - 2030
  • Fig. 86 Asia Pacific
  • Fig. 87 Asia Pacific Market Estimates And Forecasts, 2018 - 2030
  • Fig. 88 China
  • Fig. 89 China Market Estimates And Forecasts, 2018 - 2030
  • Fig. 90 Japan
  • Fig. 91 Japan Market Estimates And Forecasts, 2018 - 2030
  • Fig. 92 India
  • Fig. 93 India Market Estimates And Forecasts, 2018 - 2030
  • Fig. 94 Thailand
  • Fig. 95 Thailand Market Estimates And Forecasts, 2018 - 2030
  • Fig. 96 South Korea
  • Fig. 97 South Korea Market Estimates And Forecasts, 2018 - 2030
  • Fig. 98 Australia
  • Fig. 99 Australia Market Estimates And Forecasts, 2018 - 2030
  • Fig. 100 Latin America
  • Fig. 101 Latin America Market Estimates And Forecasts, 2018 - 2030
  • Fig. 102 Brazil
  • Fig. 103 Brazil Market Estimates And Forecasts, 2018 - 2030
  • Fig. 104 Mexico
  • Fig. 105 Mexico Market Estimates And Forecasts, 2018 - 2030
  • Fig. 106 Argentina
  • Fig. 107 Argentina Market Estimates And Forecasts, 2018 - 2030
  • Fig. 108 Colombia
  • Fig. 109 Colombia Market Estimates And Forecasts, 2018 - 2030
  • Fig. 110 Chile
  • Fig. 111 Chile Market Estimates And Forecasts, 2018 - 2030
  • Fig. 112 Middle East And Africa
  • Fig. 113 Middle East And Africa Market Estimates And Forecasts, 2018 - 2030
  • Fig. 114 South Africa
  • Fig. 115 South Africa Market Estimates And Forecasts, 2018 - 2030
  • Fig. 116 Saudi Arabia
  • Fig. 117 Saudi Arabia Market Estimates And Forecasts, 2018 - 2030
  • Fig. 118 UAE
  • Fig. 119 UAE Market Estimates And Forecasts, 2018 - 2030
  • Fig. 120 Kuwait
  • Fig. 121 Kuwait Market Estimates And Forecasts, 2018 - 2030
  • Fig. 122 Market Share Of Key Players - Active Pharmaceutical Ingredient CDMO Market
目次
Product Code: GVR-4-68038-282-2

Active Pharmaceutical Ingredient CDMO Market Growth & Trends:

The global active pharmaceutical ingredient CDMO market size was valued at USD 164.5 billion in 2030 and is projected to grow at a compound annual growth rate (CAGR) of 7.4% from 2024 to 2030. Increasing pharmaceutical R&D investments, patent expirations, and a rise in demand for generic drugs and biologic innovations propelling outsourcing are the factors driving the market.

The growth of small molecules, rising active pharmaceutical ingredient (API) complexity and the need to reduce costs are factors contributing to the rapid expansion of outsourcing services in the pharmaceutical sector. Only a few companies have achieved global reach and scale in the contract development and manufacturing organization (CDMO) sector, which is still fragmented. Besides, many companies are providing one-stop-shop solutions as an integrated source of APIs and formulations.

As the healthcare industry is undergoing a process of dynamic change, factors such as rapid technological advancements (e.g., automation & AI), the need for CROs/CMOs/CDMOs, and rising investments in research are influencing the healthcare market. The outsourcing of activities is benefitting many pharmaceutical companies in improving their operational efficiencies, expanding their geographical presence, decreasing resource costs, gaining therapeutic expertise, and enhancing on-demand services.

The COVID-19 pandemic placed unprecedented expectations on API makers, as evidenced by the substantial increase in demand for medications required to manage critically ill patients on mechanical ventilation. As a result, the sudden need to rapidly increase production has emphasized the need for adaptability for API CDMOs in maintaining drug supply, with some companies proving to be better prepared to withstand the pressures of quick scale-up than others. Growing demand for new therapies worldwide and an increase in the conduction of clinical research in the post-pandemic period are expected to support the market in the coming years.

Active Pharmaceutical Ingredient CDMO Market Report Highlights:

  • The traditional active pharmaceutical ingredient segment dominated the market and accounted for the largest revenue share of 39.8% in 2022, due to the high adoption of traditional API in majority of pharmaceuticals
  • The innovative drugs segment held 73.7% of the revenue share in 2022. This is largely attributed to increasing FDA approvals for new molecular entities, and the increased focus on R&D by innovator API companies
  • The oncology segment led the market with the highest revenue share of 35.5% in 2022. This is due to the increasing demand for highly potent APIs for cancer therapy
  • The biotech segment is expected to grow at the fastest rate of 7.0% over the forecast period, owing to the high adoption of biopharmaceuticals in the treatment of chronic and infectious diseases
  • The clinical workflow segment is anticipated to witness the fastest CAGR of 7.3% over the forecast period. An increase in the number of clinical research studies supporting the demand for APIs is one of the key factors driving segment growth
  • In Asia Pacific, the market is expected to register the fastest CAGR of 9.1% over the forecast period. Due to the extreme growth in the number of pharmaceutical companies and contract manufacturing organizations in developing countries such as India and China, the region is likely to overtake Europe and North America in the near future

Table of Contents

Chapter 1. Active Pharmaceutical Ingredient CDMO Market: Methodology and Scope

  • 1.1. Market Segmentation And Scope
    • 1.1.1. Segment Definitions
      • 1.1.1.1. Product Segment
      • 1.1.1.2. Synthesis Segment
      • 1.1.1.3. Drug Segment
      • 1.1.1.4. Application segment
      • 1.1.1.5. Workflow segment
  • 1.2. Regional Scope
  • 1.3. Estimates And Forecast Timeline
  • 1.4. Objectives
    • 1.4.1. Objective - 1
    • 1.4.2. Objective - 2
  • 1.5. Research Methodology
  • 1.6. Information Procurement
    • 1.6.1. Purchased Database
    • 1.6.2. GVR's Internal Database
    • 1.6.3. Secondary Sources
    • 1.6.4. Primary Research
  • 1.7. Information or Data Analysis
    • 1.7.1. Data Analysis Models
  • 1.8. Market Formulation & Validation
  • 1.9. Model Details
    • 1.9.1. Commodity Flow Analysis
  • 1.10. List of Primary Sources
  • 1.11. List of Abbreviations

Chapter 2. Active Pharmaceutical Ingredient CDMO Market: Executive Summary

  • 2.1. Market Snapshot
  • 2.2. Products And Synthesis Snapshots
  • 2.3. Drug And Application Snapshot
  • 2.4. Workflow Snapshot
  • 2.5. Competitive Landscape Snapshot

Chapter 3. Active Pharmaceutical Ingredient CDMO Market: Variables, Trends, & Scope

  • 3.1. Market Segmentation And Scope
  • 3.2. Market Lineage Outlook
    • 3.2.1. Parent Market Outlook
    • 3.2.2. Related/Ancillary Market Outlook
  • 3.3. Market Dynamics
  • 3.4. Market Drivers Analysis
    • 3.4.1. Increase in pharmaceutical R&D investment
    • 3.4.2. Rapid demand for generic drugs
    • 3.4.3. Patient expiration
    • 3.4.4. Expanding consumption of biopharmaceuticals
  • 3.5. Market Restraint Analysis
    • 3.5.1. Compliance issues while outsourcing
  • 3.6. Active Pharmaceutical Ingredient CDMO Market Analysis Tools
    • 3.6.1. Industry Analysis - Porter's Five Forces
      • 3.6.1.1. Supplier Power
      • 3.6.1.2. Buyer Power
      • 3.6.1.3. Substitution Threat
      • 3.6.1.4. Threat Of New Entrant
      • 3.6.1.5. Competitive Rivalry
    • 3.6.2. PESTLE Analysis
      • 3.6.2.1. Political Landscape
      • 3.6.2.2. Technological Landscape
      • 3.6.2.3. Economic Landscape

Chapter 4. Active Pharmaceutical Ingredient CDMO Market: Product Estimates & Trend Analysis

  • 4.1. Product Market Share, 2023 & 2030
  • 4.2. Segment Dashboard
  • 4.3. Global Active Pharmaceutical Ingredient CDMO Market, Product Outlook
  • 4.4. Market Size & Forecasts And Trend Analyses, 2018 To 2030 For The Following:
    • 4.4.1. Traditional Active Pharmaceutical Ingredient (Traditional API)
      • 4.4.1.1. Market Estimates And Forecasts 2018 - 2030 (USD Million)
    • 4.4.2. Highly Potent Active Pharmaceutical Ingredient (HP-API)
      • 4.4.2.1. Market Estimates And Forecasts 2018 - 2030 (USD Million)
    • 4.4.3. Antibody Drug Conjugate (ADC)
      • 4.4.3.1. Market Estimates And Forecasts 2018 - 2030 (USD Million)
    • 4.4.4. Others
      • 4.4.4.1. Market Estimates And Forecasts 2018 - 2030 (USD Million)

Chapter 5. Active Pharmaceutical Ingredient CDMO Market: Synthesis Estimates & Trend Analysis

  • 5.1. Synthesis Market Share, 2023 & 2030
  • 5.2. Segment Dashboard
  • 5.3. Global Active Pharmaceutical Ingredient CDMO Market, Synthesis Outlook
  • 5.4. Market Size & Forecasts And Trend Analyses, 2018 To 2030 For The Following:
    • 5.4.1. Synthetic
      • 5.4.1.1. Market Estimates And Forecasts 2018 - 2030 (USD Million)
    • 5.4.2. Biotech
      • 5.4.2.1. Market Estimates And Forecasts 2018 - 2030 (USD Million)

Chapter 6. Active Pharmaceutical Ingredient CDMO Market: Drug Estimates & Trend Analysis

  • 6.1. Drug Market Share, 2023 & 2030
  • 6.2. Segment Dashboard
  • 6.3. Global Active Pharmaceutical Ingredient CDMO Market, Drug Outlook
  • 6.4. Market Size & Forecasts And Trend Analyses, 2018 To 2030 For The Following:
    • 6.4.1. Innovative
      • 6.4.1.1. Market Estimates And Forecasts 2018 - 2030 (USD Million)
    • 6.4.2. Generics
      • 6.4.2.1. Market Estimates And Forecasts 2018 - 2030 (USD Million)

Chapter 7. Active Pharmaceutical Ingredient CDMO Market: Application Estimates & Trend Analysis

  • 7.1. Application Market Share, 2023 & 2030
  • 7.2. Segment Dashboard
  • 7.3. Global Active Pharmaceutical Ingredient CDMO Market, Application Outlook
  • 7.4. Market Size & Forecasts And Trend Analyses, 2018 To 2030 For The Following:
    • 7.4.1. Oncology
      • 7.4.1.1. Market Estimates And Forecasts 2018 - 2030 (USD Million)
    • 7.4.2. Hormonal
      • 7.4.2.1. Market Estimates And Forecasts 2018 - 2030 (USD Million)
    • 7.4.3. Glaucoma
      • 7.4.3.1. Market Estimates And Forecasts 2018 - 2030 (USD Million)
    • 7.4.4. Cardiovascular Disease
      • 7.4.4.1. Market Estimates And Forecasts 2018 - 2030 (USD Million)
    • 7.4.5. Diabetes
      • 7.4.5.1. Market Estimates And Forecasts 2018 - 2030 (USD Million)
    • 7.4.6. Others
      • 7.4.6.1. Market Estimates And Forecasts 2018 - 2030 (USD Million)

Chapter 8. Active Pharmaceutical Ingredient CDMO Market: Workflow Estimates & Trend Analysis

  • 8.1. Workflow Market Share, 2023 & 2030
  • 8.2. Segment Dashboard
  • 8.3. Global Active Pharmaceutical Ingredient CDMO Market, Workflow Outlook
  • 8.4. Market Size & Forecasts And Trend Analyses, 2018 To 2030 For The Following:
    • 8.4.1. Clinical
      • 8.4.1.1. Market Estimates And Forecasts 2018 - 2030 (USD Million)
    • 8.4.2. Commercial
      • 8.4.2.1. Market Estimates And Forecasts 2018 - 2030 (USD Million)

Chapter 9. Active Pharmaceutical Ingredient CDMO Market: Regional Business Analysis

  • 9.1. Regional Market Share Analysis, 2023 & 2030
  • 9.2. Regional Market Dashboard
  • 9.3. Global Regional Market Snapshot
  • 9.4. Marker Size, & Forecasts Trend Analysis, 2018 To 2030:
  • 9.5. North America
    • 9.5.1. U.S.
      • 9.5.1.1. Key Country Dynamics
      • 9.5.1.2. Competitive Scenario
      • 9.5.1.3. Regulatory Framework
      • 9.5.1.4. U.S. Market Estimates And Forecasts 2018 - 2030 (USD Million)
    • 9.5.2. Canada
      • 9.5.2.1. Key Country Dynamics
      • 9.5.2.2. Competitive Scenario
      • 9.5.2.3. Regulatory Framework
      • 9.5.2.4. Canada Market Estimates And Forecasts 2018 - 2030 (USD Million)
  • 9.6. Europe
    • 9.6.1. UK
      • 9.6.1.1. Key Country Dynamics
      • 9.6.1.2. Competitive Scenario
      • 9.6.1.3. Regulatory Framework
      • 9.6.1.4. UK Market Estimates And Forecasts 2018 - 2030 (USD Million)
    • 9.6.2. Germany
      • 9.6.2.1. Key Country Dynamics
      • 9.6.2.2. Competitive Scenario
      • 9.6.2.3. Regulatory Framework
      • 9.6.2.4. Germany Market Estimates And Forecasts 2018 - 2030 (USD Million)
    • 9.6.3. Spain
      • 9.6.3.1. Key Country Dynamics
      • 9.6.3.2. Competitive Scenario
      • 9.6.3.3. Regulatory Framework
      • 9.6.3.4. Spain Market Estimates And Forecasts 2018 - 2030 (USD Million)
    • 9.6.4. France
      • 9.6.4.1. Key Country Dynamics
      • 9.6.4.2. Competitive Scenario
      • 9.6.4.3. Regulatory Framework
      • 9.6.4.4. France Market Estimates And Forecasts 2018 - 2030 (USD Million)
    • 9.6.5. Italy
      • 9.6.5.1. Key Country Dynamics
      • 9.6.5.2. Competitive Scenario
      • 9.6.5.3. Regulatory Framework
      • 9.6.5.4. Italy Market Estimates And Forecasts 2018 - 2030 (USD Million)
    • 9.6.6. Denmark
      • 9.6.6.1. Key Country Dynamics
      • 9.6.6.2. Competitive Scenario
      • 9.6.6.3. Regulatory Framework
      • 9.6.6.4. Denmark Market Estimates And Forecasts 2018 - 2030 (USD Million)
      • 9.6.6.5.
    • 9.6.7. Sweden
      • 9.6.7.1. Key Country Dynamics
      • 9.6.7.2. Competitive Scenario
      • 9.6.7.3. Regulatory Framework
      • 9.6.7.4. Sweden Market Estimates And Forecasts 2018 - 2030 (USD Million)
    • 9.6.8. Norway
      • 9.6.8.1. Key Country Dynamics
      • 9.6.8.2. Competitive Scenario
      • 9.6.8.3. Regulatory Framework
      • 9.6.8.4. Norway Market Estimates And Forecasts 2018 - 2030 (USD Million)
  • 9.7. Asia Pacific
    • 9.7.1. Japan
      • 9.7.1.1. Key Country Dynamics
      • 9.7.1.2. Competitive Scenario
      • 9.7.1.3. Regulatory Framework
      • 9.7.1.4. Japan Market Estimates And Forecasts 2018 - 2030 (USD Million)
    • 9.7.2. China
      • 9.7.2.1. Key Country Dynamics
      • 9.7.2.2. Competitive Scenario
      • 9.7.2.3. Regulatory Framework
      • 9.7.2.4. China Market Estimates And Forecasts 2018 - 2030 (USD Million)
    • 9.7.3. India
      • 9.7.3.1. Key Country Dynamics
      • 9.7.3.2. Competitive Scenario
      • 9.7.3.3. Regulatory Framework
      • 9.7.3.4. India Market Estimates And Forecasts 2018 - 2030 (USD Million)
    • 9.7.4. South Korea
      • 9.7.4.1. Key Country Dynamics
      • 9.7.4.2. Competitive Scenario
      • 9.7.4.3. Regulatory Framework
      • 9.7.4.4. South Korea Market Estimates And Forecasts 2018 - 2030 (USD Million)
    • 9.7.5. Thailand
      • 9.7.5.1. Key Country Dynamics
      • 9.7.5.2. Competitive Scenario
      • 9.7.5.3. Regulatory Framework
      • 9.7.5.4. Thailand Market Estimates And Forecasts 2018 - 2030 (USD Million)
    • 9.7.6. Australia
      • 9.7.6.1. Key Country Dynamics
      • 9.7.6.2. Competitive Scenario
      • 9.7.6.3. Regulatory Framework
      • 9.7.6.4. Australia Market Estimates And Forecasts 2018 - 2030 (USD Million)
  • 9.8. Latin America
    • 9.8.1. Brazil
      • 9.8.1.1. Key Country Dynamics
      • 9.8.1.2. Competitive Scenario
      • 9.8.1.3. Regulatory Framework
      • 9.8.1.4. Brazil Market Estimates And Forecasts 2018 - 2030 (USD Million)
    • 9.8.2. Mexico
      • 9.8.2.1. Key Country Dynamics
      • 9.8.2.2. Competitive Scenario
      • 9.8.2.3. Regulatory Framework
      • 9.8.2.4. Mexico Active Pharmaceutical Ingredient CDMO Market, 2018 - 2030 (USD Million)
    • 9.8.3. Argentina
      • 9.8.3.1. Key Country Dynamics
      • 9.8.3.2. Competitive Scenario
      • 9.8.3.3. Regulatory Framework
      • 9.8.3.4. Argentina Market Estimates And Forecasts 2018 - 2030 (USD Million)
    • 9.8.4. Colombia
      • 9.8.4.1. Key Country Dynamics
      • 9.8.4.2. Competitive Scenario
      • 9.8.4.3. Regulatory Framework
      • 9.8.4.4. Colombia Market Estimates And Forecasts 2018 - 2030 (USD Million)
    • 9.8.5. Chile
      • 9.8.5.1. Key Country Dynamics
      • 9.8.5.2. Competitive Scenario
      • 9.8.5.3. Regulatory Framework
      • 9.8.5.4. Chile Market Estimates And Forecasts 2018 - 2030 (USD Million)
  • 9.9. MEA
    • 9.9.1. South Africa
      • 9.9.1.1. Key Country Dynamics
      • 9.9.1.2. Competitive Scenario
      • 9.9.1.3. Regulatory Framework
      • 9.9.1.4. South Africa Market Estimates And Forecasts 2018 - 2030 (USD Million)
    • 9.9.2. Saudi Arabia
      • 9.9.2.1. Key Country Dynamics
      • 9.9.2.2. Competitive Scenario
      • 9.9.2.3. Regulatory Framework
      • 9.9.2.4. Saudi Arabia Market Estimates And Forecasts 2018 - 2030 (USD Million)
    • 9.9.3. UAE
      • 9.9.3.1. Key Country Dynamics
      • 9.9.3.2. Competitive Scenario
      • 9.9.3.3. Regulatory Framework
      • 9.9.3.4. UAE Market Estimates And Forecasts 2018 - 2030 (USD Million)
    • 9.9.4. Kuwait
      • 9.9.4.1. Key Country Dynamics
      • 9.9.4.2. Competitive Scenario
      • 9.9.4.3. Regulatory Framework
      • 9.9.4.4. Kuwait Market Estimates And Forecasts 2018 - 2030 (USD Million)

Chapter 10. Competitive Landscape

  • 10.1. Recent Developments & Impact Analysis, By Key Market Participants
  • 10.2. Company /Competition Categorization
  • 10.3. Vendor Landscape
    • 10.3.1. List Of Key Distributors And Channel Partners
    • 10.3.2. Key Customers
    • 10.3.3. Key Company Market Share Analysis, 2023
    • 10.3.4. Cambrex Corporation
      • 10.3.4.1. Overview
      • 10.3.4.2. Financial Performance
      • 10.3.4.3. Product Benchmarking
      • 10.3.4.4. Strategic Initiatives
    • 10.3.5. Recipharm CP
      • 10.3.5.1. Overview
      • 10.3.5.2. Financial Performance
      • 10.3.5.3. Product Benchmarking
      • 10.3.5.4. Strategic Initiatives
    • 10.3.6. Thermo Fisher Scientific Inc. (Pantheon)
      • 10.3.6.1. Overview
      • 10.3.6.2. Financial Performance
      • 10.3.6.3. Product Benchmarking
      • 10.3.6.4. Strategic Initiatives
    • 10.3.7. CordenPharma International
      • 10.3.7.1. Overview
      • 10.3.7.2. Financial Performance
      • 10.3.7.3. Product Benchmarking
      • 10.3.7.4. Strategic Initiatives
    • 10.3.8. Samsung Biologics
      • 10.3.8.1. Overview
      • 10.3.8.2. Financial Performance
      • 10.3.8.3. Product Benchmarking
      • 10.3.8.4. Strategic Initiatives
    • 10.3.9. Lonza
      • 10.3.9.1. Overview
      • 10.3.9.2. Financial Performance
      • 10.3.9.3. Product Benchmarking
      • 10.3.9.4. Strategic Initiatives
    • 10.3.10. Catalent, Inc.
      • 10.3.10.1. Overview
      • 10.3.10.2. Financial Performance (Net Revenue/Sales/EBITDA/Gross Profit)
      • 10.3.10.3. Product Benchmarking
      • 10.3.10.4. Strategic Initiatives
    • 10.3.11. Siegfried Holding AG
      • 10.3.11.1. Overview
      • 10.3.11.2. Financial Performance (Net Revenue/Sales/EBITDA/Gross Profit)
      • 10.3.11.3. Product Benchmarking
      • 10.3.11.4. Strategic Initiatives
    • 10.3.12. Piramal Pharma Solutions
      • 10.3.12.1. Overview
      • 10.3.12.2. Financial Performance (Net Revenue/Sales/EBITDA/Gross Profit)
      • 10.3.12.3. Product Benchmarking
      • 10.3.12.4. Strategic Initiatives
    • 10.3.13. Boehringer Ingelheim International GmbH
      • 10.3.13.1. Overview
      • 10.3.13.2. Financial Performance (Net Revenue/Sales/EBITDA/Gross Profit)
      • 10.3.13.3. Product Benchmarking
      • 10.3.13.4. Strategic Initiatives