|
|
市場調査レポート
商品コード
1433600
フィルターの市場規模、シェア、動向分析レポート:製品別、用途別、地域別、セグメント予測、2024年~2030年Filters Market Size, Share & Trends Analysis Report By Product (ICE, Air, Fluid Filters), By Application (Motor Vehicles, Consumer Goods, Industrial & Manufacturing, Utilities), By Region, And Segment Forecasts, 2024 - 2030 |
||||||
|
|
|||||||
カスタマイズ可能
|
|||||||


| フィルターの市場規模、シェア、動向分析レポート:製品別、用途別、地域別、セグメント予測、2024年~2030年 |
|
出版日: 2024年01月19日
発行: Grand View Research
ページ情報: 英文 124 Pages
納期: 2~10営業日
|

- 全表示
- 概要
- 図表
- 目次
フィルター市場の成長と動向:
Grand View Research, Inc.の最新レポートによると、世界のフィルター市場規模は2030年までに1,128億7,000万米ドルに達すると予測され、2024年から2030年までのCAGRは5.2%で拡大すると予測されています。
同市場は、技術動向、規制動向、原材料動向、用途動向など、いくつかの主要動向の影響を受けています。可処分所得の増加、生活水準の向上、アジア太平洋などの新興国市場における自家用車所有の消費動向の変化などの要因による自動車需要の緩やかな増加は、近い将来の市場成長にプラスの影響を与えそうです。インテリジェントな空気ろ過システムの利用が増加していることも、将来の空気ろ過市場を牽引する動向です。これらのシステムは、空気の質、温度、湿度に基づいて部屋や建物内の気流とろ過性能を自動的に調整するように設計されています。モノのインターネット(IoT)技術を空気ろ過システムに組み込むことで、効率の向上と運用コストの削減を目指します。
環境に対する懸念の高まりと消費者行動の変化により、さまざまな政府が環境を保護するための規制やイニシアチブの実施を促しています。安全飲料水法(SDWA)や浄水法(CWA)のような公害防止法の厳格な実施と浄水場数の増加が相まって、フィルター利用のための広い範囲が形成されています。このような厳しい規制の枠組みは、予測期間中の市場形成に重要な役割を果たすと予想されます。
フィルター市場レポートハイライト
- 2023年にはICEフィルター分野が40%以上のシェアでシステムタイプ分野を支配。特にアジア太平洋地域と中南米地域における自動車産業の明るい見通しが、予測期間にわたってICEフィルター市場を牽引すると予測されます。京都議定書、Euro 5、Euro 6といった様々な環境規制が実施され、特に自動車や産業用途による有害排出物の放出が規制されています。この要因は、予測期間にわたってICEフィルターの需要を助長すると予想されます。
- 流体フィルターは、2023年にフィルター産業全体で2番目に大きな製品セグメントとして浮上しました。消費者のヘルスケア意識の高まりと、浄化された飲料水に関する規制の焦点は、予測期間にわたって流体フィルター市場を支援すると予想されます。
- 産業・製造用途セグメントは、2023年に大きな収益シェアを占め、予測期間中により高い速度で上昇すると予測されています。浄化された水が提供する利点に関する消費者の意識の高まりは、将来的にフィルター産業の成長を促進すると推測されます。
- 都市化の進展と可処分所得の増加は、予測期間中に自動車需要を促進すると予想されます。この動向は、予測期間中に市場全体の需要に利益をもたらすと推測されます。
- アジア太平洋地域は、自動車需要の増加、急速な工業化、公害防止のための環境規制の高まりにより、2023年の世界売上高シェアの40.0%以上を占め、世界のフィルター市場を独占しています。さらに、経済発展や工業化を奨励する政府のイニシアチブの増加が、最終用途のフィルター需要を強化すると予想されています。新興経済諸国は、北米や欧州の新興経済諸国と比較して、より速い成長が見込まれています。
- 2023年2月、Camfilは、二酸化硫黄、硫化水素、ホルムアルデヒド、エチレンを含むガス状汚染物質と臭気を効率的に除去するCamPure 8媒体を米国で発売しました。この分子濾過メディアは、パルプ・製紙、石油・ガス、廃水処理、鉱業・金属精錬などの産業で幅広く利用できるほか、臭気や汚染物質を除去することで果物、花、野菜を保存することもできます。
目次
第1章 フィルター市場:調査手法と範囲
第2章 フィルター市場:エグゼクティブサマリー
- 市場スナップショット
- セグメントのスナップショット
- 競合情勢のスナップショット
第3章 フィルター市場:変数、動向、範囲
- 市場系統の見通し
- 業界のバリューチェーン分析
- 規制の枠組み
- テクノロジーフレームワーク
- 市場力学
- 業界分析ツール
第4章 フィルター市場: 製品推定・動向分析
- 製品の変動分析と市場シェア、2023年と2030年
- 製品別、2018年から2030年まで
- 流体フィルター
- ICEフィルター
- エアフィルター
第5章 フィルター市場:用途の推定・動向分析
- 最終用途の変動分析と市場シェア、2023年と2030年
- 用途別、2018年から2030年まで
- 自動車
- 消費財
- 公共事業
- 産業および製造業
- その他
第6章 フィルター市場:地域別の推定・動向分析
- 地域変動分析と市場シェア、2023年と2030年
- 北米
- 北米のフィルター市場の推定・予測、2018~2030年、
- 製品別、2018~2030年、
- 用途別、2018~2030年、
- 米国
- カナダ
- メキシコ
- 欧州
- 欧州のフィルター市場の推定・予測、2018年から2030年、
- 製品別、2018~2030年、
- 用途別、2018~2030年、
- ドイツ
- 英国
- フランス
- スペイン
- イタリア
- アジア太平洋地域
- アジア太平洋地域のフィルター市の市場推定・予測、2018~2030年
- 製品別、2018~2030年、
- 用途別、2018~2030年、
- 中国
- 日本
- インド
- マレーシア
- オーストラリア
- タイ
- 中南米
- 中南米フィルター市場の推定・予測、2018~2030年、
- 製品別、2018~2030年、
- 用途別、2018~2030年、
- ブラジル
- 中東とアフリカ
- 中東およびアフリカの市場推定・予測、2018~2030年をフィルターリングします。
- 製品別、2018~2030年、
- 用途別、2018~2030年、
- サウジアラビア
- 南アフリカ
- エジプト
第7章 フィルター市場-競合情勢
- 主要市場参入企業による最近の動向と影響分析
- 企業の分類
- 企業ヒートマップ分析
- 戦略マッピング
- 拡大
- 合併と買収
- パートナーシップとコラボレーション
- 新製品の発売
- 研究開発
- 企業プロファイル
- 3M Company
- Airex Filter Corporation
- Freudenberg Filtration Technologies SE &Co. KG
- Donaldson Company, Inc.
- Koch Filter
- Camfil AB
- Parker Hannifin Corporation.
- DENSO Corporation
- Clark Air Systems
- Spectrum Filtration Pvt. Ltd
List of Tables
- Table 1. Fluid filters market estimates and forecasts, 2018 - 2030 (USD Million)
- Table 2. ICE filters market estimates and forecasts, 2018 - 2030 (USD Million)
- Table 3. Air filters market estimates and forecasts, 2018 - 2030 (USD Million)
- Table 4. Filters market estimates and forecasts, in motor vehicles, 2018 - 2030 (USD Million)
- Table 5. Filters market estimates and forecasts, in consumer goods, 2018 - 2030 (USD Million)
- Table 6. Filters market estimates and forecasts, in utilities, 2018 - 2030 (USD Million)
- Table 7. Filters market estimates and forecasts, in industrial and manufacturing, 2018 - 2030 (USD Million)
- Table 8. Filters market estimates and forecasts, in other applications, 2018 - 2030 (USD Million)
- Table 9. North America filters market estimates and forecasts, 2018 - 2030 (USD Million)
- Table 10. North America filters market estimates and forecasts, by product, 2018 - 2030 (USD Million)
- Table 11. North America filters market estimates and forecasts, by application, 2018 - 2030 (USD Million)
- Table 12. U.S. filters market estimates and forecasts, 2018 - 2030 (USD Million)
- Table 13. U.S. filters market estimates and forecasts, by product, 2018 - 2030 (USD Million)
- Table 14. U.S. filters market estimates and forecasts, by application, 2018 - 2030 (USD Million)
- Table 15. Canada filters market estimates and forecasts, 2018 - 2030 (USD Million)
- Table 16. Canada filters market estimates and forecasts, by product, 2018 - 2030 (USD Million)
- Table 17. Canada filters market estimates and forecasts, by application, 2018 - 2030 (USD Million)
- Table 18. Mexico filters market estimates and forecasts, 2018 - 2030 (USD Million)
- Table 19. Mexico filters market estimates and forecasts, by product, 2018 - 2030 (USD Million)
- Table 20. Mexico filters market estimates and forecasts, by application, 2018 - 2030 (USD Million)
- Table 21. Europe filters market estimates and forecasts, 2018 - 2030 (USD Million)
- Table 22. Europe filters market estimates and forecasts, by product, 2018 - 2030 (USD Million)
- Table 23. Europe filters market estimates and forecasts, by application, 2018 - 2030 (USD Million)
- Table 24. Germany filters market estimates and forecasts, 2018 - 2030 (USD Million)
- Table 25. Germany filters market estimates and forecasts, by product, 2018 - 2030 (USD Million)
- Table 26. Germany filters market estimates and forecasts, by application, 2018 - 2030 (USD Million)
- Table 27. U.K. filters market estimates and forecasts, 2018 - 2030 (USD Million)
- Table 28. U.K. filters market estimates and forecasts, by product, 2018 - 2030 (USD Million)
- Table 29. U.K. filters market estimates and forecasts, by application, 2018 - 2030 (USD Million)
- Table 30. France filters market estimates and forecasts, 2018 - 2030 (USD Million)
- Table 31. France filters market estimates and forecasts, by product, 2018 - 2030 (USD Million)
- Table 32. France filters market estimates and forecasts, by application, 2018 - 2030 (USD Million)
- Table 33. Italy filters market estimates and forecasts, 2018 - 2030 (USD Million)
- Table 34. Italy filters market estimates and forecasts, by product, 2018 - 2030 (USD Million)
- Table 35. Italy filters market estimates and forecasts, by application, 2018 - 2030 (USD Million)
- Table 36. Spain filters market estimates and forecasts, 2018 - 2030 (USD Million)
- Table 37. Spain filters market estimates and forecasts, by product, 2018 - 2030 (USD Million)
- Table 38. Spain filters market estimates and forecasts, by application, 2018 - 2030 (USD Million)
- Table 39. Asia Pacific filters market estimates and forecasts, 2018 - 2030 (USD Million)
- Table 40. Asia Pacific filters market estimates and forecasts, by product, 2018 - 2030 (USD Million)
- Table 41. Asia Pacific filters market estimates and forecasts, by application, 2018 - 2030 (USD Million)
- Table 42. China filters market estimates and forecasts, 2018 - 2030 (USD Million)
- Table 43. China filters market estimates and forecasts, by product, 2018 - 2030 (USD Million)
- Table 44. China filters market estimates and forecasts, by application, 2018 - 2030 (USD Million)
- Table 45. India filters market estimates and forecasts, 2018 - 2030 (USD Million)
- Table 46. India filters market estimates and forecasts, by product, 2018 - 2030 (USD Million)
- Table 47. India filters market estimates and forecasts, by application, 2018 - 2030 (USD Million)
- Table 48. Japan filters market estimates and forecasts, 2018 - 2030 (USD Million)
- Table 49. Japan filters market estimates and forecasts, by product, 2018 - 2030 (USD Million)
- Table 50. Japan filters market estimates and forecasts, by application, 2018 - 2030 (USD Million)
- Table 51. Australia filters market estimates and forecasts, 2018 - 2030 (USD Million)
- Table 52. Australia filters market estimates and forecasts, by product, 2018 - 2030 (USD Million)
- Table 53. Australia filters market estimates and forecasts, by application, 2018 - 2030 (USD Million)
- Table 54. Malaysia filters market estimates and forecasts, 2018 - 2030 (USD Million)
- Table 55. Malaysia filters market estimates and forecasts, by product, 2018 - 2030 (USD Million)
- Table 56. Malaysia filters market estimates and forecasts, by application, 2018 - 2030 (USD Million)
- Table 57. Thailand filters market estimates and forecasts, 2018 - 2030 (USD Million)
- Table 58. Thailand filters market estimates and forecasts, by product, 2018 - 2030 (USD Million)
- Table 59. Thailand filters market estimates and forecasts, by application, 2018 - 2030 (USD Million)
- Table 60. Central & South America filters market estimates and forecasts, 2018 - 2030 (USD Million)
- Table 61. Central & South America filters market estimates and forecasts, by product, 2018 - 2030 (USD Million)
- Table 62. Central & South America filters market estimates and forecasts, by application, 2018 - 2030 (USD Million)
- Table 63. Brazil filters market estimates and forecasts, 2018 - 2030 (USD Million)
- Table 64. Brazil filters market estimates and forecasts, by product, 2018 - 2030 (USD Million)
- Table 65. Brazil filters market estimates and forecasts, by application, 2018 - 2030 (USD Million)
- Table 66. Middle East & Africa filters market estimates and forecasts, 2018 - 2030 (USD Million)
- Table 67. Middle East & Africa filters market estimates and forecasts, by product, 2018 - 2030 (USD Million)
- Table 68. Middle East & Africa filters market estimates and forecasts, by application, 2018 - 2030 (USD Million)
- Table 69. South Africa filters market estimates and forecasts, 2018 - 2030 (USD Million)
- Table 70. South Africa filters market estimates and forecasts, by product, 2018 - 2030 (USD Million)
- Table 71. South Africa filters market estimates and forecasts, by application, 2018 - 2030 (USD Million)
- Table 72. Saudi Arabia filters market estimates and forecasts, 2018 - 2030 (USD Million)
- Table 73. Saudi Arabia filters market estimates and forecasts, by product, 2018 - 2030 (USD Million)
- Table 74. Saudi Arabia filters market estimates and forecasts, by application, 2018 - 2030 (USD Million)
- Table 75. Egypt filters market estimates and forecasts, 2018 - 2030 (USD Million)
- Table 76. Egypt filters market estimates and forecasts, by product, 2018 - 2030 (USD Million)
- Table 77. Egypt filters market estimates and forecasts, by application, 2018 - 2030 (USD Million)
List of Figures
- Fig. 1 Filters market segmentation
- Fig. 2 Information Procurement
- Fig. 3 Primary Research Pattern
- Fig. 4 Primary Research Process
- Fig. 5 Market research approaches - Bottom Up Approach
- Fig. 6 Market research approaches - Top Down Approach
- Fig. 7 Market research approaches - Combined Approach
- Fig. 8 Filters market: Penetration & growth prospect mapping
- Fig. 9 Filters market: Value chain analysis
- Fig. 10 Market dynamics
- Fig. 11 Filters market driver impact analysis
- Fig. 12 Global automobile demand, 2010 - 2018 (Million Units)
- Fig. 13 Filters market restraint impact
- Fig. 14 Key opportunities - prioritized
- Fig. 15 Filters market: Product movement analysis, 2021 & 2030
- Fig. 16 Filters market: Application movement analysis, 2021 & 2030
- Fig. 17 Filters market: Key company/ competition categorization
- Fig. 18 Filters market: Strategic framework
Filters Market Growth & Trends:
The global filters market size is anticipated to reach USD 112.87 billion by 2030 and is anticipated to expand at a CAGR of 5.2% from 2024 to 2030, according to a new report by Grand View Research, Inc. The market is influenced by several key trends such as technology trends, regulatory trends, raw material trends, and application trends. Moderately growing demand for automobiles owing to factors such as rising disposable incomes, rising standards of living, and switching consumer trends for owning a private vehicle in developing regions such as Asia Pacific are likely to positively affect the market growth in the near future. The increasing use of intelligent air filtration systems is another trend driving the future air filtration market. These systems are designed to automatically adjust airflow and filtration performance within a room or building based on air quality, temperature, and humidity. Integrating Internet of Things (IoT) technology into air filtration systems aims to increase efficiency and reduce operating costs.
Growing environmental concerns and changing consumer behavior have prompted various governments to implement regulations and initiatives to safeguard the environment. Stringent implementation of pollution control acts like the Safe Drinking Water Act (SDWA) and Clean Water Act (CWA), coupled with a rise in the number of water treatment plants, have created a wide scope for the utilization of filters. Such a stringent regulatory framework is anticipated to play a key role in shaping the market over the forecast period.
Filters Market Report Highlights:
- The ICE filters segment dominated the system type segment with more than 40% share in 2023. The positive outlook of the automobile industry, especially in the Asia Pacific and Central & South America regions, is expected to drive the market for ICE filters over the forecast period. There has been the implementation of various environmental regulations such as the Kyoto Protocol, Euro 5, and Euro 6 to control the release of harmful emissions, especially by automobiles and industrial applications. This factor is expected to aid the demand for ICE filters over the forecast period
- Fluid filters emerged as the second largest product segment of the overall filters industry in 2023. Growing healthcare awareness among consumers, coupled with a regulatory focus about purified drinking water is anticipated to aid the market for fluid filters over the projected period
- The industrial and manufacturing application segment accounted for a significant revenue share in 2023 and is expected to ascend at a higher rate in the projected time frame. Growing consumer awareness regarding the benefits offered by purified water is presumed to drive the growth of filter industry in future years
- Increasing urbanization coupled with rising disposable income is expected to propel the demand for motor vehicles over the projected period. This trend in turn is presumed to benefit the demand for the overall market over the forecast period
- Asia Pacific dominated the global filters market accounting for over 40.0% of the global revenue share in 2023 on account of the rising automotive demand, rapid industrialization coupled with rising environmental regulations for pollution control. Furthermore, increasing government initiatives encouraging economic development as well as industrialization are anticipated to bolster the end-use filter demand. Emerging economies are slated to witness faster growth when compared to the developed economies of North America and Europe
- In February 2023, Camfil launched its CamPure 8 media in the U.S. for the efficient removal of gaseous contaminants and odors, including sulfur dioxide, hydrogen sulfide, formaldehyde, and ethylene. The molecular filtration media can be utilized extensively in industries such as pulp & paper, oil & gas, wastewater treatment, and mining & metal refining, while also preserving fruits, flowers, and vegetables by removing odors and contaminants
Table of Contents
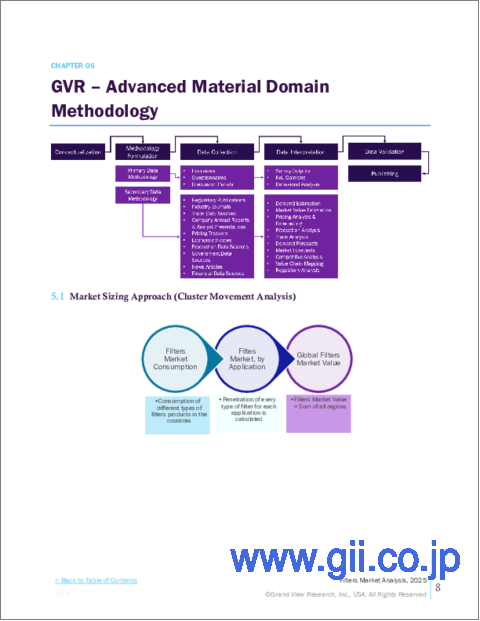
Chapter 1. Filters Market: Methodology and Scope
- 1.1. Market Segmentation & Scope
- 1.2. Market Definition
- 1.3. Information Procurement
- 1.3.1. Purchased Database
- 1.3.2. GVR's Internal Database
- 1.3.3. Secondary Sources & Third-Party Perspectives
- 1.3.4. Primary Research
- 1.4. Information Analysis
- 1.4.1. Data Analysis Models
- 1.5. Market Formulation & Data Visualization
- 1.6. Data Validation & Publishing
Chapter 2. Filters Market: Executive Summary
- 2.1. Market Snapshot
- 2.2. Segment Snapshot
- 2.3. Competitive Landscape Snapshot
Chapter 3. Filters Market: Variables, Trends & Scope
- 3.1. Market Lineage Outlook
- 3.1.1. Parent Market Outlook
- 3.1.2. Related Market Outlook
- 3.2. Industry Value Chain Analysis
- 3.2.1. Distribution Channel Analysis
- 3.2.2. Raw Material Trends
- 3.2.3. Technological Overview
- 3.3. Regulatory Framework
- 3.4. Technology Framework
- 3.5. Market Dynamics
- 3.5.1. Market Driver Analysis
- 3.5.2. Market Restraint Analysis
- 3.5.3. Industry Challenges
- 3.5.4. Industry Opportunities
- 3.6. Industry Analysis Tools
- 3.6.1. Porter's Five Forces Analysis
- 3.6.2. Macro-environmental Analysis
Chapter 4. Filters Market: Product Estimates & Trend Analysis
- 4.1. System Type Movement Analysis & Market Share, 2023 & 2030
- 4.2. Filters Market Estimates & Forecast, By Product, 2018 to 2030 (USD Million)
- 4.3. Fluid Filters
- 4.3.1. Market Revenue Estimates and Forecasts, 2018 - 2030 (USD Million)
- 4.4. ICE Filters
- 4.4.1. Market Revenue Estimates and Forecasts, 2018 - 2030 (USD Million)
- 4.5. Air Filters
- 4.5.1. Market Revenue Estimates and Forecasts, 2018 - 2030 (USD Million)
Chapter 5. Filters Market: Application Estimates & Trend Analysis
- 5.1. End-use Movement Analysis & Market Share, 2023 & 2030
- 5.2. Filters Market Estimates & Forecast, By Application, 2018 to 2030 (USD Million)
- 5.3. Motor Vehicle
- 5.3.1. Market Revenue Estimates and Forecasts, 2018 - 2030 (USD Million)
- 5.4. Consumers Goods
- 5.4.1. Market Revenue Estimates and Forecasts, 2018 - 2030 (USD Million)
- 5.5. Utilities
- 5.5.1. Market Revenue Estimates and Forecasts, 2018 - 2030 (USD Million)
- 5.6. Industrial & Manufacturing
- 5.6.1. Market Revenue Estimates and Forecasts, 2018 - 2030 (USD Million)
- 5.7. Others
- 5.7.1. Market Revenue Estimates and Forecasts, 2018 - 2030 (USD Million)
Chapter 6. Filters Market: Regional Estimates & Trend Analysis
- 6.1. Regional Movement Analysis & Market Share, 2023 & 2030
- 6.2. North America
- 6.2.1. North America filters market estimates & forecast, 2018 - 2030, (USD Million)
- 6.2.2. North America filters market estimates & forecast, by product, 2018 - 2030, (USD Million)
- 6.2.3. North America filters market estimates & forecast, by application, 2018 - 2030, (USD Million)
- 6.2.4. U.S.
- 6.2.4.1. U.S. filters market estimates & forecast, 2018 - 2030, (USD Million)
- 6.2.4.2. U.S. filters market estimates & forecast, by product, 2018 - 2030, (USD Million)
- 6.2.4.3. U.S. filters market estimates & forecast, by application, 2018 - 2030, (USD Million)
- 6.2.5. Canada
- 6.2.5.1. Canada filters market estimates & forecast, 2018 - 2030, (USD Million)
- 6.2.5.2. Canada filters market estimates & forecast, by product, 2018 - 2030, (USD Million)
- 6.2.5.3. Canada filters market estimates & forecast, by application, 2018 - 2030, (USD Million)
- 6.2.6. Mexico
- 6.2.6.1. Mexico filters market estimates & forecast, 2018 - 2030, (USD Million)
- 6.2.6.2. Mexico filters market estimates & forecast, by product, 2018 - 2030, (USD Million)
- 6.2.6.3. Mexico filters market estimates & forecast, by application, 2018 - 2030, (USD Million)
- 6.3. Europe
- 6.3.1. Europe filters market estimates & forecast, 2018 - 2030, (USD Million)
- 6.3.2. Europe filters market estimates & forecast, by product, 2018 - 2030, (USD Million)
- 6.3.3. Europe filters market estimates & forecast, by application, 2018 - 2030, (USD Million)
- 6.3.4. Germany
- 6.3.4.1. Germany filters market estimates & forecast, 2018 - 2030, (USD Million)
- 6.3.4.2. Germany filters market estimates & forecast, by product, 2018 - 2030, (USD Million)
- 6.3.4.3. Germany filters market estimates & forecast, by application, 2018 - 2030, (USD Million)
- 6.3.5. UK
- 6.3.5.1. UK filters market estimates & forecast, 2018 - 2030, (USD Million)
- 6.3.5.2. UK filters market estimates & forecast, by product, 2018 - 2030, (USD Million)
- 6.3.5.3. UK filters market estimates & forecast, by application, 2018 - 2030, (USD Million)
- 6.3.6. France
- 6.3.6.1. France filters market estimates & forecast, 2018 - 2030, (USD Million)
- 6.3.6.2. France filters market estimates & forecast, by product, 2018 - 2030, (USD Million)
- 6.3.6.3. France filters market estimates & forecast, by application, 2018 - 2030, (USD Million)
- 6.3.7. Spain
- 6.3.7.1. Spain filters market estimates & forecast, 2018 - 2030, (USD Million)
- 6.3.7.2. Spain filters market estimates & forecast, by product, 2018 - 2030, (USD Million)
- 6.3.7.3. Spain filters market estimates & forecast, by application, 2018 - 2030, (USD Million)
- 6.3.8. Italy
- 6.3.8.1. Italy filters market estimates & forecast, 2018 - 2030, (USD Million)
- 6.3.8.2. Italy filters market estimates & forecast, by product, 2018 - 2030, (USD Million)
- 6.3.8.3. Italy filters market estimates & forecast, by application, 2018 - 2030, (USD Million)
- 6.4. Asia Pacific
- 6.4.1. Asia Pacific filters market estimates & forecast, 2018 - 2030, (USD Million)
- 6.4.2. Asia Pacific filters market estimates & forecast, by product, 2018 - 2030, (USD Million)
- 6.4.3. Asia Pacific filters market estimates & forecast, by application, 2018 - 2030, (USD Million)
- 6.4.4. China
- 6.4.4.1. China filters market estimates & forecast, 2018 - 2030, (USD Million)
- 6.4.4.2. China filters market estimates & forecast, by product, 2018 - 2030, (USD Million)
- 6.4.4.3. China filters market estimates & forecast, by application, 2018 - 2030, (USD Million)
- 6.4.5. Japan
- 6.4.5.1. Japan filters market estimates & forecast, 2018 - 2030, (USD Million)
- 6.4.5.2. Japan filters market estimates & forecast, by product, 2018 - 2030, (USD Million)
- 6.4.5.3. Japan filters market estimates & forecast, by application, 2018 - 2030, (USD Million)
- 6.4.6. India
- 6.4.6.1. India filters market estimates & forecast, 2018 - 2030, (USD Million)
- 6.4.6.2. India filters market estimates & forecast, by product, 2018 - 2030, (USD Million)
- 6.4.6.3. India filters market estimates & forecast, by application, 2018 - 2030, (USD Million)
- 6.4.7. Malaysia
- 6.4.7.1. Malaysia filters market estimates & forecast, 2018 - 2030, (USD Million)
- 6.4.7.2. Malaysia filters market estimates & forecast, by product, 2018 - 2030, (USD Million)
- 6.4.7.3. Malaysia filters market estimates & forecast, by application, 2018 - 2030, (USD Million)
- 6.4.8. Australia
- 6.4.8.1. Australia filters market estimates & forecast, 2018 - 2030, (USD Million)
- 6.4.8.2. Australia filters market estimates & forecast, by product, 2018 - 2030, (USD Million)
- 6.4.8.3. Australia filters market estimates & forecast, by application, 2018 - 2030, (USD Million)
- 6.4.9. Thailand
- 6.4.9.1. Thailand filters market estimates & forecast, 2018 - 2030, (USD Million)
- 6.4.9.2. Thailand filters market estimates & forecast, by product, 2018 - 2030, (USD Million)
- 6.4.9.3. Thailand filters market estimates & forecast, by application, 2018 - 2030, (USD Million)
- 6.5. Central & South America
- 6.5.1. Central & South America filters market estimates & forecast, 2018 - 2030, (USD Million)
- 6.5.2. Central & South America filters market estimates & forecast, by product, 2018 - 2030, (USD Million)
- 6.5.3. Central & South America filters market estimates & forecast, by application, 2018 - 2030, (USD Million)
- 6.5.4. Brazil
- 6.5.4.1. Brazil filters market estimates & forecast, 2018 - 2030, (USD Million)
- 6.5.4.2. Brazil filters market estimates & forecast, by product, 2018 - 2030, (USD Million)
- 6.5.4.3. Brazil filters market estimates & forecast, by application, 2018 - 2030, (USD Million)
- 6.6. Middle East & Africa
- 6.6.1. Middle East & Africa filters market estimates & forecast, 2018 - 2030, (USD Million)
- 6.6.2. Middle East & Africa filters market estimates & forecast, by product, 2018 - 2030, (USD Million)
- 6.6.3. Middle East & Africa filters market estimates & forecast, by application, 2018 - 2030, (USD Million)
- 6.6.4. Saudi Arabia
- 6.6.4.1. Saudi Arabia filters market estimates & forecast, 2018 - 2030, (USD Million)
- 6.6.4.2. Saudi Arabia filters market estimates & forecast, by product, 2018 - 2030, (USD Million)
- 6.6.4.3. Saudi Arabia filters market estimates & forecast, by application, 2018 - 2030, (USD Million)
- 6.6.5. South Africa
- 6.6.5.1. South Africa filters market estimates & forecast, 2018 - 2030, (USD Million)
- 6.6.5.2. South Africa filters market estimates & forecast, by product, 2018 - 2030, (USD Million)
- 6.6.5.3. South Africa filters market estimates & forecast, by application, 2018 - 2030, (USD Million)
- 6.6.6. Egypt
- 6.6.6.1. Egypt filters market estimates & forecast, 2018 - 2030, (USD Million)
- 6.6.6.2. Egypt filters market estimates & forecast, by product, 2018 - 2030, (USD Million)
- 6.6.6.3. Egypt filters market estimates & forecast, by application, 2018 - 2030, (USD Million)
Chapter 7. Filters Market - Competitive Landscape
- 7.1. Recent Developments & Impact Analysis, By Key Market Participants
- 7.2. Company Categorization
- 7.3. Company Heat Map Analysis
- 7.4. Strategy Mapping
- 7.4.1. Expansion
- 7.4.2. Mergers & Acquisition
- 7.4.3. Partnerships & Collaborations
- 7.4.4. New Product Launches
- 7.4.5. Research And Development
- 7.5. Company Profiles
- 7.5.1. 3M Company
- 7.5.1.1. Participant's overview
- 7.5.1.2. Financial performance
- 7.5.1.3. Product benchmarking
- 7.5.1.4. Recent developments
- 7.5.2. Airex Filter Corporation
- 7.5.2.1. Participant's overview
- 7.5.2.2. Financial performance
- 7.5.2.3. Product benchmarking
- 7.5.2.4. Recent developments
- 7.5.3. Freudenberg Filtration Technologies SE & Co. KG
- 7.5.3.1. Participant's overview
- 7.5.3.2. Financial performance
- 7.5.3.3. Product benchmarking
- 7.5.3.4. Recent developments
- 7.5.4. Donaldson Company, Inc.
- 7.5.4.1. Participant's overview
- 7.5.4.2. Financial performance
- 7.5.4.3. Product benchmarking
- 7.5.4.4. Recent developments
- 7.5.5. Koch Filter
- 7.5.5.1. Participant's overview
- 7.5.5.2. Financial performance
- 7.5.5.3. Product benchmarking
- 7.5.5.4. Recent developments
- 7.5.6. Camfil AB
- 7.5.6.1. Participant's overview
- 7.5.6.2. Financial performance
- 7.5.6.3. Product benchmarking
- 7.5.6.4. Recent developments
- 7.5.7. Parker Hannifin Corporation.
- 7.5.7.1. Participant's overview
- 7.5.7.2. Financial performance
- 7.5.7.3. Product benchmarking
- 7.5.7.4. Recent developments
- 7.5.8. DENSO Corporation
- 7.5.8.1. Participant's overview
- 7.5.8.2. Financial performance
- 7.5.8.3. Product benchmarking
- 7.5.8.4. Recent developments
- 7.5.9. Clark Air Systems
- 7.5.9.1. Participant's overview
- 7.5.9.2. Financial performance
- 7.5.9.3. Product benchmarking
- 7.5.9.4. Recent developments
- 7.5.10. Spectrum Filtration Pvt. Ltd
- 7.5.10.1. Participant's overview
- 7.5.10.2. Financial performance
- 7.5.10.3. Product benchmarking
- 7.5.10.4. Recent developments
- 7.5.1. 3M Company
