|
|
市場調査レポート
商品コード
1433532
グラフェンの市場規模、シェア、動向分析レポート:製品別、用途別、最終用途別、地域別、セグメント別予測、2024年~2030年Graphene Market Size, Share & Trends Analysis Report By Product (Graphene Nanoplatelets, Graphene Oxide), By Application (Paints & Coatings, Electronic Components), By End-Use, By Region, And Segment Forecasts, 2024 - 2030 |
||||||
|
|||||||
カスタマイズ可能
|
|||||||

| グラフェンの市場規模、シェア、動向分析レポート:製品別、用途別、最終用途別、地域別、セグメント別予測、2024年~2030年 |
|
出版日: 2024年01月02日
発行: Grand View Research
ページ情報: 英文 125 Pages
納期: 2~10営業日
|

全表示
- 概要
- 図表
- 目次
グラフェン市場の成長と動向:
Grand View Research, Inc.の最新レポートによると、世界のグラフェン市場は2030年までに16億米ドルに達し、予測期間中にCAGR 35.1%で拡大すると予測されています。
自動車、エレクトロニクス、航空宇宙、建築、医療など、さまざまな最終用途産業におけるグラフェンの浸透が進んでいることが、市場の需要を押し上げると予想されます。また、さまざまな多国籍企業や研究機関からの研究開発目的の需要の高まりは、市場の成長をさらに加速させると予想されます。
グラフェン製造の研究開発が進んでいることも、さまざまな用途での製品利用を後押しするとみられます。例えば、2020年に確認されたフラッシュジュール加熱技術は有望な結果を示しました。研究では、炭素源に大量の電気を流すと、炭素-炭素結合がグラフェン構造に再編成されることが実証されています。この方法を用いれば、石炭やゴミのような炭素を含む物質であっても、比較的低コストで何キロもの高品質のグラフェンに変換することができます。
現在の製造方法は資本集約的であり、高いエネルギーと資源コストを必要とします。現在、市場で入手可能なグラフェンの量は研究者の需要を満たすことができるが、完全な商業化市場はまだ初期段階にあります。新素材の開発から製造、企業への応用に至るまでには、何ポンドものグラフェン粉末と何百枚ものグラフェンシートが必要であり、多大な時間と労力がかかります。これはグラフェンメーカーにとって課題となりうる。
グラフェン市場は、安全、健康、環境に関する複雑な規制によって管理されています。グラフェン材料の製造、マテリアルハンドリング、応用は、国内外の規制当局によって厳しく規制されています。これらの厳しいガイドラインには、適切な製造と使用を保証する一方で、潜在的な健康リスクや環境への影響も含まれています。市場参入企業は、こうした規制を遵守することで、競合他社に対する競争優位性を獲得し、利益を得ると予想されます。
市場は非常にダイナミックで、さまざまな中小規模のメーカーが存在するため、激しい競合が見られます。主な業界参加者は、競争力を得るために研究開発と製品イノベーションへの投資を重視しています。
グラフェン市場レポートハイライト
- 酸化グラフェンは、優れた熱伝導性、電気伝導性、透明性、透過性、強度などの優れた特性により、2023年には47.0%以上のシェアを占め、技術分野を支配しました。
- 還元型酸化グラフェン分野は予測期間中最も速いCAGRで成長する見込みです。
- 2023年には電子部品分野が最大の市場シェアを占める。複合材料用途は予測期間中に最速の成長が見込まれます。
- 自動車最終用途セグメントが2023年の市場を独占しました。この産業の成長は、新興国における可処分所得の上昇と中間所得層の購買力向上に起因しています。
- アジア太平洋地域は、多数のメーカーと消費者が存在するため、市場を独占しています。自動車、海洋、防衛、航空宇宙を含む様々な分野での生産量の増加が、予測期間中にこの地域の市場を牽引すると期待されています。
- 市場参入企業には、Nanoxplore Inc.、Telga Group、Directa Plus S.p.A、Graphene Laboratories, Inc.、GRAPHENE SQUARE INC.、ACS Material、Applied Graphene Materials、2D Carbon Graphene Material Co.Ltd.などです。
- 2023年3月、Directa Plus S.p.A.はColombo Industrie Tessiliとの提携を発表しました。両社はグラフェンをベースにした染色加工を施した革新的な新素材を製造しました。この新しい生地の主な特徴は、安定した温度と熱の分散を可能にする熱能力にあります。グラフェンプラスの染色技術により、軍や職場で求められる帯電防止特性や、抗菌・殺菌・抗ウイルス特性が生地に付与されます。
目次
第1章 調査手法と範囲
第2章 エグゼクティブサマリー
第3章 グラフェン市場の変数、動向、範囲
- 市場系統の見通し
- 関連市場の見通し
- 業界のバリューチェーン分析
- 原材料の動向
- 製造プロセス
- 販売チャネル分析
- 技術概要
- 規制の枠組み
- 用途別のフレークサイズと導電率の動向分析
- 市場力学
- 市場促進要因分析
- 市場抑制要因分析
- 業界の課題
- 業界の機会
- 業界分析ツール
- ポーターのファイブフォース分析
- PESTEL分析、 SWOT別
第4章 グラフェン市場: 製品推定・動向分析
- 製品変動分析と市場シェア、2023年と2030年
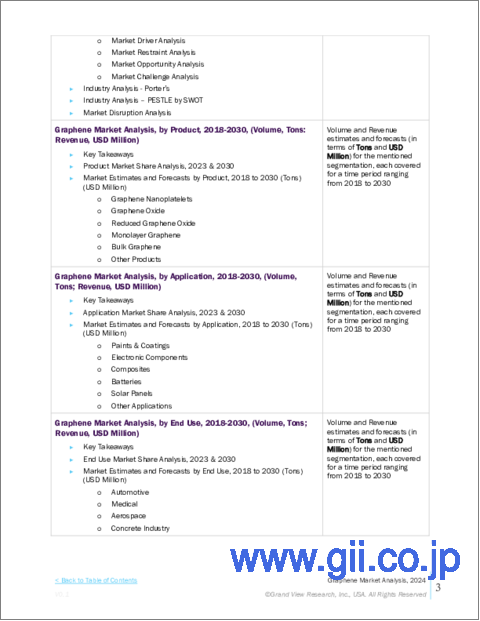
- 製品別、2018年から2030年まで
- グラフェンナノプレートレット
- 酸化グラフェン
- 還元酸化グラフェン
- 単層グラフェン
- バルクグラフェン
- その他
第5章 グラフェン市場: 用途の推定・動向分析
- 用途の変動分析と市場シェア、2023年と2030年
- 用途別、2018年から2030年まで
- 塗料とコーティング
- 電子部品
- 複合材料
- 電池
- ソーラーパネル
- その他
第6章 グラフェン市場: 最終用途の推定・動向分析
- 最終用途の変動分析と市場シェア、2023年と2030年
- 最終用途別、2018年から2030年まで
- 自動車
- 医学
- 航空宇宙
- 防衛
- コンクリート産業
- タイヤ
- その他
第7章 グラフェン市場:地域推定・動向分析
- 地域変動分析と市場シェア、2023年と2030年
- 北米
- 北米のグラフェン市場の推定・予測、2018年から2030年
- 米国
- カナダ
- メキシコ
- 欧州
- 欧州のグラフェン市場の推定・予測、2018年から2030年
- ドイツ
- 英国
- フランス
- イタリア
- スペイン
- アジア太平洋地域
- アジア太平洋地域のグラフェン市場の推定・予測、2018年から2030年
- 中国
- インド
- 日本
- 中南米
- 中南米グラフェン市場の推定・予測、2018年から2030年
- ブラジル
- 中東とアフリカ
- 中東およびアフリカのグラフェン市場の推定・予測、2018年から2030年
第8章 グラフェン市場-競合情勢
- 主要市場参入企業による最近の動向と影響分析
- 企業の分類
- 企業の市場シェア/地位分析、2023年
- 企業ヒートマップ分析
- 戦略マッピング
- 企業プロファイル
- Applied Graphene Materials
- 2D Carbon Graphene Material Co., Ltd.
- Thomas Swan &Co. Ltd
- Graphene Laboratories, Inc.
- Graphensic AB
- GRAPHENE SQUARE INC
- AMO GmbH
- Talga Group
- ACS Material
- BGT Materials Limited, Ltd.
- CVD Equipment Corporation
- Directa Plus SpA
- Grafoid Inc
- Graphenea
- NanoXplore Inc
- HAYDALE GRAPHENE INDUSTRIES PLC
- Zentek Ltd.
List of Tables
- Table 1 Graphene Market Estimates & Forecast, by Product, 2018 - 2030 (Tons)
- Table 2 Graphene Market Estimates & Forecast, by Product, 2018 - 2030 (USD Million)
- Table 3 Graphene Nanoplatelets Market Estimates & Forecast, By Application, 2018 - 2030 (Tons)
- Table 4 Graphene Nanoplatelets Market Estimates & Forecast, By Application, 2018 - 2030 (USD Million)
- Table 5 Graphene Oxide Market Estimates & Forecast, By Application, 2018 - 2030 (Tons)
- Table 6 Graphene Oxide Market Estimates & Forecast, By Application, 2018 - 2030 (USD Million)
- Table 7 Reduced Graphene Oxide Market Estimates & Forecast, By Application, 2018 - 2030 (Tons)
- Table 8 Reduced Graphene Oxide Market Estimates & Forecast, By Application, 2018 - 2030 (USD Million)
- Table 9 Monolayer Graphene Market Estimates & Forecast, By Application, 2018 - 2030 (Tons)
- Table 10 Monolayer Graphene Market Estimates & Forecast, By Application, 2018 - 2030 (USD Million)
- Table 11 Bulk Graphene Market Estimates & Forecast, By Application, 2018 - 2030 (Tons)
- Table 12 Bulk Graphene Market Estimates & Forecast, By Application, 2018 - 2030 (USD Million)
- Table 13 Other Graphene Products Market Estimates & Forecast, By Application, 2018 - 2030 (Tons)
- Table 14 Other Graphene Products Market Estimates & Forecast, By Application, 2018 - 2030 (USD Million)
- Table 15 Graphene Market Estimates & Forecast, By Application, 2018 - 2030 (Tons)
- Table 16 Graphene Market Estimates & Forecast, By Application, 2018 - 2030 (USD Million)
- Table 17 Graphene Market Estimates & Forecast, by End-Use, 2018 - 2030 (Tons)
- Table 18 Graphene Market Estimates & Forecast, by End-Use, 2018 - 2030 (USD Million)
- Table 19 Recent Developments & Impact Analysis, By Key Market Participants
- Table 20 Company Heat Map Analysis, 2022
List of Figures
- Fig. 1 Graphene Market Segmentation
- Fig. 2 Information Procurement
- Fig. 3 Data Analysis Models
- Fig. 4 Market Formulation And Validation
- Fig. 5 Data Validating & Publishing
- Fig. 6 Market Outlook
- Fig. 7 Segmental Outlook
- Fig. 8 Segmental Outlook
- Fig. 9 Competitive Outlook
- Fig. 10 Global Graphite Market, 2022 (USD Million)
- Fig. 11 Graphene Market: Value Chain Analysis
- Fig. 12 Global Mine Production of Graphite, 2021 (Thousand tons)
- Fig. 13 Market Dynamics
- Fig. 14 Market Driver Impact Analysis
- Fig. 15 Lithium-ion Battery Production Capacities (TWh)
- Fig. 16 Market Restraint Impact Analysis
- Fig. 17 Industry Analysis: Porter's
- Fig. 18 PESTEL Analysis, By SWOT
- Fig. 19 Product: Key Takeaways
- Fig. 20 Product: Market Share, 2022 & 2030
- Fig. 21 Graphene nanoplatelets market estimates & forecasts, 2018 - 2030 (Tons) (USD Million)
- Fig. 22 Graphene Oxide market estimates & forecasts, 2018 - 2030 (Tons) (USD Million)
- Fig. 23 Reduced graphene oxide market estimates & forecasts, 2018 - 2030 (Tons) (USD Million)
- Fig. 24 Monolayer graphene market estimates & forecasts, 2018 - 2030 (Tons) (USD Million)
- Fig. 25 Bulk graphene market estimates & forecasts, 2018 - 2030 (Tons) (USD Million)
- Fig. 26 Graphene market estimates & forecasts, by other products, 2018 - 2030 (Tons) (USD Million)
- Fig. 27 Application: Key Takeaways
- Fig. 28 Application: Market Share, 2022 & 2030
- Fig. 29 Graphene market estimates & forecasts for paints & coatings, 2018 - 2030 (Tons) (USD Million)
- Fig. 30 Graphene market estimates & forecasts for electronic components, 2018 - 2030 (Tons) (USD Million)
- Fig. 31 Graphene market estimates & forecasts for composites, 2018 - 2030 (Tons) (USD Million)
- Fig. 32 Graphene market estimates & forecasts for batteries, 2018 - 2030 (Tons) (USD Million)
- Fig. 33 Graphene market estimates & forecasts for solar panels, 2018 - 2030 (Tons) (USD Million)
- Fig. 34 Graphene market estimates & forecasts for other applications, 2018 - 2030 (Tons) (USD Million)
- Fig. 35 End-use: Key Takeaways
- Fig. 36 End-use: Market Share, 2022 & 2030
- Fig. 37 Graphene market estimates & forecasts for automotive, 2018 - 2030 (Tons) (USD Million)
- Fig. 38 Graphene market estimates & forecasts for medical, 2018 - 2030 (Tons) (USD Million)
- Fig. 39 Graphene market estimates & forecasts for aerospace, 2018 - 2030 (Tons) (USD Million)
- Fig. 40 Graphene market estimates & forecasts for defense, 2018 - 2030 (Tons) (USD Million)
- Fig. 41 Graphene market estimates & forecasts for concrete industry, 2018 - 2030 (Tons) (USD Billion)
- Fig. 42 Graphene market estimates & forecasts for tires, 2018 - 2030 (Tons) (USD Million)
- Fig. 43 Graphene market estimates & forecasts for other end uses, 2018 - 2030 (USD Million)
- Fig. 44 Graphene Market: Regional Outlook
- Fig. 45 Regional Marketplace: Key Takeaways
- Fig. 46 Regional Marketplace: Key Takeaways
- Fig. 47 North America graphene market estimates & forecasts, 2018 - 2030 (Tons) (USD Million)
- Fig. 48 U.S. graphene market estimates & forecasts, 2018 - 2030 (Tons) (USD Million)
- Fig. 49 Canada graphene market estimates & forecasts, 2018 - 2030 (Tons) (USD Million)
- Fig. 50 Mexico graphene market estimates & forecasts, 2018 - 2030 (Tons) (USD Million)
- Fig. 51 Europe graphene market estimates & forecasts, 2018 - 2030 (Tons) (USD Million)
- Fig. 52 UK graphene market estimates & forecasts, 2018 - 2030 (Tons) (USD Million)
- Fig. 53 Germany graphene market estimates & forecasts, 2018 - 2030 (Tons) (USD Million)
- Fig. 54 France graphene market estimates & forecasts, 2018 - 2030 (Tons) (USD Million)
- Fig. 55 Italy graphene market estimates & forecasts, 2018 - 2030 (Tons) (USD Million)
- Fig. 56 Spain graphene market estimates & forecasts, 2018 - 2030 (Tons) (USD Million)
- Fig. 57 Asia Pacific. graphene market estimates & forecasts, 2018 - 2030 (Tons) (USD Million)
- Fig. 58 China graphene market estimates & forecasts, 2018 - 2030 (Tons) (USD Million)
- Fig. 59 India graphene market estimates & forecasts, 2018 - 2030 (Tons) (USD Million)
- Fig. 60 Japan graphene market estimates & forecasts, 2018 - 2030 (Tons) (USD Million)
- Fig. 61 Central & South America graphene market estimates & forecasts, 2018 - 2030 (Tons) (USD Million)
- Fig. 62 Brazil graphene market estimates & forecasts, 2018 - 2030 (Tons) (USD Million)
- Fig. 63 Middle East & Africa graphene market estimates & forecasts, 2018 - 2030 (Tons) (USD Million)
- Fig. 64 Kraljic Matrix
- Fig. 65 Engagement Model
- Fig. 66 Sourcing Best Practices
- Fig. 67 Vendor Selection Criteria
- Fig. 68 Company/Competition Categorization
- Fig. 69 Company Market Position Analysis
- Fig. 70 Strategy Mapping, 2022
Graphene Market Growth & Trends:
The global graphene market is anticipated to reach USD 1.60 billion by 2030 and is anticipated to expand at a CAGR of 35.1% during the forecast period, according to a new report by Grand View Research, Inc. The increasing penetration of graphene in various end-use industries such as automotive, electronics, aerospace, construction, and medical is expected to boost the market's demand. In addition, rising demand from various multi-national companies and research institutions for research and development purposes is further expected to escalate market growth.
The ongoing research and development in graphene production is also expected to boost product utilization in various applications. For instance, the flash joule heating technique identified in 2020 showed promising results. Studies have demonstrated that the carbon-carbon bonds are reorganized into a graphene structure when significant amounts of electricity is passed through any carbon source. By using this method, any carbon-containing material, such as coal or even trash, can be converted into numerous pounds of high-quality graphene at a comparatively low cost.
Current manufacturing methods are capital-intensive as well as require high energy and resource costs. While current amounts of graphene available in market can meet demands of researchers, full commercialization market is still in early phases. The process of developing a novel material, its manufacturing, and application for a company involves many pounds of graphene powder and hundreds of graphene sheets, as well as a significant amount of time and work. This could pose a challenge for the manufacturers of graphene.
The market is governed by a complex regulation that encompasses safety, health, and environmental concerns. The manufacturing, handling, and application of graphene materials are heavily regulated by national and international regulatory authorities. These strict guidelines include potential health risks and environmental impact while ensuring the proper production and usage. Market participants are anticipated to benefit from compliance with these regulations by gaining a competitive edge over their competitors.
The market is highly dynamic and exhibits intense competition, owing to the presence of various small and medium-scale manufacturers. Key industry participants emphasize investments in research & development and product innovations in order to gain a competitive edge.
Graphene Market Report Highlights:
- Graphene oxide dominated the technology segment with more than 47.0% share in 2023 owing to its superior characteristics, including excellent thermal and electrical conductivity, transparency, permeability, and strength.
- Reduced graphene oxide segment is expected to grow at the fastest CAGR over the forecast period.
- Electronic component segment held the largest market share in 2023. Composite application is anticipated to witness fastest growth over the forecast period.
- The automotive end-use segment dominated the market in 2023. The growth of this industry can be attributed to the rising disposable income and increasing purchasing power of the middle-income population in emerging economies.
- Asia Pacific dominated the market owing to the presence of a large number of manufacturers and consumers. Increasing production volumes in various sectors including automobile, marine, defense, and aerospace are expected to drive the market in this region over the forecast period.
- Market players operating in market include Nanoxplore Inc.; Telga Group, Directa Plus S.p.A, Graphene Laboratories, Inc., GRAPHENE SQUARE INC, and ACS Material, Applied Graphene Materials, 2D Carbon Graphene Material Co., Ltd., Thomas Swan & Co. Ltd.
- In March 2023, Directa Plus S.p.A. announced the partnership with Colombo Industrie Tessili. Both companies produced a new innovative fabric, obtained using a graphene-based dyeing treatment. The key characteristic of this new fabric is its thermal capability, which allows for consistent temperatures and heat dispersion. The dyeing technique of Graphene Plus on the fabric imparts antistatic properties required by the military and workplace, as well as antimicrobial, antibacterial, and antiviral properties to the cloth.
Table of Contents
Chapter 1. Methodology and Scope
- 1.1. Market Segmentation & Scope
- 1.2. Market Definition
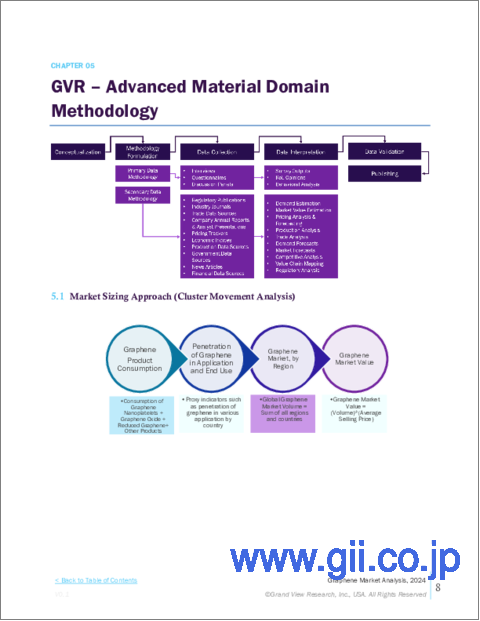
- 1.3. Information Procurement
- 1.3.1. Purchased Database
- 1.3.2. GVR's Internal Database
- 1.3.3. Secondary Sources & Third-Party Perspectives
- 1.3.4. Primary Research
- 1.4. Information Analysis
- 1.4.1. Data Analysis Models
- 1.5. Market Formulation & Data Visualization
- 1.6. Data Validation & Publishing
Chapter 2. Executive Summary
- 2.1. Market Snapshot
- 2.2. Segment Snapshot
- 2.3. Competitive Landscape Snapshot
Chapter 3. Graphene Market Variables, Trends & Scope
- 3.1. Market Lineage Outlook
- 3.1.1. Related Market Outlook
- 3.2. Industry Value Chain Analysis
- 3.2.1. Raw Material Trends
- 3.2.2. Manufacturing Process
- 3.2.3. Sales Channel Analysis
- 3.3. Technological Overview
- 3.4. Regulatory Framework
- 3.5. Flake Size and Conductivity Trend Analysis, by Application
- 3.6. Market Dynamics
- 3.6.1. Market Driver Analysis
- 3.6.2. Market Restraint Analysis
- 3.6.3. Industry Challenges
- 3.6.4. Industry Opportunities
- 3.7. Industry Analysis Tools
- 3.7.1. Porter's Five Forces Analysis
- 3.7.2. PESTEL Analysis, By SWOT
Chapter 4. Graphene Market: Product Estimates & Trend Analysis
- 4.1. Product Movement Analysis & Market Share, 2023 & 2030
- 4.2. Graphene Market Estimates & Forecast, By Product, 2018 to 2030 (Tons) (USD Million)
- 4.3. Graphene Nanoplatelets
- 4.3.1. Graphene Nanoplatelets Market Revenue Estimates and Forecasts, 2018 - 2030 (Tons) (USD Million)
- 4.4. Graphene Oxide
- 4.4.1. Graphene Oxide Market Revenue Estimates and Forecasts, 2018 - 2030 (Tons) (USD Million)
- 4.5. Reduced Graphene Oxide
- 4.5.1. Reduced Graphene Oxide Market Revenue Estimates and Forecasts, 2018 - 2030 (Tons) (USD Million)
- 4.6. Monolayer Graphene
- 4.6.1. Monolayer Graphene Market Revenue Estimates and Forecasts, 2018 - 2030 (Tons) (USD Million)
- 4.7. Bulk Graphene
- 4.7.1. Bulk Graphene Market Revenue Estimates and Forecasts, 2018 - 2030 (Tons) (USD Million)
- 4.8. Others
- 4.8.1. Others Market Revenue Estimates and Forecasts, 2018 - 2030 (Tons) (USD Million)
Chapter 5. Graphene Market: Application Estimates & Trend Analysis
- 5.1. Application Movement Analysis & Market Share, 2023 & 2030
- 5.2. Graphene Market Estimates & Forecast, By Application, 2018 to 2030 (Tons) (USD Million)
- 5.3. Paints & Coatings
- 5.3.1. Graphene Market Revenue Estimates and Forecasts, by paints & coatings, 2018 - 2030 (Tons) (USD Million)
- 5.4. Electronic Components
- 5.4.1. Graphene Market Revenue Estimates and Forecasts, by Electronic Components, 2018 - 2030 (Tons) (USD Million)
- 5.5. Composites
- 5.5.1. Graphene Market Revenue Estimates and Forecasts, by Composites, 2018 - 2030 (Tons) (USD Million)
- 5.6. Batteries
- 5.6.1. Graphene Market Revenue Estimates and Forecasts, by Batteries, 2018 - 2030 (Tons) (USD Million)
- 5.7. Solar Panels
- 5.7.1. Graphene Market Revenue Estimates and Forecasts, by Solar Panels, 2018 - 2030 (Tons) (USD Million)
- 5.8. Others
- 5.8.1. Graphene Market Revenue Estimates and Forecasts, by Others, 2018 - 2030 (Tons) (USD Million)
Chapter 6. Graphene Market: End-use Estimates & Trend Analysis
- 6.1. End-use Movement Analysis & Market Share, 2023 & 2030
- 6.2. Graphene Market Estimates & Forecast, By End-use, 2018 to 2030 (Tons) (USD Million)
- 6.3. Automotive
- 6.3.1. Graphene Market Revenue Estimates and Forecasts, by Automotive, 2018 - 2030 (Tons) (USD Million)
- 6.4. Medical
- 6.4.1. Graphene Market Revenue Estimates and Forecasts, by Medical, 2018 - 2030 (Tons) (USD Million)
- 6.5. Aerospace
- 6.5.1. Graphene Market Revenue Estimates and Forecasts, by Aerospace, 2018 - 2030 (Tons) (USD Million)
- 6.6. Defense
- 6.6.1. Graphene Market Revenue Estimates and Forecasts, by Defense, 2018 - 2030 (Tons) (USD Million)
- 6.7. Concrete Industry
- 6.7.1. Graphene Market Revenue Estimates and Forecasts, by Concrete Industry, 2018 - 2030 (Tons) (USD Million)
- 6.8. Tires
- 6.8.1. Graphene Market Revenue Estimates and Forecasts, by Tires, 2018 - 2030 (Tons) (USD Million)
- 6.9. Others
- 6.9.1. Graphene Market Revenue Estimates and Forecasts, by Others, 2018 - 2030 (Tons) (USD Million)
Chapter 7. Graphene Market: Regional Estimates & Trend Analysis
- 7.1. Regional Movement Analysis & Market Share, 2023 & 2030
- 7.2. North America
- 7.2.1. North America Graphene Market Estimates & Forecast, 2018 - 2030 (Kilo Tons) (USD Million)
- 7.2.2. U.S.
- 7.2.2.1. U.S. Graphene market estimates & forecast, 2018 - 2030 (Tons) (USD Million)
- 7.2.3. Canada
- 7.2.3.1. Canada Graphene market estimates & forecast, 2018 - 2030 (Tons) (USD Million)
- 7.2.4. Mexico
- 7.2.4.1. Mexico Graphene market estimates & forecast, 2018 - 2030 (Tons) (USD Million)
- 7.3. Europe
- 7.3.1. Europe Graphene Market Estimates & Forecast, 2018 - 2030 (Kilo Tons) (USD Million)
- 7.3.2. Germany
- 7.3.2.1. Germany Graphene market estimates & forecast, 2018 - 2030 (Tons) (USD Million)
- 7.3.3. UK
- 7.3.3.1. UK Graphene market estimates & forecast, 2018 - 2030 (Tons) (USD Million)
- 7.3.4. France
- 7.3.4.1. France Graphene market estimates & forecast, 2018 - 2030 (Tons) (USD Million)
- 7.3.5. Italy
- 7.3.5.1. Italy Graphene market estimates & forecast, 2018 - 2030 (Tons) (USD Million)
- 7.3.6. Spain
- 7.3.6.1. Spain Graphene market estimates & forecast, 2018 - 2030 (Tons) (USD Million)
- 7.4. Asia Pacific
- 7.4.1. Asia Pacific Graphene Market Estimates & Forecast, 2018 - 2030 (Kilo Tons) (USD Million)
- 7.4.2. China
- 7.4.2.1. China Graphene market estimates & forecast, 2018 - 2030 (Tons) (USD Million)
- 7.4.3. India
- 7.4.3.1. India Graphene market estimates & forecast, 2018 - 2030 (Tons) (USD Million)
- 7.4.4. Japan
- 7.4.4.1. Japan Graphene market estimates & forecast, 2018 - 2030 (Tons) (USD Million)
- 7.5. Central & South America
- 7.5.1. Central & South America Graphene Market Estimates & Forecast, 2018 - 2030 (Tons) (USD Million)
- 7.5.2. Brazil
- 7.5.2.1. Brazil Graphene market estimates & forecast, 2018 - 2030 (Tons) (USD Million)
- 7.6. Middle East & Africa
- 7.6.1. Middle East & Africa Graphene Market Estimates & Forecast, 2018 - 2030 (Tons) (USD Million)
Chapter 8. Graphene Market - Competitive Landscape
- 8.1. Recent Developments & Impact Analysis, By Key Market Participants
- 8.2. Company Categorization
- 8.3. Company Market Share/Position Analysis, 2023
- 8.4. Company Heat Map Analysis
- 8.5. Strategy Mapping
- 8.6. Company Profiles
- 8.6.1. Applied Graphene Materials
- 8.6.1.1. Participant's overview
- 8.6.1.2. Financial performance
- 8.6.1.3. Product benchmarking
- 8.6.1.4. Recent developments
- 8.6.2. 2D Carbon Graphene Material Co., Ltd.
- 8.6.2.1. Participant's overview
- 8.6.2.2. Financial performance
- 8.6.2.3. Product benchmarking
- 8.6.2.4. Recent developments
- 8.6.3. Thomas Swan & Co. Ltd
- 8.6.3.1. Participant's overview
- 8.6.3.2. Financial performance
- 8.6.3.3. Product benchmarking
- 8.6.3.4. Recent developments
- 8.6.4. Graphene Laboratories, Inc.
- 8.6.4.1. Participant's overview
- 8.6.4.2. Financial performance
- 8.6.4.3. Product benchmarking
- 8.6.4.4. Recent developments
- 8.6.5. Graphensic AB
- 8.6.5.1. Participant's overview
- 8.6.5.2. Financial performance
- 8.6.5.3. Product benchmarking
- 8.6.5.4. Recent developments
- 8.6.6. GRAPHENE SQUARE INC
- 8.6.6.1. Participant's overview
- 8.6.6.2. Financial performance
- 8.6.6.3. Product benchmarking
- 8.6.6.4. Recent developments
- 8.6.7. AMO GmbH
- 8.6.7.1. Participant's overview
- 8.6.7.2. Financial performance
- 8.6.7.3. Product benchmarking
- 8.6.7.4. Recent developments
- 8.6.8. Talga Group
- 8.6.8.1. Participant's overview
- 8.6.8.2. Financial performance
- 8.6.8.3. Product benchmarking
- 8.6.8.4. Recent developments
- 8.6.9. ACS Material
- 8.6.9.1. Participant's overview
- 8.6.9.2. Financial performance
- 8.6.9.3. Product benchmarking
- 8.6.9.4. Recent developments
- 8.6.10. BGT Materials Limited, Ltd.
- 8.6.10.1. Participant's overview
- 8.6.10.2. Financial performance
- 8.6.10.3. Product benchmarking
- 8.6.10.4. Recent developments
- 8.6.11. CVD Equipment Corporation
- 8.6.11.1. Participant's overview
- 8.6.11.2. Financial performance
- 8.6.11.3. Product benchmarking
- 8.6.11.4. Recent developments
- 8.6.12. Directa Plus S.p.A
- 8.6.12.1. Participant's overview
- 8.6.12.2. Financial performance
- 8.6.12.3. Product benchmarking
- 8.6.12.4. Recent developments
- 8.6.13. Grafoid Inc
- 8.6.13.1. Participant's overview
- 8.6.13.2. Financial performance
- 8.6.13.3. Product benchmarking
- 8.6.13.4. Recent developments
- 8.6.14. Graphenea
- 8.6.14.1. Participant's overview
- 8.6.14.2. Financial performance
- 8.6.14.3. Product benchmarking
- 8.6.14.4. Recent developments
- 8.6.15. NanoXplore Inc
- 8.6.15.1. Participant's overview
- 8.6.15.2. Financial performance
- 8.6.15.3. Product benchmarking
- 8.6.15.4. Recent developments
- 8.6.16. HAYDALE GRAPHENE INDUSTRIES PLC
- 8.6.16.1. Participant's overview
- 8.6.16.2. Financial performance
- 8.6.16.3. Product benchmarking
- 8.6.16.4. Recent developments
- 8.6.17. Zentek Ltd.
- 8.6.17.1. Participant's overview
- 8.6.17.2. Financial performance
- 8.6.17.3. Product benchmarking
- 8.6.17.4. Recent developments
- 8.6.1. Applied Graphene Materials
