|
|
市場調査レポート
商品コード
1405004
ヘッドセットの市場規模、シェア、動向分析レポート:タイプ別、価格帯別、接続性別、用途別、地域別、セグメント予測、2023年~2030年Headset Market Size, Share & Trends Analysis Report By Type (In-ear, Over-ear), By Price Band, By Connectivity (Wired, Wireless), By Application (Personal, Commercial), By Region, And Segment Forecasts, 2023 - 2030 |
||||||
|
|
|||||||
カスタマイズ可能
|
|||||||

| ヘッドセットの市場規模、シェア、動向分析レポート:タイプ別、価格帯別、接続性別、用途別、地域別、セグメント予測、2023年~2030年 |
|
出版日: 2023年11月22日
発行: Grand View Research
ページ情報: 英文 206 Pages
納期: 2~10営業日
|

全表示
- 概要
- 図表
- 目次
ヘッドセット市場の成長と動向:
Grand View Research, Inc.の最新レポートによると、世界のヘッドセット市場規模は2030年までに5,588億9,000万米ドルに達し、予測期間中のCAGRは31.2%を記録すると予測されています。
ヘッドセット市場は、スマートフォンやスマートテレビなどの先進的な製品によって牽引されています。その性質上、継続的に進化しています。より高い忠実度とスタイルを求める消費者需要の増加は、市場成長に好影響を与えると予測されます。さらに、革新的なスポーツ・フィットネス用ウェアラブル機器のイントロダクションより、フィットネスやスポーツ愛好家のウェアラブル技術への関心が高まっています。多くのOEMが、フィットネス・トラッキングやモニタリングなどの画期的な機能をヘッドセットで提供しています。
2021年にCOVID-19が発生し、リモートワークやハイブリッドワークの文化がヘッドセットの需要に拍車をかけた。教育、ヘルスケア、政府を含むいくつかの産業で新しい使用シナリオが展開され、パンデミックは「どこからでも働ける」またはハイブリッド/フレキシブルワークへのパラダイムシフトを強化し、ヘッドセット市場に長期的な機会を創出しました。パンデミックの中でヘッドセットの需要は高まっているが、サプライチェーンの混乱により市場全体は依然としてマイナスの影響を受けています。
ワークアウト中のヘッドセット採用の増加は、予測期間中の世界市場の成長を促進すると予想されます。その上、メーカーはヘッドセットでフィットネスモニタリング&トラッキングなどの革新的な機能を提供することで、フィットネス意識の高い顧客をターゲットにしています。例えば、Intelが提供するBioSport Audioインイヤーヘッドフォンは、特別な充電器やバッテリーを必要としない健康モニタリング機能を提供します。BioSportは、内蔵センサーと独自のソフトウェアに依存し、歩数計、心臓モニター、その他の生体指標として動作します。また、ヘッドセット・ソフトウェアは、ユーザーがモバイル・アプリケーションを介してフィットネス活動を計画、監視、実行できるように設計されています。
大多数の顧客は、ファッショナブルでトレンディな外観の製品を求めています。将来、ヘッドセットが成功するかどうかは、技術だけでなく、顧客の価値観に合い、個性を促進する外観とデザインにかかっています。トレンディな製品は、低価格帯、中価格帯、高価格帯を含む既存の3つのセグメントすべてに浸透することができます。ファッショナブルなデザインへのニーズの結果、ワイヤレスヘッドセットの人気はますます高まっています。
ヘッドセット市場レポートハイライト
- 業務用アプリケーション分野、特に企業やコールセンターでのより良い通信に対する需要の高まりが、業界の成長に大きく寄与すると思われます。業務用ヘッドセット市場は2023年から2030年にかけて大きな成長が見込まれます。
- 2022年には、有線セグメントが市場全体の51.7%を占めました。しかし、使い勝手の良さからワイヤレス機器への嗜好が高まっており、ワイヤレス技術分野の成長に拍車がかかると予想されます。
- インイヤーヘッドセット市場は、予測期間中に最も速いCAGR 32.1%で牽引し、成長すると予想されます。小型化、携帯性、快適性の向上は、インイヤーヘッドセットが提供する主な利点です。
- 最近の技術的進歩により、オンイヤーヘッドフォンはより一般的になり、品質も向上しています。また、米国のイヤホン・ヘッドホン市場では、オンイヤーヘッドホンをポートフォリオに加えるベンダーが増えています。
- 米国、カナダ、メキシコは世界のヘッドホン市場で最大のシェアを維持しています。同市場の最も重要な成長要因としては、高所得者層、新技術、継続的な技術革新が挙げられます。収益と予測では、北米が世界市場を独占しており、予測期間を通じてこの支配を維持すると予測されています。
目次
第1章 調査手法と範囲
第2章 エグゼクティブサマリー
第3章 ヘッドセット市場の変数、動向、範囲
- 市場系統の見通し
- 業界のバリューチェーン分析
- 市場力学
- 市場促進要因分析
- 市場抑制要因分析
- 市場機会分析
- ヘッドセット市場分析ツール
- 業界分析- ポーターのファイブフォース分析
- PESTEL分析
第4章 ヘッドセット:タイプの推定・動向分析
- ヘッドセット市場:主要ポイント
- ヘッドセット市場:動向と市場シェア分析、2022年と2030年
- インイヤー
- インイヤー市場推計・予測、2018年~2030年
- オーバーイヤー
- オーバーイヤー市場推計・予測、2018年~2030年
第5章 ヘッドセット:価格帯の推定・動向分析
- ヘッドセット市場:主要ポイント
- ヘッドセット市場:動向と市場シェア分析、2022年と2030年
- 50米ドル以下
- 50米ドル以下の市場推計・予測、2018年~2030年
- 51~150米ドル
- 51~150米ドルの市場推計・予測、2018年~2030年
- 151~350米ドル
- 151~350米ドルの市場推計・予測、2018年~2030年
- 351米ドル以上
- 351米ドル以上の市場推計・予測、2018年~2030年
第6章 ヘッドセット:接続性推定・動向分析
- ヘッドセット市場:主要ポイント
- ヘッドセット市場:動向と市場シェア分析、2022年と2030年
- 有線
- 有線市場推計・予測、2018年~2030年
- ワイヤレス
- ワイヤレス市場推計・予測、2018年~2030年
第7章 ヘッドセット:用途の推定・動向分析
- ヘッドセット市場:主要ポイント
- ヘッドセット市場:動向と市場シェア分析、2022年と2030年
- 個人
- 個人市場推計・予測、2018年~2030年
- 商業
- 商業市場推計・予測、2018年~2030年
第8章 ヘッドセット市場:地域推定・動向分析
- 地域別の見通し
- 地域別のヘッドセット市場:主要ポイント
- 北米
- 市場推計・予測、2018年~2030年
- 米国
- カナダ
- 欧州
- 英国
- ドイツ
- フランス
- アジア太平洋
- 日本
- 中国
- インド
- オーストラリア
- 韓国
- ラテンアメリカ
- ブラジル
- メキシコ
- 中東・アフリカ
- サウジアラビア
- 南アフリカ
- アラブ首長国連邦
第9章 競合情勢
- 主要市場参入企業による最近の動向と影響分析
- 市場参入企業の分類
- Alclair / Matrics Inc.
- Apple, Inc.
- Bose Corporation
- Grado Labs.
- HARMAN International.
- JVCKENWOOD Corporation
- Koninklijke Philips N.V.,
- Logitech.
- Panasonic Holdings Corporation
- Plantronics, Inc.
- Pioneer Corporation.
- Sennheiser electronic GmbH & Co. KG
- SHENZHEN CANNICE TECHNOLOGY CO.,LTD.
- Shure Incorporated.
- Skullcandy.eu
- Sony Corporation
- ULTIMATE EARS.
- Zebronics India Pvt. Ltd.
List of Tables
- Table 1 List of abbreviation
- Table 2 North America headset market, by type, 2018 - 2030 (USD Million)
- Table 3 North America headset market, by type, 2018 - 2030 (Million Units)
- Table 4 North America headset market, by price band, 2018 - 2030 (USD Million)
- Table 5 North America headset market, by price band, 2018 - 2030 (Million Units)
- Table 6 North America headset market, by connectivity, 2018 - 2030 (USD Million)
- Table 7 North America headset market, by connectivity, 2018 - 2030 (Million Units)
- Table 8 North America headset market, by application, 2018 - 2030 (USD Million)
- Table 9 North America headset market, by application, 2018 - 2030 (Million Units)
- Table 10 North America headset market, by region, (USD Million) 2018 to 2030
- Table 11 North America headset market, by region, (Million Units) 2018 to 2030
- Table 12 U.S. headset market, by type, 2018 - 2030 (USD Million)
- Table 13 U.S. headset market, by type, 2018 - 2030 (Million Units)
- Table 14 U.S. headset market, by price band, 2018 - 2030 (USD Million)
- Table 15 U.S. headset market, by price band, 2018 - 2030 (Million Units)
- Table 16 U.S. headset market, by connectivity, 2018 - 2030 (USD Million)
- Table 17 U.S. headset market, by connectivity, 2018 - 2030 (Million Units)
- Table 18 U.S. headset market, by application, 2018 - 2030 (USD Million)
- Table 19 U.S. headset market, by application, 2018 - 2030 (Million Units)
- Table 20 Canada headset market, by type, 2018 - 2030 (USD Million)
- Table 21 Canada headset market, by type, 2018 - 2030 (Million Units)
- Table 22 Canada headset market, by price band, 2018 - 2030 (USD Million)
- Table 23 Canada headset market, by price band, 2018 - 2030 (Million Units)
- Table 24 Canada headset market, by connectivity, 2018 - 2030 (USD Million)
- Table 25 Canada headset market, by connectivity, 2018 - 2030 (Million Units)
- Table 26 Canada headset market, by application, 2018 - 2030 (USD Million)
- Table 27 Canada headset market, by application, 2018 - 2030 (Million Units)
- Table 28 Europe headset market, by type, 2018 - 2030 (USD Million)
- Table 29 Europe headset market, by type, 2018 - 2030 (Million Units)
- Table 30 Europe headset market, by price band, 2018 - 2030 (USD Million)
- Table 31 Europe headset market, by price band, 2018 - 2030 (Million Units)
- Table 32 Europe headset market, by connectivity, 2018 - 2030 (USD Million)
- Table 33 Europe headset market, by connectivity, 2018 - 2030 (Million Units)
- Table 34 Europe headset market, by application, 2018 - 2030 (USD Million)
- Table 35 Europe headset market, by application, 2018 - 2030 (Million Units)
- Table 36 Europe headset market, by region, (USD Million) 2018 to 2030
- Table 37 Europe headset market, by region, (Million Units) 2018 to 2030
- Table 38 Germany headset market, by type, 2018 - 2030 (USD Million)
- Table 39 Germany headset market, by type, 2018 - 2030 (Million Units)
- Table 40 Germany headset market, by price band, 2018 - 2030 (USD Million)
- Table 41 Germany headset market, by price band, 2018 - 2030 (Million Units)
- Table 42 Germany headset market, by connectivity, 2018 - 2030 (USD Million)
- Table 43 Germany headset market, by connectivity, 2018 - 2030 (Million Units)
- Table 44 Germany headset market, by application, 2018 - 2030 (USD Million)
- Table 45 Germany headset market, by application, 2018 - 2030 (Million Units)
- Table 46 UK headset market, by type, 2018 - 2030 (USD Million)
- Table 47 UK headset market, by type, 2018 - 2030 (Million Units)
- Table 48 UK headset market, by price band, 2018 - 2030 (USD Million)
- Table 49 UK headset market, by price band, 2018 - 2030 (Million Units)
- Table 50 UK headset market, by connectivity, 2018 - 2030 (USD Million)
- Table 51 UK headset market, by connectivity, 2018 - 2030 (Million Units)
- Table 52 UK headset market, by application, 2018 - 2030 (USD Million)
- Table 53 UK headset market, by application, 2018 - 2030 (Million Units)
- Table 54 France headset market, by type, 2018 - 2030 (USD Million)
- Table 55 France headset market, by type, 2018 - 2030 (Million Units)
- Table 56 France headset market, by price band, 2018 - 2030 (USD Million)
- Table 57 France headset market, by price band, 2018 - 2030 (Million Units)
- Table 58 France headset market, by connectivity, 2018 - 2030 (USD Million)
- Table 59 France headset market, by connectivity, 2018 - 2030 (Million Units)
- Table 60 France headset market, by application, 2018 - 2030 (USD Million)
- Table 61 France headset market, by application, 2018 - 2030 (Million Units)
- Table 62 Asia Pacific headset market, by type, 2018 - 2030 (USD Million)
- Table 63 Asia Pacific headset market, by type, 2018 - 2030 (Million Units)
- Table 64 Asia Pacific headset market, by price band, 2018 - 2030 (USD Million)
- Table 65 Asia Pacific headset market, by price band, 2018 - 2030 (Million Units)
- Table 66 Asia Pacific headset market, by connectivity, 2018 - 2030 (USD Million)
- Table 67 Asia Pacific headset market, by connectivity, 2018 - 2030 (Million Units)
- Table 68 Asia Pacific headset market, by application, 2018 - 2030 (USD Million)
- Table 69 Asia Pacific headset market, by application, 2018 - 2030 (Million Units)
- Table 70 Asia Pacific headset market, by region, (USD Million) 2018 to 2030
- Table 71 Asia Pacific headset market, by region, (Million Units) 2018 to 2030
- Table 72 China headset market, by type, 2018 - 2030 (USD Million)
- Table 73 China headset market, by type, 2018 - 2030 (Million Units)
- Table 74 China headset market, by price band, 2018 - 2030 (USD Million)
- Table 75 China headset market, by price band, 2018 - 2030 (Million Units)
- Table 76 China headset market, by connectivity, 2018 - 2030 (USD Million)
- Table 77 China headset market, by connectivity, 2018 - 2030 (Million Units)
- Table 78 China headset market, by application, 2018 - 2030 (USD Million)
- Table 79 China headset market, by application, 2018 - 2030 (Million Units)
- Table 80 Japan headset market, by type, 2018 - 2030 (USD Million)
- Table 81 Japan headset market, by type, 2018 - 2030 (Million Units)
- Table 82 Japan headset market, by price band, 2018 - 2030 (USD Million)
- Table 83 Japan headset market, by price band, 2018 - 2030 (Million Units)
- Table 84 Japan headset market, by connectivity, 2018 - 2030 (USD Million)
- Table 85 Japan headset market, by connectivity, 2018 - 2030 (Million Units)
- Table 86 Japan headset market, by application, 2018 - 2030 (USD Million)
- Table 87 Japan headset market, by application, 2018 - 2030 (Million Units)
- Table 88 India headset market, by type, 2018 - 2030 (USD Million)
- Table 89 India headset market, by type, 2018 - 2030 (Million Units)
- Table 90 India headset market, by price band, 2018 - 2030 (USD Million)
- Table 91 India headset market, by price band, 2018 - 2030 (Million Units)
- Table 92 India headset market, by connectivity, 2018 - 2030 (USD Million)
- Table 93 India headset market, by connectivity, 2018 - 2030 (Million Units)
- Table 94 India headset market, by application, 2018 - 2030 (USD Million)
- Table 95 India headset market, by application, 2018 - 2030 (Million Units)
- Table 96 Australia headset market, by type, 2018 - 2030 (USD Million)
- Table 97 Australia headset market, by type, 2018 - 2030 (Million Units)
- Table 98 Australia headset market, by price band, 2018 - 2030 (USD Million)
- Table 99 Australia headset market, by price band, 2018 - 2030 (Million Units)
- Table 100 Australia headset market, by connectivity, 2018 - 2030 (USD Million)
- Table 101 Australia headset market, by connectivity, 2018 - 2030 (Million Units)
- Table 102 Australia headset market, by application, 2018 - 2030 (USD Million)
- Table 103 Australia headset market, by application, 2018 - 2030 (Million Units)
- Table 104 South Korea headset market, by type, 2018 - 2030 (USD Million)
- Table 105 South Korea headset market, by type, 2018 - 2030 (Million Units)
- Table 106 South Korea headset market, by price band, 2018 - 2030 (USD Million)
- Table 107 South Korea headset market, by price band, 2018 - 2030 (Million Units)
- Table 108 South Korea headset market, by connectivity, 2018 - 2030 (USD Million)
- Table 109 South Korea headset market, by connectivity, 2018 - 2030 (Million Units)
- Table 110 South Korea headset market, by application, 2018 - 2030 (USD Million)
- Table 111 South Korea headset market, by application, 2018 - 2030 (Million Units)
- Table 112 Latin America headset market, by type, 2018 - 2030 (USD Million)
- Table 113 Latin America headset market, by type, 2018 - 2030 (Million Units)
- Table 114 Latin America headset market, by price band, 2018 - 2030 (USD Million)
- Table 115 Latin America headset market, by price band, 2018 - 2030 (Million Units)
- Table 116 Latin America headset market, by connectivity, 2018 - 2030 (USD Million)
- Table 117 Latin America headset market, by connectivity, 2018 - 2030 (Million Units)
- Table 118 Latin America headset market, by application, 2018 - 2030 (USD Million)
- Table 119 Latin America headset market, by application, 2018 - 2030 (Million Units)
- Table 120 Latin America headset market, by region, (USD Million) 2018 to 2030
- Table 121 Latin America headset market, by region, (Million Units) 2018 to 2030
- Table 122 Brazil headset market, by type, 2018 - 2030 (USD Million)
- Table 123 Brazil headset market, by type, 2018 - 2030 (Million Units)
- Table 124 Brazil headset market, by price band, 2018 - 2030 (USD Million)
- Table 125 Brazil headset market, by price band, 2018 - 2030 (Million Units)
- Table 126 Brazil headset market, by connectivity, 2018 - 2030 (USD Million)
- Table 127 Brazil headset market, by connectivity, 2018 - 2030 (Million Units)
- Table 128 Brazil headset market, by application, 2018 - 2030 (USD Million)
- Table 129 Brazil headset market, by application, 2018 - 2030 (Million Units)
- Table 130 Mexico headset market, by type, 2018 - 2030 (USD Million)
- Table 131 Mexico headset market, by type, 2018 - 2030 (Million Units)
- Table 132 Mexico headset market, by price band, 2018 - 2030 (USD Million)
- Table 133 Mexico headset market, by price band, 2018 - 2030 (Million Units)
- Table 134 Mexico headset market, by connectivity, 2018 - 2030 (USD Million)
- Table 135 Mexico headset market, by connectivity, 2018 - 2030 (Million Units)
- Table 136 Mexico headset market, by application, 2018 - 2030 (USD Million)
- Table 137 Mexico headset market, by application, 2018 - 2030 (Million Units)
- Table 138 Middle East and Africa headset market, by type, 2018 - 2030 (USD Million)
- Table 139 Middle East and Africa headset market, by type, 2018 - 2030 (Million Units)
- Table 140 Middle East and Africa headset market, by price band, 2018 - 2030 (USD Million)
- Table 141 Middle East and Africa headset market, by price band, 2018 - 2030 (Million Units)
- Table 142 Middle East and Africa headset market, by connectivity, 2018 - 2030 (USD Million)
- Table 143 Middle East and Africa headset market, by connectivity, 2018 - 2030 (Million Units)
- Table 144 Middle East and Africa headset market, by application, 2018 - 2030 (USD Million)
- Table 145 Middle East and Africa headset market, by application, 2018 - 2030 (Million Units)
- Table 146 Middle East and Africa headset market, by region, (USD Million) 2018 to 2030
- Table 147 Middle East and Africa headset market, by region, (Million Units) 2018 to 2030
- Table 148 South Africa headset market, by type, 2018 - 2030 (USD Million)
- Table 149 South Africa headset market, by type, 2018 - 2030 (Million Units)
- Table 150 South Africa headset market, by price band, 2018 - 2030 (USD Million)
- Table 151 South Africa headset market, by price band, 2018 - 2030 (Million Units)
- Table 152 South Africa headset market, by connectivity, 2018 - 2030 (USD Million)
- Table 153 South Africa headset market, by connectivity, 2018 - 2030 (Million Units)
- Table 154 South Africa headset market, by application, 2018 - 2030 (USD Million)
- Table 155 South Africa headset market, by application, 2018 - 2030 (Million Units)
- Table 156 Saudi Arabia headset market, by type, 2018 - 2030 (USD Million)
- Table 157 Saudi Arabia headset market, by type, 2018 - 2030 (Million Units)
- Table 158 Saudi Arabia headset market, by price band, 2018 - 2030 (USD Million)
- Table 159 Saudi Arabia headset market, by price band, 2018 - 2030 (Million Units)
- Table 160 Saudi Arabia headset market, by connectivity, 2018 - 2030 (USD Million)
- Table 161 Saudi Arabia headset market, by connectivity, 2018 - 2030 (Million Units)
- Table 162 Saudi Arabia headset market, by application, 2018 - 2030 (USD Million)
- Table 163 Saudi Arabia headset market, by application, 2018 - 2030 (Million Units)
- Table 164 UAE headset market, by type, 2018 - 2030 (USD Million)
- Table 165 UAE headset market, by type, 2018 - 2030 (Million Units)
- Table 166 UAE headset market, by price band, 2018 - 2030 (USD Million)
- Table 167 UAE headset market, by price band, 2018 - 2030 (Million Units)
- Table 168 UAE headset market, by connectivity, 2018 - 2030 (USD Million)
- Table 169 UAE headset market, by connectivity, 2018 - 2030 (Million Units)
- Table 170 UAE headset market, by application, 2018 - 2030 (USD Million)
- Table 171 UAE headset market, by application, 2018 - 2030 (Million Units)
List of Figures
- Fig. 1 Market research process
- Fig. 2 Data triangulation techniques
- Fig. 3 Primary research pattern
- Fig. 4 Market research approaches
- Fig. 5 Value-chain-based sizing & forecasting
- Fig. 6 QFD modeling for market share assessment
- Fig. 7 Market formulation & validation
- Fig. 8 Headset: Market outlook
- Fig. 9 Headset: Competitive insights
- Fig. 10 Parent market outlook
- Fig. 11 Related/ancillary market outlook
- Fig. 12 Penetration and growth prospect mapping
- Fig. 13 Industry value chain analysis
- Fig. 14 Headset market driver impact
- Fig. 15 Headset market restraint impact
- Fig. 16 Headset market strategic initiatives analysis
- Fig. 17 Headset market: Type movement analysis
- Fig. 18 Headset market: Type outlook and key takeaways
- Fig. 19 In-ear market estimates and forecasts, 2018 - 2030
- Fig. 20 Over-ear market estimates and forecasts, 2018 - 2030
- Fig. 21 Headset market: Price band movement analysis
- Fig. 22 Headset market: Price band outlook and key takeaways
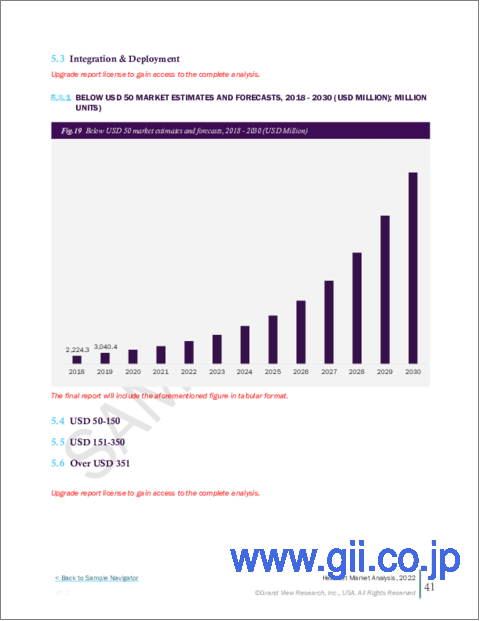
- Fig. 23 Below USD 50 market estimates and forecasts, 2018 - 2030
- Fig. 24 USD 51-150 market estimates and forecasts, 2018 - 2030
- Fig. 25 USD 151-350 market estimates and forecasts, 2018 - 2030
- Fig. 26 Over USD 351 market estimates and forecasts, 2018 - 2030
- Fig. 27 Headset market: Connectivity movement analysis
- Fig. 28 Headset market: Connectivity outlook and key takeaways
- Fig. 29 Wired market estimates and forecasts, 2018 - 2030
- Fig. 30 Wireless market estimates and forecasts, 2018 - 2030
- Fig. 31 Headset market: Application movement analysis
- Fig. 32 Headset market: Application outlook and key takeaways
- Fig. 33 Personal market estimates and forecasts, 2018 - 2030
- Fig. 34 Connectivity market estimates and forecasts, 2018 - 2030
- Fig. 35 Global headset market: Regional movement analysis
- Fig. 36 Global headset market: Regional outlook and key takeaways
- Fig. 37 North America market estimates and forecasts, 2018 - 2030
- Fig. 38 U.S. market estimates and forecasts, 2018 - 2030
- Fig. 39 Canada market estimates and forecasts, 2018 - 2030
- Fig. 40 Europe market estimates and forecasts, 2018 - 2030
- Fig. 41 UK market estimates and forecasts, 2018 - 2030
- Fig. 42 Germany market estimates and forecasts, 2018 - 2030
- Fig. 43 France market estimates and forecasts, 2018 - 2030
- Fig. 44 Asia Pacific market estimates and forecasts, 2018 - 2030
- Fig. 45 Japan market estimates and forecasts, 2018 - 2030
- Fig. 46 China market estimates and forecasts, 2018 - 2030
- Fig. 47 India market estimates and forecasts, 2018 - 2030
- Fig. 48 Australia market estimates and forecasts, 2018 - 2030
- Fig. 49 South Korea market estimates and forecasts, 2018 - 2030
- Fig. 50 Latin America market estimates and forecasts, 2018 - 2030
- Fig. 51 Brazil market estimates and forecasts, 2018 - 2030
- Fig. 52 Mexico market estimates and forecasts, 2018 - 2030
- Fig. 53 Middle East and Africa market estimates and forecasts, 2018 - 2030
- Fig. 54 Saudi Arabia market estimates and forecasts, 2018 - 2030
- Fig. 55 South Africa market estimates and forecasts, 2018 - 2030
- Fig. 56 UAE market estimates and forecasts, 2018 - 2030
Headset Market Growth & Trends:
The global headset market size is expected to reach USD 558.89 billion by 2030, registering a CAGR of 31.2% during the forecast period, according to a new report by Grand View Research, Inc. The headset market is driven by advanced products including smartphones, smart television, and more. It is continuously evolving in nature. The increasing consumer demand for higher fidelity and style is anticipated to favorably impact the market growth. Furthermore, fitness and sports enthusiasts are becoming more interested in wearable technology thanks to the introduction of innovative sports and fitness wearable equipment. A number of OEMs are offering groundbreaking features in headsets, such as fitness tracking and monitoring.
The COVID-19 outbreak in 2021, led to remote and hybrid work culture which spurred demand for headsets. With new usage scenarios deployed in several industries, including education, healthcare, and government, the pandemic has strengthened the paradigm shift toward "work from anywhere" or hybrid/flexible working, creating long-term opportunities for the headset market. Demand for the headset has risen amidst the pandemic, but the overall market remains negatively impacted due to the disruptions in the supply chain.
Increasing headset adoption during the workout is expected to drive global market growth during the forecasted period. Besides, manufacturers target fitness-conscious customers by offering innovative features such as fitness monitoring & tracking in headsets. For example, the BioSport Audio in-ear headphones powered by Intel provide health monitoring functions that require no special chargers or batteries. BioSport relies on built-in sensors and unique software to operate as a pedometer, heart monitor, and other biometrics. Besides, the headset software is designed in a way through which a user can plan, monitor, and execute fitness activities via a mobile application.
A majority of customers seek fashionable and trendy-looking products. Future, headset success will not only depend on the technology but also on the appearance and design that suit the customer's values and promotes his/her individuality. A trendy product can penetrate all three existing segments, including low-range, mid-range, and high-range products. As a result of the need for fashionable designs, wireless headsets have become increasingly popular.
Headset Market Report Highlights:
- Growing demand for better communications in the commercial application segment, particularly in corporations and call centers, is likely to considerably contribute to industry growth. The commercial headset market is expected to witness significant growth from 2023 to 2030
- In 2022, wired segment accounted for a 51.7% share of the total market. However, a growing preference for wireless devices due to their ease of use is expected to fuel growth in the wireless technology segment
- The in-ear headset market is expected to gain traction and grow at the fastest CAGR of 32.1% during the forecast period. Miniaturization, portability, and better comfort are the key advantages offered by in-ear headsets.
- Due to recent technological advancements, on-ear headphones have become more popular and improved in quality. Also, more vendors are adding on-ear headphones to their portfolios within the U.S. earphones and headphones market
- United States, Canada, and Mexico maintained the largest market share for headsets worldwide. Among the most important growth factors in the market are high-income citizens, new technology, and ongoing technological innovation. Revenue-wise, North America dominates the world market and is predicted to maintain this dominance throughout the forecasted period.
Table of Contents
Chapter 1. Methodology and Scope
- 1.1. Market Segmentation & Scope
- 1.1.1. Type
- 1.1.2. Price band
- 1.1.3. Connectivity
- 1.1.4. Application
- 1.1.5. Regional scope
- 1.1.6. Estimates and forecast timeline
- 1.2. Research Methodology
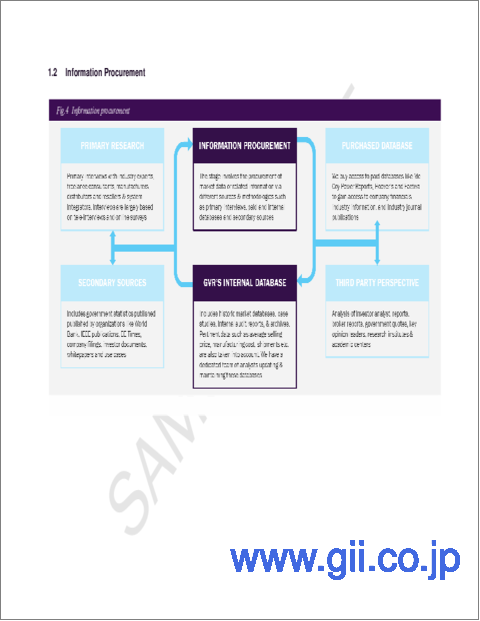
- 1.3. Information Procurement
- 1.3.1. Purchased database
- 1.3.2. GVR's internal database
- 1.3.3. Secondary sources
- 1.3.4. Primary research
- 1.3.5. Details of primary research
- 1.4. Information or Data Analysis
- 1.5. Market Formulation & Validation
- 1.6. Model Details
- 1.7. List of Secondary Sources
- 1.8. List of Primary Sources
- 1.9. Objectives
Chapter 2. Executive Summary
- 2.1. Market Outlook
- 2.2. Segment Outlook
- 2.2.1. Type outlook
- 2.2.2. Price band outlook
- 2.2.3. Connectivity outlook
- 2.2.4. Application outlook
- 2.2.5. Regional outlook
- 2.3. Competitive Insights
Chapter 3. Headset Market Variables, Trends & Scope
- 3.1. Market Lineage Outlook
- 3.2. Industry Value Chain Analysis
- 3.3. Market Dynamics
- 3.3.1. Market driver analysis
- 3.3.2. Market restraint analysis
- 3.3.3. Market opportunity analysis
- 3.4. Headset Market Analysis Tools
- 3.4.1. Industry analysis - Porter's
- 3.4.1.1. Supplier power
- 3.4.1.2. Buyer power
- 3.4.1.3. Substitution threat
- 3.4.1.4. Threat of new entrant
- 3.4.1.5. Competitive rivalry
- 3.4.2. PESTEL analysis
- 3.4.2.1. Political landscape
- 3.4.2.2. Technological landscape
- 3.4.2.3. Economic landscape
- 3.4.1. Industry analysis - Porter's
Chapter 4. Headset : Type Estimates & Trend Analysis
- 4.1. Headset Market: Key Takeaways
- 4.2. Headset Market: Movement & Market Share Analysis, 2022 & 2030
- 4.3. In-ear
- 4.3.1. In-ear market estimates and forecasts, 2018 to 2030 (USD Million and Million Units)
- 4.4. Over-ear
- 4.4.1. Over-ear market estimates and forecasts, 2018 to 2030 (USD Million and Million Units)
Chapter 5. Headset : Price Band Estimates & Trend Analysis
- 5.1. Headset Market: Key Takeaways
- 5.2. Headset Market: Movement & Market Share Analysis, 2022 & 2030
- 5.3. Below USD 50
- 5.3.1. Below USD 50 market estimates and forecasts, 2018 to 2030 (USD Million and Million Units)
- 5.4. USD 51-150
- 5.4.1. USD 51-150 market estimates and forecasts, 2018 to 2030 (USD Million and Million Units)
- 5.5. USD 151-350
- 5.5.1. USD 151-350 market estimates and forecasts, 2018 to 2030 (USD Million and Million Units)
- 5.6. Over USD 351
- 5.6.1. Over USD 351 market estimates and forecasts, 2018 to 2030 (USD Million and Million Units)
Chapter 6. Headset : Connectivity Estimates & Trend Analysis
- 6.1. Headset Market: Key Takeaways
- 6.2. Headset Market: Movement & Market Share Analysis, 2022 & 2030
- 6.3. Wired
- 6.3.1. Wired market estimates and forecasts, 2018 to 2030 (USD Million and Million Units)
- 6.4. Wireless
- 6.4.1. Wireless market estimates and forecasts, 2018 to 2030 (USD Million and Million Units
Chapter 7. Headset : Application Estimates & Trend Analysis
- 7.1. Headset Market: Key Takeaways
- 7.2. Headset Market: Movement & Market Share Analysis, 2022 & 2030
- 7.3. Personal
- 7.3.1. Personal market estimates and forecasts, 2018 to 2030 (USD Million and Million Units)
- 7.4. Commercial
- 7.4.1. Commercial market estimates and forecasts, 2018 to 2030 (USD Million and Million Units)
Chapter 8. Headset Market: Regional Estimates & Trend Analysis
- 8.1. Regional Outlook
- 8.2. Headset Market by Region: Key Takeaway
- 8.3. North America
- 8.3.1. Market estimates and forecasts, 2018 to 2030 (Revenue, USD Million; Volume, Million Units)
- 8.3.2. U.S.
- 8.3.2.1. Market estimates and forecasts, 2018 to 2030 (Revenue, USD Million; Volume, Million Units)
- 8.3.3. Canada
- 8.3.3.1. Market estimates and forecasts, 2018 to 2030 (Revenue, USD Million; Volume, Million Units)
- 8.4. Europe
- 8.4.1. UK
- 8.4.1.1. Market estimates and forecasts, 2018 to 2030 (Revenue, USD Million; Volume, Million Units)
- 8.4.2. Germany
- 8.4.2.1. Market estimates and forecasts, 2018 to 2030 (Revenue, USD Million; Volume, Million Units)
- 8.4.3. France
- 8.4.3.1. Market estimates and forecasts, 2018 to 2030 (Revenue, USD Million; Volume, Million Units)
- 8.4.1. UK
- 8.5. Asia Pacific
- 8.5.1. Japan
- 8.5.1.1. Market estimates and forecasts, 2018 to 2030 (Revenue, USD Million; Volume, Million Units)
- 8.5.2. China
- 8.5.2.1. Market estimates and forecasts, 2018 to 2030 (Revenue, USD Million; Volume, Million Units)
- 8.5.3. India
- 8.5.3.1. Market estimates and forecasts, 2018 to 2030 (Revenue, USD Million; Volume, Million Units)
- 8.5.4. Australia
- 8.5.4.1. Market estimates and forecasts, 2018 to 2030 (Revenue, USD Million; Volume, Million Units)
- 8.5.5. South Korea
- 8.5.5.1. Market estimates and forecasts, 2018 to 2030 (Revenue, USD Million; Volume, Million Units)
- 8.5.1. Japan
- 8.6. Latin America
- 8.6.1. Brazil
- 8.6.1.1. Market estimates and forecasts, 2018 to 2030 (Revenue, USD Million; Volume, Million Units)
- 8.6.2. Mexico
- 8.6.2.1. Market estimates and forecasts, 2018 to 2030 (Revenue, USD Million; Volume, Million Units)
- 8.6.1. Brazil
- 8.7. MEA
- 8.7.1. Saudi Arabia
- 8.7.1.1. Market estimates and forecasts, 2018 to 2030 (Revenue, USD Million; Volume, Million Units)
- 8.7.2. South Africa
- 8.7.2.1. Market estimates and forecasts, 2018 to 2030 (Revenue, USD Million; Volume, Million Units)
- 8.7.3. UAE
- 8.7.3.1. Market estimates and forecasts, 2018 to 2030 (Revenue, USD Million; Volume, Million Units)
- 8.7.1. Saudi Arabia
Chapter 9. Competitive Landscape
- 9.1. Recent Developments & Impact Analysis, By Key Market Participants
- 9.2. Market Participant Categorization
- 9.2.1. Alclair / Matrics Inc.
- 9.2.1.1. Company overview
- 9.2.1.2. Financial performance
- 9.2.1.3. Product benchmarking
- 9.2.1.4. Strategic initiatives
- 9.2.2. Apple, Inc.
- 9.2.2.1. Company overview
- 9.2.2.2. Financial performance
- 9.2.2.3. Product benchmarking
- 9.2.2.4. Strategic initiatives
- 9.2.3. Bose Corporation
- 9.2.3.1. Company overview
- 9.2.3.2. Financial performance
- 9.2.3.3. Product benchmarking
- 9.2.3.4. Strategic initiatives
- 9.2.4. Grado Labs.
- 9.2.4.1. Company overview
- 9.2.4.2. Financial performance
- 9.2.4.3. Product benchmarking
- 9.2.4.4. Strategic initiatives
- 9.2.5. HARMAN International.
- 9.2.5.1. Company overview
- 9.2.5.2. Financial performance
- 9.2.5.3. Product benchmarking
- 9.2.5.4. Strategic initiatives
- 9.2.6. JVCKENWOOD Corporation
- 9.2.6.1. Company overview
- 9.2.6.2. Financial performance
- 9.2.6.3. Product benchmarking
- 9.2.6.4. Strategic initiatives
- 9.2.7. Koninklijke Philips N.V.,
- 9.2.7.1. Company overview
- 9.2.7.2. Financial performance
- 9.2.7.3. Product benchmarking
- 9.2.7.4. Strategic initiatives
- 9.2.8. Logitech.
- 9.2.8.1. Company overview
- 9.2.8.2. Financial performance
- 9.2.8.3. Product benchmarking
- 9.2.8.4. Strategic initiatives
- 9.2.9. Panasonic Holdings Corporation
- 9.2.9.1. Company overview
- 9.2.9.2. Financial performance
- 9.2.9.3. Product benchmarking
- 9.2.9.4. Strategic initiatives
- 9.2.10. Plantronics, Inc.
- 9.2.10.1. Company overview
- 9.2.10.2. Financial performance
- 9.2.10.3. Product benchmarking
- 9.2.10.4. Strategic initiatives
- 9.2.11. Pioneer Corporation.
- 9.2.11.1. Company overview
- 9.2.11.2. Financial performance
- 9.2.11.3. Product benchmarking
- 9.2.11.4. Strategic initiatives
- 9.2.12. Sennheiser electronic GmbH & Co. KG
- 9.2.12.1. Company overview
- 9.2.12.2. Financial performance
- 9.2.12.3. Product benchmarking
- 9.2.12.4. Strategic initiatives
- 9.2.13. SHENZHEN CANNICE TECHNOLOGY CO.,LTD.
- 9.2.13.1. Company overview
- 9.2.13.2. Financial performance
- 9.2.13.3. Product benchmarking
- 9.2.13.4. Strategic initiatives
- 9.2.14. Shure Incorporated.
- 9.2.14.1. Company overview
- 9.2.14.2. Financial performance
- 9.2.14.3. Product benchmarking
- 9.2.14.4. Strategic initiatives
- 9.2.15. Skullcandy.eu
- 9.2.15.1. Company overview
- 9.2.15.2. Financial performance
- 9.2.15.3. Product benchmarking
- 9.2.15.4. Strategic initiatives
- 9.2.16. Sony Corporation
- 9.2.16.1. Company overview
- 9.2.16.2. Financial performance
- 9.2.16.3. Product benchmarking
- 9.2.16.4. Strategic initiatives
- 9.2.17. ULTIMATE EARS.
- 9.2.17.1. Company overview
- 9.2.17.2. Financial performance
- 9.2.17.3. Product benchmarking
- 9.2.17.4. Strategic initiatives
- 9.2.18. Zebronics India Pvt. Ltd.
- 9.2.18.1. Company overview
- 9.2.18.2. Financial performance
- 9.2.18.3. Product benchmarking
- 9.2.18.4. Strategic initiatives
- 9.2.1. Alclair / Matrics Inc.

