|
|
市場調査レポート
商品コード
1404862
二輪車用ハブモーターの市場規模、シェア、動向分析レポート:車両別、設置別、モーター別、販売チャネル別、出力別、地域別、セグメント動向:2023年~2030年Two Wheeler Hub Motor Market Size, Share & Trends Analysis Report By Vehicle, By Installation (Front Hub Motor, Rear Hub Motor), By Motor, By Sales Channel, By Power Output, By Region, And Segment Forecasts, 2023 - 2030 |
||||||
|
|
|||||||
カスタマイズ可能
|
|||||||


| 二輪車用ハブモーターの市場規模、シェア、動向分析レポート:車両別、設置別、モーター別、販売チャネル別、出力別、地域別、セグメント動向:2023年~2030年 |
|
出版日: 2023年11月02日
発行: Grand View Research
ページ情報: 英文 140 Pages
納期: 2~10営業日
|

- 全表示
- 概要
- 図表
- 目次
二輪車用ハブモーター市場の成長と動向
Grand View Research, Inc.の最新レポートによると、世界の二輪車用ハブモーター市場規模は、2023年から2030年にかけて12.3%のCAGRを記録し、2030年までに253億9,000万米ドルに達する見込みです。
電動二輪車への需要の高まりと、二酸化炭素排出量削減のための厳しい政府規制が、市場成長につながると予測されています。さらに、車両性能、信頼性、走行距離の向上は、今後7年間のハブモーター需要に影響を与えると予測される要因のいくつかです。
自動車の排出ガスによる環境悪化の割合が増加していることは、世界中の政府にとって重要な懸念となっています。そのため、いくつかの政府は、従来の自動車から環境に優しい輸送手段への移行を促進するための措置を講じています。そのため政府は、メーカーとエンドユーザーの双方に対して、電気二輪車に対する道路税、購入税、輸入税、低額またはゼロの登録料に対する優遇措置を発表しています。さらに、自動車メーカーによる多額の投資は、電動二輪車の需要増加に対応するものと推定されます。これは、市場の進化において重要な役割を果たすと予想されます。
アジア太平洋地域は、2022年に二輪車用ハブモーター市場を独占し、予測期間中もその支配を維持すると予想されます。この地域は、中国における電動二輪車とモーターメーカーの存在によって大きく牽引されています。この地域の電動二輪車市場全体の70.0%以上を中国が占めています。さらに、インド、韓国、日本における電動二輪車産業の成長は、インホイールモーターの需要を誘発すると予想されます。
さらに、電動二輪車の採用を促進するためのいくつかの政府規制は、この地域の市場成長に影響を与える重要な要因の1つです。例えば、2018年にインド政府は、FAME IIプログラムの下で電気自動車に対する13億米ドルの財政支援を増加させました。この措置は、電気二輪車、三輪車、自動車、バスに需要側のインセンティブを提供することを目的としていました。こうした取り組みは、2023年から2030年にかけて市場の成長を促進すると予想されます。
同市場は、複数の主要メーカーが存在するため、その性質上細分化されています。しかし、著名な電動二輪車メーカーは、業界の需給ギャップを埋めるために、通常サプライヤーと戦略的協定を結んでいます。市場の主要メーカーには、NTN Corporation、Robert Bosch GmbH、QS Motors、Schaeffler Technologies AG &Co.KGなどです。
二輪車用ハブモーター市場レポートハイライト
- 電動バイク分野が2022年に56.3%の最大市場シェアを占める。二輪車用ハブモーターは、パワー/スピードの向上、高トルク、1回の充電での走行距離の延長により、電動バイクで顕著に使用されています。
- リアハブモーターセグメントは、2022年に91.5%の市場シェアで市場を独占し、予測期間中に12.6%の最速CAGRを記録すると予測されています。メーカーは、二輪車用ハブモーターを後輪に搭載することを好むが、これはトラクションが向上し、安定性が向上し、車両性能が向上するからです。
- 1KW未満セグメントは2022年の売上シェア54.4%で市場を独占しました。電動自転車、電動スケートボード、電動キックスクーターは、一般的に1kW未満の出力を持つモーターを好みます。
- アジア太平洋地域は、2022年に56.8%と最大の市場シェアを占めました。この地域の市場成長も主に中国、日本、インド、韓国が牽引しています。中国は、主要な二輪車用ハブモーター・メーカーが存在するため、アジア太平洋地域最大の二輪車用ハブモーター市場です。
目次
第1章 調査手法と範囲
第2章 エグゼクティブサマリー
第3章 二輪車用ハブモーター市場の変数、動向、範囲
- 市場系統の見通し
- 業界のバリューチェーン分析
- 市場力学
- 市場促進要因分析
- 市場抑制要因分析
- 市場機会分析
- 二輪車用ハブモーター市場分析ツール
- 業界分析- ポーターのファイブフォース分析
- PESTEL分析
第4章 二輪車用ハブモーター市場:車両推定・動向分析
- 二輪車用ハブモーター市場:重要なポイント
- 二輪車用ハブモーター市場:動向と市場シェア分析、2022年と2030年
- 電動スクーター/モペット
- 電動スクーター/モペット市場推計・予測、2017年~2030年
- 電動自転車
- 電動自転車市場推計・予測、2017年~2030年
- 電動バイク
- 電動バイク市場推計・予測、2017年~2030年
- その他
- その他の市場推計・予測、2017年~2030年
第5章 二輪車用ハブモーター市場:設置推定・動向分析
- 二輪車用ハブモーター市場:重要なポイント
- 二輪車用ハブモーター市場:動向と市場シェア分析、2022年と2030年
- フロントハブモーター
- フロントハブモーター市場推計・予測、2017年~2030年
- リアハブモーター
- リアハブモーター市場推計・予測、2017年~2030年
第6章 二輪車用ハブモーター市場:モーターの推定・動向分析
- 二輪車用ハブモーター市場:重要なポイント
- 二輪車用ハブモーター市場:動向と市場シェア分析、2022年と2030年
- ギア付きハブモーター
- ギア付きハブモーター市場推計・予測、2017年~2030年
- ギアレスハブモーター
- ギアレスハブモーター市場推計・予測、2017年~2030年
第7章 二輪車用ハブモーター市場:販売チャネルの推定・動向分析
- 二輪車用ハブモーター市場:重要なポイント
- 二輪車用ハブモーター市場:動向と市場シェア分析、2022年と2030年
- OEM
- OEM市場推計・予測、2017年~2030年
- アフターマーケット
- アフターマーケット市場推計・予測、2017年~2030年
第8章 二輪車用ハブモーター市場:出力推定と推定・動向分析
- 二輪車用ハブモーター市場:重要なポイント
- 二輪車用ハブモーター市場:動向と市場シェア分析、2022年と2030年
- 1KW未満
- 1 KW未満の市場推計・予測、2017年~2030年
- 3KW以上
- 3 KW以上の市場推計・予測、2017年~2030年
第9章 二輪車用ハブモーター市場:地域別の推定・動向分析
- 地域別の見通し
- 地域別二輪車用ハブモーター市場:重要なポイント
- 北米
- 市場推計・予測、2017年~2030年
- 米国
- カナダ
- 欧州
- 英国
- ドイツ
- フランス
- アジア太平洋
- 日本
- 中国
- インド
- オーストラリア
- 韓国
- ラテンアメリカ
- ブラジル
- メキシコ
- 中東・アフリカ
- サウジアラビア
- 南アフリカ
- アラブ首長国連邦
第10章 競合情勢
- 主要市場参入企業による最近の動向と影響分析
- 市場参入企業の分類
- Blinkfire Analytics, Inc.
- Gumgum, Inc.
- Kairos AR, Inc.
- SparkTrendz
- Cloudsight, Inc.
- Chooch.com
- Google LLC
- Attrasoft, Inc.
- Catchroom
- Hitachi, Ltd.
- Honeywell International Inc.
- LTU Tech
- NEC Corporation
- Qualcomm Technologies, Inc.
- Slyce Acquisition Inc.
List of Tables
- Table 1 List of abbreviations
- Table 2 North America two wheeler hub motor market, by vehicle, 2017 - 2030 (USD Million)
- Table 3 North America two wheeler hub motor market, by installation, 2017 - 2030 (USD Million)
- Table 4 North America two wheeler hub motor market, by motor, 2017 - 2030 (USD Million)
- Table 5 North America two wheeler hub motor market, by sales channel, 2017 - 2030 (USD Million)
- Table 6 North America two wheeler hub motor market, by power output, 2017 - 2030 (USD Million)
- Table 7 North America two wheeler hub motor market, by region, 2017 to 2030 (USD Million)
- Table 8 U.S. two wheeler hub motor market, by vehicle, 2017 - 2030 (USD Million)
- Table 9 U.S. two wheeler hub motor market, by installation, 2017 - 2030 (USD Million)
- Table 10 U.S. two wheeler hub motor market, by motor, 2017 - 2030 (USD Million)
- Table 11 U.S. two wheeler hub motor market, by sales channel, 2017 - 2030 (USD Million)
- Table 12 U.S. two wheeler hub motor market, by power output, 2017 - 2030 (USD Million)
- Table 13 Canada two wheeler hub motor market, by vehicle, 2017 - 2030 (USD Million)
- Table 14 Canada two wheeler hub motor market, by installation, 2017 - 2030 (USD Million)
- Table 15 Canada two wheeler hub motor market, by motor, 2017 - 2030 (USD Million)
- Table 16 Canada two wheeler hub motor market, by sales channel, 2017 - 2030 (USD Million)
- Table 17 Canada two wheeler hub motor market, by power output, 2017 - 2030 (USD Million)
- Table 18 Europe two wheeler hub motor market, by vehicle, 2017 - 2030 (USD Million)
- Table 19 Europe two wheeler hub motor market, by installation, 2017 - 2030 (USD Million)
- Table 20 Europe two wheeler hub motor market, by motor, 2017 - 2030 (USD Million)
- Table 21 Europe two wheeler hub motor market, by sales channel, 2017 - 2030 (USD Million)
- Table 22 Europe two wheeler hub motor market, by power output, 2017 - 2030 (USD Million)
- Table 23 Europe two wheeler hub motor market, by region, 2017 to 2030 (USD Million)
- Table 24 Germany two wheeler hub motor market, by vehicle, 2017 - 2030 (USD Million)
- Table 25 Germany two wheeler hub motor market, by installation, 2017 - 2030 (USD Million)
- Table 26 Germany two wheeler hub motor market, by motor, 2017 - 2030 (USD Million)
- Table 27 Germany two wheeler hub motor market, by sales channel, 2017 - 2030 (USD Million)
- Table 28 Germany two wheeler hub motor market, by power output, 2017 - 2030 (USD Million)
- Table 29 UK two wheeler hub motor market, by vehicle, 2017 - 2030 (USD Million)
- Table 30 UK two wheeler hub motor market, by installation, 2017 - 2030 (USD Million)
- Table 31 UK two wheeler hub motor market, by motor, 2017 - 2030 (USD Million)
- Table 32 UK two wheeler hub motor market, by sales channel, 2017 - 2030 (USD Million)
- Table 33 UK two wheeler hub motor market, by power output, 2017 - 2030 (USD Million)
- Table 34 France two wheeler hub motor market, by vehicle, 2017 - 2030 (USD Million)
- Table 35 France two wheeler hub motor market, by installation, 2017 - 2030 (USD Million)
- Table 36 France two wheeler hub motor market, by motor, 2017 - 2030 (USD Million)
- Table 37 France two wheeler hub motor market, by sales channel, 2017 - 2030 (USD Million)
- Table 38 France two wheeler hub motor market, by power output, 2017 - 2030 (USD Million)
- Table 39 Asia Pacific two wheeler hub motor market, by vehicle, 2017 - 2030 (USD Million)
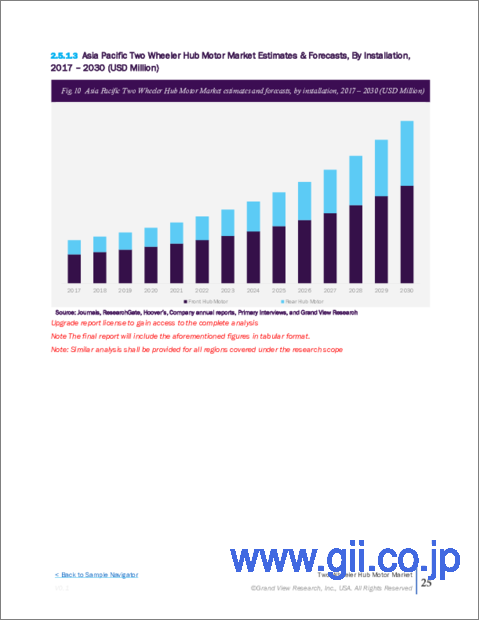
- Table 40 Asia Pacific two wheeler hub motor market, by installation, 2017 - 2030 (USD Million)
- Table 41 Asia Pacific two wheeler hub motor market, by motor, 2017 - 2030 (USD Million)
- Table 42 Asia Pacific two wheeler hub motor market, by sales channel, 2017 - 2030 (USD Million)
- Table 43 Asia Pacific two wheeler hub motor market, by power output, 2017 - 2030 (USD Million)
- Table 44 Asia Pacific two wheeler hub motor market, by region, 2017 to 2030 (USD Million)
- Table 45 China two wheeler hub motor market, by vehicle, 2017 - 2030 (USD Million)
- Table 46 China two wheeler hub motor market, by installation, 2017 - 2030 (USD Million)
- Table 47 China two wheeler hub motor market, by motor, 2017 - 2030 (USD Million)
- Table 48 China two wheeler hub motor market, by sales channel, 2017 - 2030 (USD Million)
- Table 49 China two wheeler hub motor market, by power output, 2017 - 2030 (USD Million)
- Table 50 Japan two wheeler hub motor market, by vehicle, 2017 - 2030 (USD Million)
- Table 51 Japan two wheeler hub motor market, by installation, 2017 - 2030 (USD Million)
- Table 52 Japan two wheeler hub motor market, by motor, 2017 - 2030 (USD Million)
- Table 53 Japan two wheeler hub motor market, by sales channel, 2017 - 2030 (USD Million)
- Table 54 Japan two wheeler hub motor market, by power output, 2017 - 2030 (USD Million)
- Table 55 India two wheeler hub motor market, by vehicle, 2017 - 2030 (USD Million)
- Table 56 India two wheeler hub motor market, by installation, 2017 - 2030 (USD Million)
- Table 57 India two wheeler hub motor market, by motor, 2017 - 2030 (USD Million)
- Table 58 India two wheeler hub motor market, by sales channel, 2017 - 2030 (USD Million)
- Table 59 India two wheeler hub motor market, by power output, 2017 - 2030 (USD Million)
- Table 60 Australia two wheeler hub motor market, by vehicle, 2017 - 2030 (USD Million)
- Table 61 Australia two wheeler hub motor market, by installation, 2017 - 2030 (USD Million)
- Table 62 Australia two wheeler hub motor market, by motor, 2017 - 2030 (USD Million)
- Table 63 Australia two wheeler hub motor market, by sales channel, 2017 - 2030 (USD Million)
- Table 64 Australia two wheeler hub motor market, by power output, 2017 - 2030 (USD Million)
- Table 65 South Korea two wheeler hub motor market, by vehicle, 2017 - 2030 (USD Million)
- Table 66 South Korea two wheeler hub motor market, by installation, 2017 - 2030 (USD Million)
- Table 67 South Korea two wheeler hub motor market, by motor, 2017 - 2030 (USD Million)
- Table 68 South Korea two wheeler hub motor market, by sales channel, 2017 - 2030 (USD Million)
- Table 69 South Korea two wheeler hub motor market, by power output, 2017 - 2030 (USD Million)
- Table 70 Latin America two wheeler hub motor market, by vehicle, 2017 - 2030 (USD Million)
- Table 71 Latin America two wheeler hub motor market, by installation, 2017 - 2030 (USD Million)
- Table 72 Latin America two wheeler hub motor market, by motor, 2017 - 2030 (USD Million)
- Table 73 Latin America two wheeler hub motor market, by sales channel, 2017 - 2030 (USD Million)
- Table 74 Latin America two wheeler hub motor market, by power output, 2017 - 2030 (USD Million)
- Table 75 Latin America two wheeler hub motor market, by region, 2017 to 2030 (USD Million)
- Table 76 Brazil two wheeler hub motor market, by vehicle, 2017 - 2030 (USD Million)
- Table 77 Brazil two wheeler hub motor market, by installation, 2017 - 2030 (USD Million)
- Table 78 Brazil two wheeler hub motor market, by motor, 2017 - 2030 (USD Million)
- Table 79 Brazil two wheeler hub motor market, by sales channel, 2017 - 2030 (USD Million)
- Table 80 Brazil two wheeler hub motor market, by power output, 2017 - 2030 (USD Million)
- Table 81 Mexico two wheeler hub motor market, by vehicle, 2017 - 2030 (USD Million)
- Table 82 Mexico two wheeler hub motor market, by installation, 2017 - 2030 (USD Million)
- Table 83 Mexico two wheeler hub motor market, by motor, 2017 - 2030 (USD Million)
- Table 84 Mexico two wheeler hub motor market, by sales channel, 2017 - 2030 (USD Million)
- Table 85 Mexico two wheeler hub motor market, by power output, 2017 - 2030 (USD Million)
- Table 86 Middle East and Africa two wheeler hub motor market, by vehicle, 2017 - 2030 (USD Million)
- Table 87 Middle East and Africa two wheeler hub motor market, by installation, 2017 - 2030 (USD Million)
- Table 88 Middle East and Africa two wheeler hub motor market, by motor, 2017 - 2030 (USD Million)
- Table 89 Middle East and Africa two wheeler hub motor market, by sales channel, 2017 - 2030 (USD Million)
- Table 90 Middle East and Africa two wheeler hub motor market, by power output, 2017 - 2030 (USD Million)
- Table 91 Middle East and Africa two wheeler hub motor market, by region, 2017 to 2030 (USD Million)
- Table 92 South Africa two wheeler hub motor market, by vehicle, 2017 - 2030 (USD Million)
- Table 93 South Africa two wheeler hub motor market, by installation, 2017 - 2030 (USD Million)
- Table 94 South Africa two wheeler hub motor market, by motor, 2017 - 2030 (USD Million)
- Table 95 South Africa two wheeler hub motor market, by sales channel, 2017 - 2030 (USD Million)
- Table 96 South Africa two wheeler hub motor market, by power output, 2017 - 2030 (USD Million)
- Table 97 Saudi Arabia two wheeler hub motor market, by vehicle, 2017 - 2030 (USD Million)
- Table 98 Saudi Arabia two wheeler hub motor market, by installation, 2017 - 2030 (USD Million)
- Table 99 Saudi Arabia two wheeler hub motor market, by motor, 2017 - 2030 (USD Million)
- Table 100 Saudi Arabia two wheeler hub motor market, by sales channel, 2017 - 2030 (USD Million)
- Table 101 Saudi Arabia two wheeler hub motor market, by power output, 2017 - 2030 (USD Million)
- Table 102 UAE two wheeler hub motor market, by vehicle, 2017 - 2030 (USD Million)
- Table 103 UAE two wheeler hub motor market, by installation, 2017 - 2030 (USD Million)
- Table 104 UAE two wheeler hub motor market, by motor, 2017 - 2030 (USD Million)
- Table 105 UAE two wheeler hub motor market, by sales channel, 2017 - 2030 (USD Million)
- Table 106 UAE two wheeler hub motor market, by power output, 2017 - 2030 (USD Million)
List of Figures
- Fig. 1 Market research process
- Fig. 2 Data triangulation vehicles
- Fig. 3 Primary research pattern
- Fig. 4 Market research approaches
- Fig. 5 Value-chain-based sizing & forecasting
- Fig. 6 QFD modeling for market share assessment
- Fig. 7 Market formulation & validation
- Fig. 8 Image recognition: Market outlook
- Fig. 9 Image recognition: Competitive insights
- Fig. 10 Parent market outlook
- Fig. 11 Related/ancillary market outlook
- Fig. 12 Penetration and growth prospect mapping
- Fig. 13 Industry value chain analysis
- Fig. 14 Two wheeler hub motor market driver impact
- Fig. 15 Two wheeler hub motor market restraint impact
- Fig. 16 Two wheeler hub motor market strategic initiatives analysis
- Fig. 17 Two wheeler hub motor market: Vehicle movement analysis
- Fig. 18 Two wheeler hub motor market: Vehicle outlook and key takeaways
- Fig. 19 Electric scooter/moped market estimates and forecasts, 2017 - 2030
- Fig. 20 Electric bike market estimates and forecasts, 2017 - 2030
- Fig. 21 Electric motorcycle market estimates and forecasts, 2017 - 2030
- Fig. 22 Others market estimates and forecasts, 2017 - 2030
- Fig. 23 Two wheeler hub motor market: Installation movement analysis
- Fig. 24 Two wheeler hub motor market: Installation outlook and key takeaways
- Fig. 25 Front hub motor market estimates and forecasts, 2017 - 2030
- Fig. 26 Rear hub motor market estimates and forecasts, 2017 - 2030
- Fig. 27 Two wheeler hub motor market: Motor movement analysis
- Fig. 28 Two wheeler hub motor market: Motor outlook and key takeaways
- Fig. 29 Geared hub motor market estimates and forecasts, 2017 - 2030
- Fig. 30 Gearless hub motor market estimates and forecasts, 2017 - 2030
- Fig. 31 Two wheeler hub motor market: Sales channel mode movement analysis
- Fig. 32 Two wheeler hub motor market: Sales channel outlook and key takeaways
- Fig. 33 OEM market estimates and forecasts, 2017 - 2030
- Fig. 34 Aftermarket market estimates and forecasts, 2017 - 2030
- Fig. 35 Two wheeler hub motor market: Power output movement analysis
- Fig. 36 Two wheeler hub motor market: Power output outlook and key takeaways
- Fig. 37 Below 1 kW market estimates and forecasts, 2017 - 2030
- Fig. 38 (1-3) kW market estimates and forecasts, 2017 - 2030
- Fig. 39 Above 3 kW market estimates and forecasts, 2017 - 2030
- Fig. 40 Global two wheeler hub motor market: Regional movement analysis
- Fig. 41 Global two wheeler hub motor market: Regional outlook and key takeaways
- Fig. 42 North America market estimates and forecasts, 2017 - 2030
- Fig. 43 U.S. market estimates and forecasts, 2017 - 2030
- Fig. 44 Canada market estimates and forecasts, 2017 - 2030
- Fig. 45 Europe market estimates and forecasts, 2017 - 2030
- Fig. 46 UK market estimates and forecasts, 2017 - 2030
- Fig. 47 Germany market estimates and forecasts, 2017 - 2030
- Fig. 48 France market estimates and forecasts, 2017 - 2030
- Fig. 49 Asia Pacific market estimates and forecasts, 2017 - 2030
- Fig. 50 Japan market estimates and forecasts, 2017 - 2030
- Fig. 51 China market estimates and forecasts, 2017 - 2030
- Fig. 52 India market estimates and forecasts, 2017 - 2030
- Fig. 53 Australia market estimates and forecasts, 2017 - 2030
- Fig. 54 South Korea market estimates and forecasts, 2017 - 2030
- Fig. 55 Latin America market estimates and forecasts, 2017 - 2030
- Fig. 56 Brazil market estimates and forecasts, 2017 - 2030
- Fig. 57 Mexico market estimates and forecasts, 2017 - 2030
- Fig. 58 Middle East and Africa market estimates and forecasts, 2017 - 2030
- Fig. 59 Saudi Arabia market estimates and forecasts, 2017 - 2030
- Fig. 60 South Africa market estimates and forecasts, 2017 - 2030
- Fig. 61 UAE market estimates and forecasts, 2017 - 2030
Two Wheeler Hub Motor Market Growth & Trends:
The global two wheeler hub motor market size is expected to reach USD 25.39 billion by 2030, registering a CAGR of 12.3% from 2023 to 2030, according to a new report by Grand View Research, Inc. Increasing demand for electric two-wheelers and stringent government regulations for reducing the carbon footprint is projected to market growth. Furthermore, improved vehicle performance, reliability, and driving range are some factors that are projected to influence the demand for hub motors over the next seven years.
The increasing rate of environmental degradation through vehicular emissions has become a key concern for governments across the globe. Therefore, several governments are taking steps to promote the shift from traditional vehicles to eco-friendly transportation. Hence, the government has announced incentives on road tax, purchase tax, import tax, and low or zero registration fee for electric two-wheelers for both manufacturers and end-users. Moreover, substantial investments from automakers are estimated to cater to the increasing demand for electric two-wheelers. This, in turn, is expected to play a crucial role in the evolution of the market.
Asia Pacific dominated the two wheeler hub motor market in 2022 and is expected to continue its dominance over the forecast period. The region is majorly driven owing to the presence of electric two-wheeler and motor manufacturers in China. The country accounts for over 70.0% of the overall electric two-wheeler market in the region. Moreover, the growth in the electric two-wheeler industry in India, South Korea, and Japan is anticipated to trigger the demand for in-wheel motors.
Furthermore, several government regulations to promote the adoption for electric two-wheelers is one of the vital factor influencing the regional market growth. For instance, in 2018, the government of India increased financial support valued at USD 1.3 billion for electric vehicles under its FAME II program. The step was aimed at providing the demand-side incentives for electric two-wheelers, three-wheelers, cars, and buses. Such initiatives are anticipated to fuel the growth of the market from 2023 to 2030.
The market is fragmented in nature owing to the presence of several key manufacturers. However, the prominent electric two-wheeler manufacturers usually undergo strategic agreements with their suppliers to bridge the demand and supply gap of the industry. Some of the significant manufacturers in the market are NTN Corporation; Robert Bosch GmbH; QS Motors; and Schaeffler Technologies AG & Co. KG.
Two Wheeler Hub Motor Market Report Highlights:
- The electric bike segment held the largest market share of 56.3% in 2022. Two-wheeler hub motors are prominently used in electric bikes due to their increased power/speed, high torque, and extended range per single charge.
- The rear hub motor segment dominated the market with a market share of 91.5% in 2022 and is anticipated to witness the fastest CAGR of 12.6% over the forecast period. The manufacturers prefer to install two-wheeler hub motors on the rear wheel as it offers better traction, improved stability, and higher vehicle performance.
- The below 1 KW segment dominated the market with a revenue share of 54.4% in 2022. Electric bikes, electric skateboards, and electric kick scooters generally prefer motors with a power output below 1 kW.
- Asia Pacific accounted for the largest market share of 56.8% in 2022. The market growth in this region is also mainly driven by China, Japan, India, and South Korea. China is the largest market for two-wheeler hub motors in the Asia Pacific due to the presence of major two-wheeler hub motor manufacturers
Table of Contents
Chapter 1. Methodology and Scope
- 1.1. Market Segmentation & Scope
- 1.1.1. Vehicle
- 1.1.2. Installation
- 1.1.3. Motor
- 1.1.4. Sales channel
- 1.1.5. Power output
- 1.1.6. Regional scope
- 1.1.7. Estimates and forecast timeline
- 1.2. Research Methodology
- 1.3. Information Procurement
- 1.3.1. Purchased database
- 1.3.2. GVR's internal database
- 1.3.3. Secondary sources
- 1.3.4. Primary research
- 1.3.5. Details of primary research
- 1.4. Information or Data Analysis
- 1.5. Market Formulation & Validation
- 1.6. Model Details
- 1.7. List of Secondary Sources
- 1.8. List of Primary Sources
- 1.9. Objectives
Chapter 2. Executive Summary
- 2.1. Market Outlook
- 2.2. Segment Outlook
- 2.2.1. Vehicle
- 2.2.2. Installation
- 2.2.3. Motor
- 2.2.4. Sales channel
- 2.2.5. Power output
- 2.2.6. Regional outlook
- 2.3. Competitive Insights
Chapter 3. Two Wheeler Hub Motor Market Variables, Trends & Scope
- 3.1. Market Lineage Outlook
- 3.2. Industry Value Chain Analysis
- 3.3. Market Dynamics
- 3.3.1. Market Driver Analysis
- 3.3.2. Market Restraint Analysis
- 3.3.3. Market Opportunity Analysis
- 3.4. Two Wheeler Hub Motor Market Analysis Tools
- 3.4.1. Industry Analysis - Porter's
- 3.4.1.1. Supplier power
- 3.4.1.2. Buyer power
- 3.4.1.3. Substitution threat
- 3.4.1.4. Threat of new entrant
- 3.4.1.5. Competitive rivalry
- 3.4.2. PESTEL analysis
- 3.4.2.1. Political landscape
- 3.4.2.2. Technological landscape
- 3.4.2.3. Economic Landscape
- 3.4.1. Industry Analysis - Porter's
Chapter 4. Two Wheeler Hub Motor Market: Vehicle Estimates & Trend Analysis
- 4.1. Two Wheeler Hub Motor Market: Key Takeaways
- 4.2. Two Wheeler Hub Motor Market: Movement & Market Share Analysis, 2022 & 2030
- 4.3. Electric scooter/moped
- 4.3.1. Electric scooter/moped market estimates and forecasts, 2017 to 2030 (USD Million)
- 4.4. Electric bike
- 4.4.1. Electric bike market estimates and forecasts, 2017 to 2030 (USD Million)
- 4.5. Electric motorcycle
- 4.5.1. Electric motorcycle market estimates and forecasts, 2017 to 2030 (USD Million)
- 4.6. Others
- 4.6.1. Others market estimates and forecasts, 2017 to 2030 (USD Million)
Chapter 5. Two Wheeler Hub Motor Market: Installation Estimates & Trend Analysis
- 5.1. Two Wheeler Hub Motor Market: Key Takeaways
- 5.2. Two Wheeler Hub Motor Market: Movement & Market Share Analysis, 2022 & 2030
- 5.3. Front hub motor
- 5.3.1. Front hub motor market estimates and forecasts, 2017 to 2030 (USD Million)
- 5.4. Rear hub motor
- 5.4.1. Rear hub motor market estimates and forecasts, 2017 to 2030 (USD Million)
Chapter 6. Two Wheeler Hub Motor Market: Motor Estimates & Trend Analysis
- 6.1. Two Wheeler Hub Motor Market: Key Takeaways
- 6.2. Two Wheeler Hub Motor Market: Movement & Market Share Analysis, 2022 & 2030
- 6.3. Geared hub motor
- 6.3.1. Geared hub motor market estimates and forecasts, 2017 to 2030 (USD Million)
- 6.4. Gearless hub motor
- 6.4.1. Gearless hub motor market estimates and forecasts, 2017 to 2030 (USD Million)
Chapter 7. Two Wheeler Hub Motor Market: Sales Channel Estimates & Trend Analysis
- 7.1. Two Wheeler Hub Motor Market: Key Takeaways
- 7.2. Two Wheeler Hub Motor Market: Movement & Market Share Analysis, 2022 & 2030
- 7.3. OEM
- 7.3.1. OEM market estimates and forecasts, 2017 to 2030 (USD Million)
- 7.4. Aftermarket
- 7.4.1. Aftermarket market estimates and forecasts, 2017 to 2030 (USD Million)
Chapter 8. Two Wheeler Hub Motor Market: Power Output Estimates & Trend Analysis
- 8.1. Two Wheeler Hub Motor Market: Key Takeaways
- 8.2. Two Wheeler Hub Motor Market: Movement & Market Share Analysis, 2022 & 2030
- 8.3. Below 1 KW
- 8.3.1. Below 1 KW market estimates and forecasts, 2017 to 2030 (USD Million)
- 8.4. (1-3) KW
- 8.4.1. (1-3) KW market estimates and forecasts, 2017 to 2030 (USD Million)
- 8.5. Above 3 KW
- 8.5.1. Above 3 KW market estimates and forecasts, 2017 to 2030 (USD Million)
Chapter 9. Two Wheeler Hub Motor Market: Regional Estimates & Trend Analysis
- 9.1. Regional Outlook
- 9.2. Two Wheeler Hub Motor Market by Region: Key Takeaway
- 9.3. North America
- 9.3.1. Market estimates and forecasts, 2017 to 2030 (Revenue, USD Million)
- 9.3.2. U.S.
- 9.3.2.1. Market estimates and forecasts, 2017 to 2030 (Revenue, USD Million)
- 9.3.3. Canada
- 9.3.3.1. Market estimates and forecasts, 2017 to 2030 (Revenue, USD Million)
- 9.4. Europe
- 9.4.1. UK
- 9.4.1.1. Market estimates and forecasts, 2017 to 2030 (Revenue, USD Million)
- 9.4.2. Germany
- 9.4.2.1. Market estimates and forecasts, 2017 to 2030 (Revenue, USD Million)
- 9.4.3. France
- 9.4.3.1. Market estimates and forecasts, 2017 to 2030 (Revenue, USD Million)
- 9.4.1. UK
- 9.5. Asia Pacific
- 9.5.1. Japan
- 9.5.1.1. Market estimates and forecasts, 2017 to 2030 (Revenue, USD Million)
- 9.5.2. China
- 9.5.2.1. Market estimates and forecasts, 2017 to 2030 (Revenue, USD Million)
- 9.5.3. India
- 9.5.3.1. Market estimates and forecasts, 2017 to 2030 (Revenue, USD Million)
- 9.5.4. Australia
- 9.5.4.1. Market estimates and forecasts, 2017 to 2030 (Revenue, USD Million)
- 9.5.5. South Korea
- 9.5.5.1. Market estimates and forecasts, 2017 to 2030 (Revenue, USD Million)
- 9.5.1. Japan
- 9.6. Latin America
- 9.6.1. Brazil
- 9.6.1.1. Market estimates and forecasts, 2017 to 2030 (Revenue, USD Million)
- 9.6.2. Mexico
- 9.6.2.1. Market estimates and forecasts, 2017 to 2030 (Revenue, USD Million)
- 9.6.1. Brazil
- 9.7. MEA
- 9.7.1. Saudi Arabia
- 9.7.1.1. Market estimates and forecasts, 2017 to 2030 (Revenue, USD Million)
- 9.7.2. South Africa
- 9.7.2.1. Market estimates and forecasts, 2017 to 2030 (Revenue, USD Million)
- 9.7.3. UAE
- 9.7.3.1. Market estimates and forecasts, 2017 to 2030 (Revenue, USD Million)
- 9.7.1. Saudi Arabia
Chapter 10. Competitive Landscape
- 10.1. Recent Developments & Impact Analysis, By Key Market Participants
- 10.2. Market Participant Categorization
- 10.2.1. Blinkfire Analytics, Inc.
- 10.2.1.1. Company overview
- 10.2.1.2. Financial performance
- 10.2.1.3. Product benchmarking
- 10.2.1.4. Strategic initiatives
- 10.2.2. Gumgum, Inc.
- 10.2.2.1. Company overview
- 10.2.2.2. Financial performance
- 10.2.2.3. Product benchmarking
- 10.2.2.4. Strategic initiatives
- 10.2.3. Kairos AR, Inc.
- 10.2.3.1. Company overview
- 10.2.3.2. Financial performance
- 10.2.3.3. Product benchmarking
- 10.2.3.4. Strategic initiatives
- 10.2.4. SparkTrendz,
- 10.2.4.1. Company overview
- 10.2.4.2. Financial performance
- 10.2.4.3. Product benchmarking
- 10.2.4.4. Strategic initiatives
- 10.2.5. Cloudsight, Inc.
- 10.2.5.1. Company overview
- 10.2.5.2. Financial performance
- 10.2.5.3. Product benchmarking
- 10.2.5.4. Strategic initiatives
- 10.2.6. Chooch.com
- 10.2.6.1. Company overview
- 10.2.6.2. Financial performance
- 10.2.6.3. Product benchmarking
- 10.2.6.4. Strategic initiatives
- 10.2.7. Google LLC
- 10.2.7.1. Company overview
- 10.2.7.2. Financial performance
- 10.2.7.3. Product benchmarking
- 10.2.7.4. Strategic initiatives
- 10.2.8. Attrasoft, Inc.
- 10.2.8.1. Company overview
- 10.2.8.2. Financial performance
- 10.2.8.3. Product benchmarking
- 10.2.8.4. Strategic initiatives
- 10.2.9. Catchroom
- 10.2.9.1. Company overview
- 10.2.9.2. Financial performance
- 10.2.9.3. Product benchmarking
- 10.2.9.4. Strategic initiatives
- 10.2.10. Hitachi, Ltd.
- 10.2.10.1. Company overview
- 10.2.10.2. Financial performance
- 10.2.10.3. Product benchmarking
- 10.2.10.4. Strategic initiatives
- 10.2.11. Honeywell International Inc.
- 10.2.11.1. Company overview
- 10.2.11.2. Financial performance
- 10.2.11.3. Product benchmarking
- 10.2.11.4. Strategic initiatives
- 10.2.12. LTU Tech
- 10.2.12.1. Company overview
- 10.2.12.2. Financial performance
- 10.2.12.3. Product benchmarking
- 10.2.12.4. Strategic initiatives
- 10.2.13. NEC Corporation
- 10.2.13.1. Company overview
- 10.2.13.2. Financial performance
- 10.2.13.3. Product benchmarking
- 10.2.13.4. Strategic initiatives
- 10.2.14. Qualcomm Technologies, Inc.
- 10.2.14.1. Company overview
- 10.2.14.2. Financial performance
- 10.2.14.3. Product benchmarking
- 10.2.14.4. Strategic initiatives
- 10.2.15. Slyce Acquisition Inc.
- 10.2.15.1. Company overview
- 10.2.15.2. Financial performance
- 10.2.15.3. Product benchmarking
- 10.2.15.4. Strategic initiatives
- 10.2.1. Blinkfire Analytics, Inc.
