|
|
市場調査レポート
商品コード
1404795
ビジュアライゼーション・3Dレンダリングソフトウェアの世界市場:規模、シェア・動向分析レポート - 展開タイプ別、用途別、エンドユーザー別、地域別、セグメント予測、2023~2030年Visualization And 3D Rendering Software Market Size, Share & Trends Analysis Report By Deployment Type (On-Premises, Cloud), By Application, By End-User, By Region, And Segment Forecasts, 2023 - 2030 |
||||||
|
|
|||||||
カスタマイズ可能
|
|||||||


| ビジュアライゼーション・3Dレンダリングソフトウェアの世界市場:規模、シェア・動向分析レポート - 展開タイプ別、用途別、エンドユーザー別、地域別、セグメント予測、2023~2030年 |
|
出版日: 2023年11月28日
発行: Grand View Research
ページ情報: 英文 101 Pages
納期: 2~10営業日
|

- 全表示
- 概要
- 図表
- 目次
ビジュアライゼーション・3Dレンダリングソフトウェア市場の成長と動向:
世界のビジュアライゼーション・3Dレンダリングソフトウェアの市場規模は、2023~2030年にかけてCAGR 30.6%で推移し、2030年には173億8,000万米ドルに達すると予測されています。
ビジュアライゼーション・シミュレーションのための革新的で費用対効果の高い技術に対するニーズの高まりが、ビジュアライゼーション・3Dレンダリングソフトウェアの採用を加速させています。このソフトウェアは、製品デザインとモデリング、アニメーション、ビジュアライゼーション・シミュレーションなど、さまざまな用途に使用されています。これらのソリューションは、リアルタイムのマーケティング、製品設計、トレーニングなど、さまざまな用途に役立ちます。コスト最適化、時間管理、リアルタイムレビューなどの利点が市場を促進すると予想されます。このソフトウェアは、企業が魅力的でカスタマイズされた製品やサービスを提供することを可能にします。
3Dコンテンツの入手可能性と適切なインフラは、発展に極めて重要な役割を果たしています。北米などの地域では強固なワイヤレス接続が存在し、ビジュアライゼーション・3Dレンダリングソフトウェアの普及を促進しています。したがって、この地域の市場は今後数年間で大幅な成長が見込まれます。さらに、Autodesk, Inc.、Dassault Systemes、Trimble, Inc.、Adobe Systems Incorporatedなどの著名なビジュアライゼーション・3Dレンダリング企業の存在は、市場の成長見通しを補足すると推定されています。
ビジュアライゼーション・3Dレンダリングソフトウェアデバイスの増加に伴い、3Dコンテンツやインフラストラクチャの開発、設計、配信に関する懸念が大幅に増加しています。
ビジュアライゼーション・3Dレンダリングソフトウェア市場のレポートハイライト:
- 用途別に、市場は製品設計とモデリング、アニメーション、ビジュアライゼーション・シミュレーション、その他に区分されます。製品設計とモデリング分野は、2022年に32.8%の最大の収益シェアを占めました。
- エンドユーザーに基づくと、市場はアーキテクチャ、エンジニアリングと建設、ゲーム、ヘルスケア、製造業と自動車、メディア・エンターテインメント、その他に区分されます。
- 北米は、Autodesk, Inc.、Adobe Systems Incorporated、Dassault Systemesなど多くの著名な企業が拠点を置いていることから、市場を独占し、2022年には32.0%の最大収益シェアを占めました。
目次
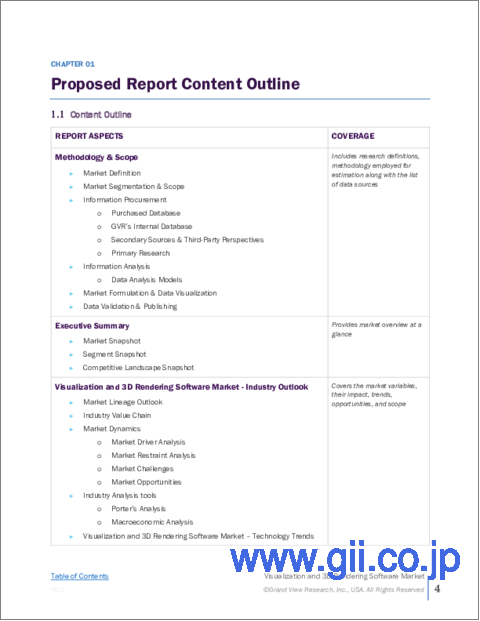
第1章 調査手法と範囲
第2章 エグゼクティブサマリー
第3章 ビジュアライゼーション・3Dレンダリングソフトウェアの市場変数、動向、範囲
- 市場系統の見通し
- 業界のバリューチェーン分析
- 市場力学
- 市場促進要因分析
- 市場抑制要因分析
- 市場機会分析
- ビジュアライゼーション・3Dレンダリングソフトウェア市場分析ツール
- 業界分析 - ポーターのファイブフォース分析
- PESTEL分析
第4章 ビジュアライゼーション・3Dレンダリングソフトウェア市場:展開タイプの推定・動向分析
- ビジュアライゼーション・3Dレンダリングソフトウェア市場:重要なポイント
- ビジュアライゼーション・3Dレンダリングソフトウェア市場:動向と市場シェア分析、2022年・2030年
- オンプレミス
- オンプレミス市場推定・予測、2017~2030年
- クラウド
- クラウド市場推定・予測、2017~2030年
第5章 ビジュアライゼーション・3Dレンダリングソフトウェア市場:用途の推定・動向分析
- ビジュアライゼーション・3Dレンダリングソフトウェア市場:重要なポイント
- ビジュアライゼーション・3Dレンダリングソフトウェア市場:動向と市場シェア分析、2022年・2030年
- 製品設計・モデリング
- 製品設計・モデリング市場推定・予測、2017~2030年
- アニメーション
- アニメーション市場推定・予測、2017~2030年
- ビジュアライゼーション・シミュレーション
- ビジュアライゼーション・シミュレーション市場推定・予測、2017~2030年
- その他
- その他の市場推定・予測、2017~2030年
第6章 ビジュアライゼーション・3Dレンダリングソフトウェア市場:エンドユーザーの推定・動向分析
- ビジュアライゼーション・3Dレンダリングソフトウェア市場:重要なポイント
- ビジュアライゼーション・3Dレンダリングソフトウェア市場:動向と市場シェア分析、2022年・2030年
- アーキテクチャ、エンジニアリング、建設
- アーキテクチャ、エンジニアリング、建設市場推定・予測、2017~2030年
- ゲーム
- ゲーム市場推定・予測、2017~2030年
- ヘルスケア
- ヘルスケア市場推定・予測、2017~2030年
- 製造・自動車
- 製造業・自動車市場推定・予測、2017~2030年
- メディア・エンターテイメント
- メディア・エンターテインメント市場推定・予測、2017~2030年
- その他
- その他の市場推定・予測、2017~2030年
第7章 ビジュアライゼーション・3Dレンダリングソフトウェア市場:地域の推定・動向分析
- 地域別の見通し
- ビジュアライゼーション・3Dレンダリングソフトウェア市場:地域別 - 重要なポイント
- 北米
- 米国
- カナダ
- 欧州
- 英国
- ドイツ
- フランス
- アジア太平洋
- 日本
- 中国
- インド
- オーストラリア
- 韓国
- ラテンアメリカ
- ブラジル
- メキシコ
- 中東・アフリカ
- サウジアラビア
- 南アフリカ
- アラブ首長国連邦
第8章 競合情勢
- 主要市場参入企業による最近の動向と影響分析
- 市場参入企業の分類
- Adobe
- Autodesk Inc.
- Chaos Software EOOD
- Corel Corporation
- Dassault Systemes
- Luxion Inc.
- Next Limit
- Render Legion a.s.
- The Foundry Visionmongers Limited
- TRIMBLE, INC.
List of Tables
- Table 1 List of abbreviation
- Table 2 North America visualization and 3D rendering software market, by deployment type, 2017 - 2030 (USD Million)
- Table 3 North America visualization and 3D rendering software market, by application, 2017 - 2030 (USD Million)
- Table 4 North America visualization and 3D rendering software market, by end-user, 2017 - 2030 (USD Million)
- Table 5 North America visualization and 3D rendering software market, by region, 2017 to 2030 (USD Million)
- Table 6 U.S. visualization and 3D rendering software market, by deployment type, 2017 - 2030 (USD Million)
- Table 7 U.S. visualization and 3D rendering software market, by application, 2017 - 2030 (USD Million)
- Table 8 U.S. visualization and 3D rendering software market, by end-user, 2017 - 2030 (USD Million)
- Table 9 Canada visualization and 3D rendering software market, by deployment type, 2017 - 2030 (USD Million)
- Table 10 Canada visualization and 3D rendering software market, by application, 2017 - 2030 (USD Million)
- Table 11 Canada visualization and 3D rendering software market, by end-user, 2017 - 2030 (USD Million)
- Table 12 Europe visualization and 3D rendering software market, by deployment type, 2017 - 2030 (USD Million)
- Table 13 Europe visualization and 3D rendering software market, by application, 2017 - 2030 (USD Million)
- Table 14 Europe visualization and 3D rendering software market, by end-user, 2017 - 2030 (USD Million)
- Table 15 Europe visualization and 3D rendering software market, by region, 2017 to 2030 (USD Million)
- Table 16 Germany visualization and 3D rendering software market, by deployment type, 2017 - 2030 (USD Million)
- Table 17 Germany visualization and 3D rendering software market, by application, 2017 - 2030 (USD Million)
- Table 18 Germany visualization and 3D rendering software market, by end-user, 2017 - 2030 (USD Million)
- Table 19 UK visualization and 3D rendering software market, by deployment type, 2017 - 2030 (USD Million)
- Table 20 UK visualization and 3D rendering software market, by application, 2017 - 2030 (USD Million)
- Table 21 France visualization and 3D rendering software market, by deployment type, 2017 - 2030 (USD Million)
- Table 22 France visualization and 3D rendering software market, by application, 2017 - 2030 (USD Million)
- Table 23 France visualization and 3D rendering software market, by end-user, 2017 - 2030 (USD Million)
- Table 24 Asia Pacific visualization and 3D rendering software market, by deployment type, 2017 - 2030 (USD Million)
- Table 25 Asia Pacific visualization and 3D rendering software market, by application, 2017 - 2030 (USD Million)
- Table 26 Asia Pacific visualization and 3D rendering software market, by end-user, 2017 - 2030 (USD Million)
- Table 27 Asia Pacific visualization and 3D rendering software market, by region, 2017 to 2030 (USD Million)
- Table 28 China visualization and 3D rendering software market, by deployment type, 2017 - 2030 (USD Million)
- Table 29 China visualization and 3D rendering software market, by application, 2017 - 2030 (USD Million)
- Table 30 China visualization and 3D rendering software market, by end-user, 2017 - 2030 (USD Million)
- Table 31 Japan visualization and 3D rendering software market, by deployment type, 2017 - 2030 (USD Million)
- Table 32 Japan visualization and 3D rendering software market, by application, 2017 - 2030 (USD Million)
- Table 33 Japan visualization and 3D rendering software market, by end-user, 2017 - 2030 (USD Million)
- Table 34 India visualization and 3D rendering software market, by deployment type, 2017 - 2030 (USD Million)
- Table 35 Japan visualization and 3D rendering software market, by application, 2017 - 2030 (USD Million)
- Table 36 India visualization and 3D rendering software market, by end-user, 2017 - 2030 (USD Million)
- Table 37 Australia visualization and 3D rendering software market, by deployment type, 2017 - 2030 (USD Million)
- Table 38 Australia visualization and 3D rendering software market, by application, 2017 - 2030 (USD Million)
- Table 39 Australia visualization and 3D rendering software market, by end-user, 2017 - 2030 (USD Million)
- Table 40 South Korea visualization and 3D rendering software market, by deployment type, 2017 - 2030 (USD Million)
- Table 41 South Korea visualization and 3D rendering software market, by application, 2017 - 2030 (USD Million)
- Table 42 South Korea visualization and 3D rendering software market, by end-user, 2017 - 2030 (USD Million)
- Table 43 Latin America visualization and 3D rendering software market, by deployment type, 2017 - 2030 (USD Million)
- Table 44 Latin America visualization and 3D rendering software market, by application, 2017 - 2030 (USD Million)
- Table 45 Latin America visualization and 3D rendering software market, by end-user, 2017 - 2030 (USD Million)
- Table 46 Latin America visualization and 3D rendering software market, by region, 2017 to 2030 (USD Million)
- Table 47 Brazil visualization and 3D rendering software market, by deployment type, 2017 - 2030 (USD Million)
- Table 48 Brazil visualization and 3D rendering software market, by application, 2017 - 2030 (USD Million)
- Table 49 Brazil visualization and 3D rendering software market, by end-user, 2017 - 2030 (USD Million)
- Table 50 Mexico visualization and 3D rendering software market, by deployment type, 2017 - 2030 (USD Million)
- Table 51 Mexico visualization and 3D rendering software market, by application, 2017 - 2030 (USD Million)
- Table 52 Mexico visualization and 3D rendering software market, by end-user, 2017 - 2030 (USD Million)
- Table 53 Middle East and Africa (MEA)visualization and 3D rendering software market, by deployment type, 2017 - 2030 (USD Million)
- Table 54 Middle East and Africa (MEA)visualization and 3D rendering software market, by application, 2017 - 2030 (USD Million)
- Table 55 Middle East and Africa (MEA) visualization and 3D rendering software market, by end-user, 2017 - 2030 (USD Million)
- Table 56 Middle East and Africa (MEA)visualization and 3D rendering software market, by region, 2017 to 2030 (USD Million)
- Table 57 South Africa visualization and 3D rendering software market, by deployment type, 2017 - 2030 (USD Million)
- Table 58 South Africa visualization and 3D rendering software market, by application, 2017 - 2030 (USD Million)
- Table 59 South Africa visualization and 3D rendering software market, by end-user, 2017 - 2030 (USD Million)
- Table 60 Saudi Arabia visualization and 3D rendering software market, by deployment type, 2017 - 2030 (USD Million)
- Table 61 Saudi Arabia visualization and 3D rendering software market, by application, 2017 - 2030 (USD Million)
- Table 62 Saudi Arabia visualization and 3D rendering software market, by end-user, 2017 - 2030 (USD Million)
- Table 63 United Arab Emirates (UAE) visualization and 3D rendering software market, by deployment type, 2017 - 2030 (USD Million)
- Table 64 United Arab Emirates (UAE) visualization and 3D rendering software market, by application, 2017 - 2030 (USD Million)
- Table 65 United Arab Emirates (UAE) visualization and 3D rendering software market, by end-user, 2017 - 2030 (USD Million)
List of Figures
- Fig. 1 Market research process
- Fig. 2 Data triangulation techniques
- Fig. 3 Primary research pattern
- Fig. 4 Market research approaches
- Fig. 5 Value-chain-based sizing & forecasting
- Fig. 6 QFD modeling for market share assessment
- Fig. 7 Market formulation & validation
- Fig. 8 Visualization and 3D rendering software: Market outlook
- Fig. 9 Visualization and 3D rendering software: Competitive insights
- Fig. 10 Parent market outlook
- Fig. 11 Related/ancillary market outlook
- Fig. 12 Penetration and growth prospect mapping
- Fig. 13 Industry value chain analysis
- Fig. 14 Visualization and 3D rendering software market driver impact
- Fig. 15 Visualization and 3D rendering software market restraint impact
- Fig. 16 Visualization and 3D rendering software market strategic initiatives analysis
- Fig. 17 Visualization and 3D rendering software market: Deployment type movement analysis
- Fig. 18 Visualization and 3D rendering software market: Deployment type outlook and key takeaways
- Fig. 19 On-premises market estimates and forecasts, 2017 - 2030
- Fig. 20 Cloud market estimates and forecasts, 2017 - 2030
- Fig. 21 Visualization and 3D rendering software market: Application outlook and key takeaways
- Fig. 22 Visualization and 3D rendering software market: Application outlook and key takeaways
- Fig. 23 Product design and modeling market estimates and forecasts, 2017 - 2030
- Fig. 24 Animation market estimates and forecasts, 2017 - 2030
- Fig. 25 Visualization & simulation market estimates and forecasts, 2017 - 2030
- Fig. 26 Others market estimates and forecasts, 2017 - 2030
- Fig. 27 Visualization and 3D rendering software market: End-User movement analysis
- Fig. 28 Visualization and 3D rendering software market: End-User outlook and key takeaways
- Fig. 29 Architecture, engineering and construction market estimates and forecasts, 2017 - 2030
- Fig. 30 Gaming market estimates and forecasts, 2017 - 2030
- Fig. 31 Healthcare market estimates and forecasts, 2017 - 2030
- Fig. 32 Manufacturing and automotive market estimates and forecasts, 2017 - 2030
- Fig. 33 Media & entertainment market estimates and forecasts, 2017 - 2030
- Fig. 34 Others market estimates and forecasts, 2017 - 2030
- Fig. 35 Global visualization and 3D rendering software market: Regional movement analysis
- Fig. 36 Global visualization and 3D rendering software market: Regional outlook and key takeaways
- Fig. 37 North America market estimates and forecasts, 2017 - 2030
- Fig. 38 U.S. market estimates and forecasts, 2017 - 2030
- Fig. 39 Canada market estimates and forecasts, 2017 - 2030
- Fig. 40 Europe market estimates and forecasts, 2017 - 2030
- Fig. 41 UK market estimates and forecasts, 2017 - 2030
- Fig. 42 Germany market estimates and forecasts, 2017 - 2030
- Fig. 43 France market estimates and forecasts, 2017 - 2030
- Fig. 44 Asia Pacific market estimates and forecasts, 2017 - 2030
- Fig. 45 Japan market estimates and forecasts, 2017 - 2030
- Fig. 46 China market estimates and forecasts, 2017 - 2030
- Fig. 47 India market estimates and forecasts, 2017 - 2030
- Fig. 48 Australia market estimates and forecasts, 2017 - 2030
- Fig. 49 South Korea market estimates and forecasts, 2017 - 2030
- Fig. 50 Latin America market estimates and forecasts, 2017 - 2030
- Fig. 51 Brazil market estimates and forecasts, 2017 - 2030
- Fig. 52 Mexico market estimates and forecasts, 2017 - 2030
- Fig. 53 Middle East and Africa market estimates and forecasts, 2017 - 2030
- Fig. 54 Saudi Arabia market estimates and forecasts, 2017 - 2030
- Fig. 55 South Africa market estimates and forecasts, 2017 - 2030
- Fig. 56 United Arab Emirates (UAE) market estimates and forecasts, 2017 - 2030
Visualization And 3D Rendering Software Market Growth & Trends:
The global visualization and 3D rendering software market size is projected to reach USD 17.38 billion by 2030, according to a study conducted by Grand View Research, Inc., progressing at a CAGR of 30.6% from 2023 to 2030. Rising need for innovative and cost-effective technologies for visualization and simulation is revving up the adoption of visualization & 3D rendering software. The software is used for various applications such as product design & modeling, animation, and visualization & simulation. These solutions help in real-time marketing, product designing, and training among several other applications. Benefits such as cost optimization, time management, and real-time reviewing are expected to propel the market. The software allows enterprises to provide attractive and customized products and services.
Availability of 3D content and proper infrastructure play a pivotal role in the development of the market. Presence of a robust wireless connectivity in regions such as North America has facilitated widespread adoption of visualization & 3D rendering software. Hence, the regional market is anticipated to witness substantial growth over the coming years. Additionally, presence of prominent visualization & 3D rendering companies such as Autodesk, Inc.; Dassault Systemes; Trimble, Inc.; and Adobe Systems Incorporated is estimated to supplement growth prospects of the market.
With rising number ofvisualization & 3D rendering software devices augmenting the market, there has been significant rise in concerns related to development, design, and delivery of 3D content and infrastructure.
Visualization And 3D Rendering Software Market Report Highlights:
- Based on application, the market is segmented into product design and modeling, animation, visualization & simulation, and others. The product design and modeling segment accounted for the largest revenue share of 32.8% in 2022.
- Based on end-user, the market is segmented into architecture, engineering and construction, gaming, healthcare, manufacturing and automotive, media & entertainment, and others.
- North America dominated the market and accounted for the largest revenue share of 32.0% in 2022, owing to the domicile of many prominent players such as Autodesk, Inc.; Adobe Systems Incorporated; and Dassault Systemes.
Table of Contents
Chapter 1. Methodology and Scope
- 1.1. Market Segmentation & Scope
- 1.1.1. Deployment type
- 1.1.2. Application
- 1.1.3. End-user
- 1.1.4. Regional scope
- 1.1.5. Estimates and forecast timeline
- 1.2. Research Methodology
- 1.3. Information Procurement
- 1.3.1. Purchased database
- 1.3.2. GVR's internal database
- 1.3.3. Secondary sources
- 1.3.4. Primary research
- 1.3.5. Details of primary research
- 1.4. Information or Data Analysis
- 1.5. Market Formulation & Validation
- 1.6. Model Details
- 1.7. List of Secondary Sources
- 1.8. List of Primary Sources
- 1.9. Objectives
Chapter 2. Executive Summary
- 2.1. Market Outlook
- 2.2. Segment Outlook
- 2.2.1. Deployment type outlook
- 2.2.2. Application outlook
- 2.2.3. End-user outlook
- 2.2.4. Regional outlook
- 2.3. Competitive Insights
Chapter 3. Visualization and 3D Rendering Software Market Variables, Trends & Scope
- 3.1. Market Lineage Outlook
- 3.2. Industry Value Chain Analysis
- 3.3. Market Dynamics
- 3.3.1. Market driver analysis
- 3.3.2. Market restraint analysis
- 3.3.3. Market opportunity analysis
- 3.4. Visualization and 3D Rendering Software Market Analysis Tools
- 3.4.1. Industry analysis - Porter's
- 3.4.1.1. Supplier power
- 3.4.1.2. Buyer power
- 3.4.1.3. Substitution threat
- 3.4.1.4. Threat of new entrant
- 3.4.1.5. Competitive rivalry
- 3.4.2. PESTEL analysis
- 3.4.2.1. Political landscape
- 3.4.2.2. Technological landscape
- 3.4.2.3. Economic landscape
- 3.4.1. Industry analysis - Porter's
Chapter 4. Visualization and 3D Rendering Software Market: Deployment Type Estimates & Trend Analysis
- 4.1. Visualization and 3D Rendering Software Market: Key Takeaways
- 4.2. Visualization and 3D Rendering Software Market: Movement & Market Share Analysis, 2022 & 2030
- 4.3. On-Premises
- 4.3.1. On-premises market estimates and forecasts, 2017 to 2030 (USD Million)
- 4.4. Cloud
- 4.4.1. Cloud market estimates and forecasts, 2017 to 2030 (USD Million)
Chapter 5. Visualization and 3D Rendering Software Market: Application Estimates & Trend Analysis
- 5.1. Visualization and 3D Rendering Software Market: Key Takeaways
- 5.2. Visualization and 3D Rendering Software Market: Movement & Market Share Analysis, 2022 & 2030
- 5.3. Product Design and Modeling
- 5.3.1. Product design and modeling market estimates and forecasts, 2017 to 2030 (USD Million)
- 5.4. Animation
- 5.4.1. Animation market estimates and forecasts, 2017 to 2030 (USD Million)
- 5.5. Visualization & Simulation
- 5.5.1. Visualization & simulation market estimates and forecasts, 2017 to 2030 (USD Million)
- 5.6. Others
- 5.6.1. Others market estimates and forecasts, 2017 to 2030 (USD Million)
Chapter 6. Visualization and 3D Rendering Software Market: End-User Estimates & Trend Analysis
- 6.1. Visualization and 3D Rendering Software Market: Key Takeaways
- 6.2. Visualization and 3D Rendering Software Market: Movement & Market Share Analysis, 2022 & 2030
- 6.3. Architecture, Engineering and Construction
- 6.3.1. Architecture, engineering and construction market estimates and forecasts, 2017 to 2030 (USD Million)
- 6.4. Gaming
- 6.4.1. Gaming market estimates and forecasts, 2017 to 2030 (USD Million)
- 6.5. Healthcare
- 6.5.1. Healthcare market estimates and forecasts, 2017 to 2030 (USD Million)
- 6.6. Manufacturing and Automotive
- 6.6.1. Manufacturing and Automotive market estimates and forecasts, 2017 to 2030 (USD Million)
- 6.7. Media & Entertainment
- 6.7.1. Media & entertainment market estimates and forecasts, 2017 to 2030 (USD Million)
- 6.8. Others
- 6.8.1. Others market estimates and forecasts, 2017 to 2030 (USD Million)
Chapter 7. Visualization and 3D Rendering Software Market: Regional Estimates & Trend Analysis
- 7.1. Regional Outlook
- 7.2. Visualization and 3D Rendering Software Market by Region: Key Takeaway
- 7.3. North America
- 7.3.1. Market estimates and forecasts, 2017 to 2030 (Revenue, USD Million)
- 7.3.2. U.S.
- 7.3.2.1. Market estimates and forecasts, 2017 to 2030 (Revenue, USD Million)
- 7.3.3. Canada
- 7.3.3.1. Market estimates and forecasts, 2017 to 2030 (Revenue, USD Million)
- 7.4. Europe
- 7.4.1. UK
- 7.4.1.1. Market estimates and forecasts, 2017 to 2030 (Revenue, USD Million)
- 7.4.2. Germany
- 7.4.2.1. Market estimates and forecasts, 2017 to 2030 (Revenue, USD Million)
- 7.4.3. France
- 7.4.3.1. Market estimates and forecasts, 2017 to 2030 (Revenue, USD Million)
- 7.4.1. UK
- 7.5. Asia Pacific
- 7.5.1. Japan
- 7.5.1.1. Market estimates and forecasts, 2017 to 2030 (Revenue, USD Million)
- 7.5.2. China
- 7.5.2.1. Market estimates and forecasts, 2017 to 2030 (Revenue, USD Million)
- 7.5.3. India
- 7.5.3.1. Market estimates and forecasts, 2017 to 2030 (Revenue, USD Million)
- 7.5.4. Australia
- 7.5.4.1. Market estimates and forecasts, 2017 to 2030 (Revenue, USD Million)
- 7.5.5. South Korea
- 7.5.5.1. Market estimates and forecasts, 2017 to 2030 (Revenue, USD Million)
- 7.5.1. Japan
- 7.6. Latin America
- 7.6.1. Brazil
- 7.6.1.1. Market estimates and forecasts, 2017 to 2030 (Revenue, USD Million)
- 7.6.2. Mexico
- 7.6.2.1. Market estimates and forecasts, 2017 to 2030 (Revenue, USD Million)
- 7.6.1. Brazil
- 7.7. MEA
- 7.7.1. Saudi Arabia
- 7.7.1.1. Market estimates and forecasts, 2017 to 2030 (Revenue, USD Million)
- 7.7.2. South Africa
- 7.7.2.1. Market estimates and forecasts, 2017 to 2030 (Revenue, USD Million)
- 7.7.3. United Arab Emirates (UAE)
- 7.7.3.1. Market estimates and forecasts, 2017 to 2030 (Revenue, USD Million)
- 7.7.1. Saudi Arabia
Chapter 8. Competitive Landscape
- 8.1. Recent Developments & Impact Analysis, By Key Market Participants
- 8.2. Market Participant Categorization
- 8.2.1. Adobe
- 8.2.1.1. Company overview
- 8.2.1.2. Financial performance
- 8.2.1.3. Product benchmarking
- 8.2.1.4. Strategic initiatives
- 8.2.2. Autodesk Inc.
- 8.2.2.1. Company overview
- 8.2.2.2. Financial performance
- 8.2.2.3. Product benchmarking
- 8.2.2.4. Strategic initiatives
- 8.2.3. Chaos Software EOOD
- 8.2.3.1. Company overview
- 8.2.3.2. Financial performance
- 8.2.3.3. Product benchmarking
- 8.2.3.4. Strategic initiatives
- 8.2.4. Corel Corporation
- 8.2.4.1. Company overview
- 8.2.4.2. Financial performance
- 8.2.4.3. Product benchmarking
- 8.2.4.4. Strategic initiatives
- 8.2.5. Dassault Systemes
- 8.2.5.1. Company overview
- 8.2.5.2. Financial performance
- 8.2.5.3. Product benchmarking
- 8.2.5.4. Strategic initiatives
- 8.2.6. Luxion Inc.
- 8.2.6.1. Company overview
- 8.2.6.2. Financial performance
- 8.2.6.3. Product benchmarking
- 8.2.6.4. Strategic initiatives
- 8.2.7. Next Limit
- 8.2.7.1. Company overview
- 8.2.7.2. Financial performance
- 8.2.7.3. Product benchmarking
- 8.2.7.4. Strategic initiatives
- 8.2.8. Render Legion a.s.
- 8.2.8.1. Company overview
- 8.2.8.2. Financial performance
- 8.2.8.3. Product benchmarking
- 8.2.8.4. Strategic initiatives
- 8.2.9. The Foundry Visionmongers Limited
- 8.2.9.1. Company overview
- 8.2.9.2. Financial performance
- 8.2.9.3. Product benchmarking
- 8.2.9.4. Strategic initiatives
- 8.2.10. TRIMBLE, INC.
- 8.2.10.1. Company overview
- 8.2.10.2. Financial performance
- 8.2.10.3. Product benchmarking
- 8.2.10.4. Strategic initiatives
- 8.2.1. Adobe
