|
|
市場調査レポート
商品コード
1609601
プラスミドDNA製造の市場規模、シェア、動向分析レポート:疾患別、グレード別、用途別、開発フェーズ別、地域別、セグメント予測、2025年~2030年Plasmid DNA Manufacturing Market Size, Share & Trends Analysis Report By Disease (Cancer, Infectious Diseases), By Grade (R&D, GMP), By Application, By Development Phase, By Region, And Segment Forecasts, 2025 - 2030 |
||||||
|
|||||||
カスタマイズ可能
|
|||||||

| プラスミドDNA製造の市場規模、シェア、動向分析レポート:疾患別、グレード別、用途別、開発フェーズ別、地域別、セグメント予測、2025年~2030年 |
|
出版日: 2024年11月07日
発行: Grand View Research
ページ情報: 英文 110 Pages
納期: 2~10営業日
|

全表示
- 概要
- 図表
- 目次
プラスミドDNA製造市場の成長と動向:
Grand View Research, Inc.の最新レポートによると、世界のプラスミドDNA製造の市場規模は2030年までに67億米ドルに達し、2025年から2030年にかけて21.44%のCAGRで拡大すると予測されています。
慢性疾患の有病率の上昇とヘルスケア産業におけるプラスミドDNAの幅広い応用範囲が相まって、業界の成長を促進すると予想されています。プラスミドDNAは、ワクチン抗原の生産や遺伝子治療などの治療用途に直接使用することができます。さらに、遺伝子クローニングや遺伝子マッピングなど、さまざまな研究目的にも利用できます。遺伝子治療を選択する患者数の増加は、今後数年間の業界の成長を促進すると予想されます。
clinicaltrials.govによると、世界のパイプラインプログラム(第I相試験から第III相試験)全体の細胞&遺伝子治療の数は、2018年の289から2022年には327に増加しました。さらに、米国FDAは、製品製造に関するいくつかの政策を通じて、先端治療分野の技術革新を常に支援しています。細胞・遺伝子治療製品の増加に伴い、業界ではプラスミドDNAを大規模に製造する必要性が高まると思われます。COVID-19パンデミックは業界の成長にプラスの影響を与えると予想されます。例えば、2021年9月、インドは最初のCOVID-19 DNAワクチンを承認しました。これはMission COVID Surakshaの一環としてDBT-BIRACと提携して製造された世界初のCOVID-19 DNAワクチンです。
円形DNAは、COVID-19感染を予防するインドのZyCoV-Dワクチン接種に使用されています。さらに、世界の業界の主要企業は、市場での存在感を高めるために様々な戦略的取り組みを行っており、これも成長を促進すると予想されます。例えば、2022年6月、バイオシナは、CDMOサービスの提供に新たな専用GMPスイートでのプラスミドDNA生産の拡大を発表しました。このスイートは、最大300Lのシングルユース発酵容量と適切なスケールの下流処理機械を備えています。
プラスミドDNA製造市場レポートハイライト
- MPグレードのプラスミドDNA製造は、2024年に86.29%のシェアで市場を独占し、予測期間中に最も速いCAGRで成長すると予想されます。
- 臨床治療薬セグメントは2024年に54.6%の最大市場シェアを占めました。プラスミドDNAは現在、遺伝子ワクチン接種と遺伝子治療の臨床研究用途で重要性を増しています。
- 細胞・遺伝子治療分野は、2024年に54.4%の最大市場シェアを占めました。この高いシェアは、遺伝子治療が遺伝性疾患や遺伝性疾患の治療に広く応用されていることに起因しています。
- がん分野は、2024年に40.0%の最大市場シェアを占め、2025年から2030年にかけて最も速いCAGRが期待されています。
- 北米プラスミドDNA製造市場は、2024年に世界市場の43.43%という最大の売上シェアを占めました。
目次
第1章 調査手法と範囲
第2章 エグゼクティブサマリー
第3章 市場の変数、動向、範囲
- 市場系統の見通し
- 親市場の見通し
- 関連/補助市場見通し
- 市場動向と展望
- 市場力学
- 遺伝子治療を選択する患者数の増加
- 遺伝子治療のための強力なパイプライン
- 競争の激しい市場と市場参入企業によるさまざまな戦略
- さまざまな医療治療におけるプラスミドDNAの需要増加
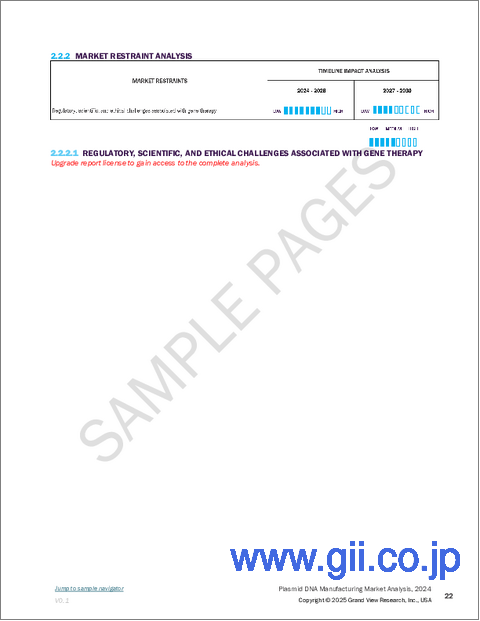
- 市場抑制要因分析
- 遺伝子治療に関連する規制、科学、倫理上の課題
- ビジネス環境分析
- PESTEL分析
- ポーターのファイブフォース分析
- COVID-19の影響分析
第4章 グレード別ビジネス分析
- セグメントダッシュボード
- 世界のプラスミドDNA製造市場の変動分析
- 世界のプラスミドDNA製造市場の規模と動向分析、2018年から2030年
- R&Dグレード
- ウイルスベクターの開発
- mRNAの開発
- 抗体開発
- DNAワクチン開発
- その他
- GMPグレード
第5章 開発フェーズ別ビジネス分析
- セグメントダッシュボード
- 世界のプラスミドDNA製造市場の変動分析
- 世界のプラスミドDNA製造市場の規模と動向分析、2018年から2030年
- 前臨床治療
- 臨床治療
- 上市済み治療薬
第6章 用途別ビジネス分析
- セグメントダッシュボード
- 世界のプラスミドDNA製造市場の変動分析
- 世界のプラスミドDNA製造市場の規模と動向分析、2018年から2030年
- DNAワクチン
- 細胞・遺伝子治療
- 免疫療法
- その他
第7章 疾患別ビジネス分析
- セグメントダッシュボード
- 世界のプラスミドDNA製造市場の変動分析
- 世界のプラスミドDNA製造市場の規模と動向分析、2018年から2030年
- 感染症
- がん
- 遺伝性疾患
- その他
第8章 グレード、開発段階、疾患、用途別の地域推定・動向分析
- 地域市場ダッシュボード
- 世界のプラスミドDNA製造市場シェア(地域別)、2024年および2030年
- 北米
- 北米のプラスミドDNA製造市場、2018年-2030年
- 米国
- カナダ
- メキシコ
- 欧州
- 欧州のプラスミドDNA製造市場、2018年-2030年
- ドイツ
- 英国
- フランス
- イタリア
- スペイン
- デンマーク
- スウェーデン
- ノルウェー
- アジア太平洋
- アジア太平洋地域のプラスミドDNA製造市場、2018年-2030年
- 日本
- 中国
- インド
- 韓国
- オーストラリア
- タイ
- ラテンアメリカ
- ラテンアメリカのプラスミドDNA製造市場、2018年-2030年
- ブラジル
- アルゼンチン
- 中東・アフリカ
- 中東・アフリカプラスミドDNA製造市場、2018年-2030年
- 南アフリカ
- サウジアラビア
- アラブ首長国連邦
- クウェート
第9章 競合情勢
- 参入企業
- 企業市況分析、2024年
- 参入企業の概要
- Charles River Laboratories
- Danaher
- VGXI, Inc.
- Kaneka Corp.
- Lonza
- Nature Technology
- Cell and Gene Therapy Catapult
- Eurofins Genomics
- Luminous BioSciences, LLC
- Akron Biotech
List of Tables
- Table 1 List Of Secondary Sources
- Table 2 List Of Abbreviations
- Table 3 Global Plasmid DNA Manufacturing Market by Grade, 2018 - 2030 (USD million)
- Table 4 Global Plasmid DNA Manufacturing Market by Development Phase, 2018 - 2030 (USD million)
- Table 5 Global Plasmid DNA Manufacturing Market by Application, 2018 - 2030 (USD million)
- Table 6 Global Plasmid DNA Manufacturing Market by Disease, 2018 - 2030 (USD million)
- Table 7 North America Plasmid DNA Manufacturing Market by Grade, 2018 - 2030 (USD million)
- Table 8 North America Plasmid DNA Manufacturing Market by Development Phase, 2018 - 2030 (USD million)
- Table 9 North America Plasmid DNA Manufacturing Market by Application, 2018 - 2030 (USD million)
- Table 10 North America Plasmid DNA Manufacturing Market by Disease, 2018 - 2030 (USD million)
- Table 11 North America Plasmid DNA Manufacturing Market by Country, 2018 - 2030 (USD million)
- Table 12 U.S. Plasmid DNA Manufacturing Market by Grade, 2018 - 2030 (USD million)
- Table 13 U.S. Plasmid DNA Manufacturing Market by Development Phase, 2018 - 2030 (USD million)
- Table 14 U.S. Plasmid DNA Manufacturing Market by Application, 2018 - 2030 (USD million)
- Table 15 U.S. Plasmid DNA Manufacturing Market by Disease, 2018 - 2030 (USD million)
- Table 16 Canada Plasmid DNA Manufacturing Market by Development Phase, 2018 - 2030 (USD million)
- Table 17 Canada Plasmid DNA Manufacturing Market by Development Phase, 2018 - 2030 (USD million)
- Table 18 Canada Plasmid DNA Manufacturing Market by Application, 2018 - 2030 (USD million)
- Table 19 Canada Plasmid DNA Manufacturing Market by Disease, 2018 - 2030 (USD million)
- Table 20 Mexico Plasmid DNA Manufacturing Market by Grade, 2018 - 2030 (USD million)
- Table 21 Mexico Plasmid DNA Manufacturing Market by Development Phase, 2018 - 2030 (USD million)
- Table 22 Mexico Plasmid DNA Manufacturing Market by Application, 2018 - 2030 (USD million)
- Table 23 Mexico Plasmid DNA Manufacturing Market by Disease, 2018 - 2030 (USD million)
- Table 24 Europe Plasmid DNA Manufacturing Market by Grade, 2018 - 2030 (USD million)
- Table 25 Europe Plasmid DNA Manufacturing Market by Development Phase, 2018 - 2030 (USD million)
- Table 26 Europe Plasmid DNA Manufacturing Market by Application, 2018 - 2030 (USD million)
- Table 27 Europe Plasmid DNA Manufacturing Market by Disease, 2018 - 2030 (USD million)
- Table 28 Europe Plasmid DNA Manufacturing Market by Country, 2018 - 2030 (USD million)
- Table 29 U.K. Plasmid DNA Manufacturing Market by Grade, 2018 - 2030 (USD million)
- Table 30 U.K. Plasmid DNA Manufacturing Market by Development Phase, 2018 - 2030 (USD million)
- Table 31 U.K. Plasmid DNA Manufacturing Market by Application, 2018 - 2030 (USD million)
- Table 32 U.K. Plasmid DNA Manufacturing Market by Disease, 2018 - 2030 (USD million)
- Table 33 Germany Plasmid DNA Manufacturing Market by Grade, 2018 - 2030 (USD million)
- Table 34 Germany Plasmid DNA Manufacturing Market by Development Phase, 2018 - 2030 (USD million)
- Table 35 Germany Plasmid DNA Manufacturing Market by Application, 2018 - 2030 (USD million)
- Table 36 Germany Plasmid DNA Manufacturing Market by Disease, 2018 - 2030 (USD million)
- Table 37 France Plasmid DNA Manufacturing Market by Grade, 2018 - 2030 (USD million)
- Table 38 France Plasmid DNA Manufacturing Market by Development Phase, 2018 - 2030 (USD million)
- Table 39 France Plasmid DNA Manufacturing Market by Application, 2018 - 2030 (USD million)
- Table 40 France Plasmid DNA Manufacturing Market by Disease, 2018 - 2030 (USD million)
- Table 41 Italy Plasmid DNA Manufacturing Market by Grade, 2018 - 2030 (USD million)
- Table 42 Italy Plasmid DNA Manufacturing Market by Development Phase, 2018 - 2030 (USD million)
- Table 43 Italy Plasmid DNA Manufacturing Market by Application, 2018 - 2030 (USD million)
- Table 44 Italy Plasmid DNA Manufacturing Market by Disease, 2018 - 2030 (USD million)
- Table 45 Spain Plasmid DNA Manufacturing Market by Grade, 2018 - 2030 (USD million)
- Table 46 Spain Plasmid DNA Manufacturing Market by Development Phase, 2018 - 2030 (USD million)
- Table 47 Spain Plasmid DNA Manufacturing Market by Application, 2018 - 2030 (USD million)
- Table 48 Spain Plasmid DNA Manufacturing Market by Disease, 2018 - 2030 (USD million)
- Table 49 Denmark Plasmid DNA Manufacturing Market by Grade, 2018 - 2030 (USD million)
- Table 50 Denmark Plasmid DNA Manufacturing Market by Development Phase, 2018 - 2030 (USD million)
- Table 51 Denmark Plasmid DNA Manufacturing Market by Application, 2018 - 2030 (USD million)
- Table 52 Denmark Plasmid DNA Manufacturing Market by Disease, 2018 - 2030 (USD million)
- Table 53 Sweden Plasmid DNA Manufacturing Market by Grade, 2018 - 2030 (USD million)
- Table 54 Sweden Plasmid DNA Manufacturing Market by Development Phase, 2018 - 2030 (USD million)
- Table 55 Sweden Plasmid DNA Manufacturing Market by Application, 2018 - 2030 (USD million)
- Table 56 Sweden Plasmid DNA Manufacturing Market by Disease, 2018 - 2030 (USD million)
- Table 57 Norway Plasmid DNA Manufacturing Market by Grade, 2018 - 2030 (USD million)
- Table 58 Norway Plasmid DNA Manufacturing Market by Development Phase, 2018 - 2030 (USD million)
- Table 59 Norway Plasmid DNA Manufacturing Market by Application, 2018 - 2030 (USD million)
- Table 60 Norway Plasmid DNA Manufacturing Market by Disease, 2018 - 2030 (USD million)
- Table 61 Asia Pacific Plasmid DNA Manufacturing Market by Grade, 2018 - 2030 (USD million)
- Table 62 Asia Pacific Plasmid DNA Manufacturing Market by Development Phase, 2018 - 2030 (USD million)
- Table 63 Asia Pacific Plasmid DNA Manufacturing Market by Application, 2018 - 2030 (USD million)
- Table 64 Asia Pacific Plasmid DNA Manufacturing Market by Disease, 2018 - 2030 (USD million)
- Table 65 Asia Pacific Plasmid DNA Manufacturing Market by Country, 2018 - 2030 (USD million)
- Table 66 China Plasmid DNA Manufacturing Market by Grade, 2018 - 2030 (USD million)
- Table 67 China Plasmid DNA Manufacturing Market by Development Phase, 2018 - 2030 (USD million)
- Table 68 China Plasmid DNA Manufacturing Market by Application, 2018 - 2030 (USD million)
- Table 69 China Plasmid DNA Manufacturing Market by Disease, 2018 - 2030 (USD million)
- Table 70 Japan Plasmid DNA Manufacturing Market by Grade, 2018 - 2030 (USD million)
- Table 71 Japan Plasmid DNA Manufacturing Market by Development Phase, 2018 - 2030 (USD million)
- Table 72 Japan Plasmid DNA Manufacturing Market by Application, 2018 - 2030 (USD million)
- Table 73 Japan Plasmid DNA Manufacturing Market by Disease, 2018 - 2030 (USD million)
- Table 74 India Plasmid DNA Manufacturing Market by Grade, 2018 - 2030 (USD million)
- Table 75 India Plasmid DNA Manufacturing Market by Development Phase, 2018 - 2030 (USD million)
- Table 76 India Plasmid DNA Manufacturing Market by Application, 2018 - 2030 (USD million)
- Table 77 India Plasmid DNA Manufacturing Market by Disease, 2018 - 2030 (USD million)
- Table 78 South Korea Plasmid DNA Manufacturing Market by Grade, 2018 - 2030 (USD million)
- Table 79 South Korea Plasmid DNA Manufacturing Market by Development Phase, 2018 - 2030 (USD million)
- Table 80 South Korea Plasmid DNA Manufacturing Market by Application, 2018 - 2030 (USD million)
- Table 81 South Korea Plasmid DNA Manufacturing Market by Disease, 2018 - 2030 (USD million)
- Table 82 Australia Plasmid DNA Manufacturing Market by Grade, 2018 - 2030 (USD million)
- Table 83 Australia Plasmid DNA Manufacturing Market by Development Phase, 2018 - 2030 (USD million)
- Table 84 Australia Plasmid DNA Manufacturing Market by Application, 2018 - 2030 (USD million)
- Table 85 Australia Plasmid DNA Manufacturing Market by Disease, 2018 - 2030 (USD million)
- Table 86 Thailand Plasmid DNA Manufacturing Market by Grade, 2018 - 2030 (USD million)
- Table 87 Thailand Plasmid DNA Manufacturing Market by Development Phase, 2018 - 2030 (USD million)
- Table 88 Thailand Plasmid DNA Manufacturing Market by Application, 2018 - 2030 (USD million)
- Table 89 Thailand Plasmid DNA Manufacturing Market by Disease, 2018 - 2030 (USD million)
- Table 90 Latin America Plasmid DNA Manufacturing Market by Grade, 2018 - 2030 (USD million)
- Table 91 Latin America Plasmid DNA Manufacturing Market by Development Phase, 2018 - 2030 (USD million)
- Table 92 Latin America Plasmid DNA Manufacturing Market by Application, 2018 - 2030 (USD million)
- Table 93 Latin America Plasmid DNA Manufacturing Market by Disease, 2018 - 2030 (USD million)
- Table 94 Latin America Plasmid DNA Manufacturing Market by Country, 2018 - 2030 (USD million)
- Table 95 Brazil Plasmid DNA Manufacturing Market by Grade, 2018 - 2030 (USD million)
- Table 96 Brazil Plasmid DNA Manufacturing Market by Development Phase, 2018 - 2030 (USD million)
- Table 97 Brazil Plasmid DNA Manufacturing Market by Application, 2018 - 2030 (USD million)
- Table 98 Brazil Plasmid DNA Manufacturing Market by Disease, 2018 - 2030 (USD million)
- Table 99 Argentina Plasmid DNA Manufacturing Market by Grade, 2018 - 2030 (USD million)
- Table 100 Argentina Plasmid DNA Manufacturing Market by Development Phase, 2018 - 2030 (USD million)
- Table 101 Argentina Plasmid DNA Manufacturing Market by Applicationr, 2018 - 2030 (USD million)
- Table 102 Argentina Plasmid DNA Manufacturing Market by Disease, 2018 - 2030 (USD million)
- Table 103 Middle East & Africa Plasmid DNA Manufacturing Market by Grade, 2018 - 2030 (USD million)
- Table 104 Middle East & Africa Plasmid DNA Manufacturing Market by Development Phase, 2018 - 2030 (USD million)
- Table 105 Middle East & Africa Plasmid DNA Manufacturing Market by Application, 2018 - 2030 (USD million)
- Table 106 Middle East & Africa Plasmid DNA Manufacturing Market by Disease, 2018 - 2030 (USD million)
- Table 107 Middle East & Africa Plasmid DNA Manufacturing Market by Country, 2018 - 2030 (USD million)
- Table 108 South Africa Plasmid DNA Manufacturing Market by Grade, 2018 - 2030 (USD million)
- Table 109 South Africa Plasmid DNA Manufacturing Market by Development Phase, 2018 - 2030 (USD million)
- Table 110 South Africa Plasmid DNA Manufacturing Market by Application, 2018 - 2030 (USD million)
- Table 111 South Africa Plasmid DNA Manufacturing Market by Disease, 2018 - 2030 (USD million)
- Table 112 Saudi Arabia Plasmid DNA Manufacturing Market by Grade, 2018 - 2030 (USD million)
- Table 113 Saudi Arabia Plasmid DNA Manufacturing Market by Development Phase, 2018 - 2030 (USD million)
- Table 114 Saudi Arabia Plasmid DNA Manufacturing Market by Application, 2018 - 2030 (USD million)
- Table 115 Saudi Arabia Plasmid DNA Manufacturing Market by Disease, 2018 - 2030 (USD million)
- Table 116 UAE Plasmid DNA Manufacturing Market by Grade, 2018 - 2030 (USD million)
- Table 117 UAE Plasmid DNA Manufacturing Market by Development Phase, 2018 - 2030 (USD million)
- Table 118 UAE Plasmid DNA Manufacturing Market by Application, 2018 - 2030 (USD million)
- Table 119 UAE Plasmid DNA Manufacturing Market by Disease, 2018 - 2030 (USD million)
- Table 120 Kuwait Plasmid DNA Manufacturing Market by Grade, 2018 - 2030 (USD million)
- Table 121 Kuwait Plasmid DNA Manufacturing Market by Development Phase, 2018 - 2030 (USD million)
- Table 122 Kuwait Plasmid DNA Manufacturing Market By Application, 2018 - 2030 (USD Million)
- Table 123 Kuwait Plasmid DNA Manufacturing Market by Disease, 2018 - 2030 (USD million)
- Table 124 Participant's Overview
- Table 125 Financial Performance
- Table 126 Key Companies Undergoing Expansions
- Table 127 Key Companies Undergoing Acquisitions
- Table 128 Key Companies Undergoing Collaborations
- Table 129 Key Companies Launching New Products/Services
- Table 130 Key Companies Undergoing Partnerships
- Table 131 Key Companies Undertaking Other Strategies
List of Figures
- Figure 1. Global plasmid DNA manufacturing market segmentation
- Figure 2. Market research process
- Figure 3. Data triangulation techniques
- Figure 4. Primary research pattern
- Figure 5. Market research approaches
- Figure 6. Market formulation & validation
- Figure 7. Market outlook
- Figure 8. Segment snapshot
- Figure 9. Competitive landscape snapshot
- Figure 10. Parent market outlook
- Figure 11. Global plasmid DNA manufacturing market driver analysis
- Figure 12. Global plasmid DNA manufacturing market restraint analysis
- Figure 13. Global plasmid DNA manufacturing market: Porter's analysis
- Figure 14. Global plasmid DNA manufacturing market: PESTEL analysis
- Figure 15. Global plasmid DNA manufacturing market: Grade outlook and key takeaways
- Figure 16. Global plasmid DNA manufacturing market: Grade movement analysis
- Figure 17. Global R&D grade market, 2018 - 2030 (USD million)
- Figure 18. Global viral vector development market, 2018 - 2030 (USD million)
- Figure 19. Global mRNA development market, 2018 - 2030 (USD million)
- Figure 20. Global antibody development market, 2018 - 2030 (USD million)
- Figure 21. Global DNA vaccine development market, 2018 - 2030 (USD million)
- Figure 22. Global others market, 2018 - 2030 (USD million)
- Figure 23. Global AAV market, 2018 - 2030 (USD million)
- Figure 24. Global lentivirus market, 2018 - 2030 (USD million)
- Figure 25. Global adenovirus market, 2018 - 2030 (USD million)
- Figure 26. Global retrovirus market, 2018 - 2030 (USD million)
- Figure 27. Global GMP grade market, 2018 - 2030 (USD million)
- Figure 28. Global others market, 2018 - 2030 (USD million)
- Figure 29. Global plasmid DNA manufacturing market: Development phase outlook and key takeaways
- Figure 30. Global plasmid DNA manufacturing market: Development phase movement analysis
- Figure 31. Global pre-clinical therapeutics market, 2018 - 2030 (USD million)
- Figure 32. Global clinical therapeutics market, 2018 - 2030 (USD million)
- Figure 33. Global marketed therapeutics market, 2018 - 2030 (USD million)
- Figure 34. Global plasmid DNA manufacturing market: Application outlook and key takeaways
- Figure 35. Global plasmid DNA manufacturing market: Application movement analysis
- Figure 36. Global DNA vaccines market, 2018 - 2030 (USD million)
- Figure 37. Global cell & gene therapy market, 2018 - 2030 (USD million)
- Figure 38. Global immunotherapy market, 2018 - 2030 (USD million)
- Figure 39. Global others market, 2018 - 2030 (USD million)
- Figure 40. Global plasmid DNA manufacturing market: Disease outlook and key takeaways
- Figure 41. Global plasmid DNA manufacturing market: Disease movement analysis
- Figure 42. Global infectious disease market, 2018 - 2030 (USD million)
- Figure 43. Global cancer market, 2018 - 2030 (USD million)
- Figure 44. Global genetic disorder market, 2018 - 2030 (USD million)
- Figure 45. Global Others market, 2018 - 2030 (USD million)
- Figure 46. Global plasmid DNA manufacturing market: Regional outlook and key takeaways
- Figure 47. North America plasmid DNA manufacturing market, 2018 - 2030 (USD million)
- Figure 48. U.S. key country dynamics
- Figure 49. U.S. plasmid DNA manufacturing market, 2018 - 2030 (USD million)
- Figure 50. Canada key country dynamics
- Figure 51. Canada plasmid DNA manufacturing market, 2018 - 2030 (USD million)
- Figure 52. Mexico key country dynamics
- Figure 53. Mexico plasmid DNA manufacturing market estimates and forecast, 2018 - 2030 (USD million)
- Figure 54. Europe plasmid DNA manufacturing market estimates and forecast, 2018 - 2030 (USD million)
- Figure 55. Germany key country dynamics
- Figure 56. Germany plasmid DNA manufacturing market estimates and forecast, 2018 - 2030 (USD million)
- Figure 57. France key country dynamics
- Figure 58. France plasmid DNA manufacturing market estimates and forecast, 2018 - 2030 (USD million)
- Figure 59. U.K. key country dynamics
- Figure 60. U.K. plasmid DNA manufacturing market estimates and forecast, 2018 - 2030 (USD million)
- Figure 61. Italy key country dynamics
- Figure 62. Italy plasmid DNA manufacturing market estimates and forecast, 2018 - 2030 (USD million)
- Figure 63. Spain key country dynamics
- Figure 64. Spain plasmid DNA manufacturing market estimates and forecast, 2018 - 2030 (USD million)
- Figure 65. Denmark key country dynamics
- Figure 66. Denmark plasmid DNA manufacturing market estimates and forecast, 2018 - 2030 (USD million)
- Figure 67. Sweden key country dynamics
- Figure 68. Sweden plasmid DNA manufacturing market estimates and forecast, 2018 - 2030 (USD million)
- Figure 69. Norway key country dynamics
- Figure 70. Norway plasmid DNA manufacturing market estimates and forecast, 2018 - 2030 (USD million)
- Figure 71. Asia-Pacific plasmid DNA manufacturing market estimates and forecast, 2018 - 2030 (USD million)
- Figure 72. China key country dynamics
- Figure 73. China plasmid DNA manufacturing market estimates and forecast, 2018 - 2030 (USD million)
- Figure 74. India key country dynamics
- Figure 75. India plasmid DNA manufacturing market estimates and forecast, 2018 - 2030 (USD million)
- Figure 76. South Korea key country dynamics
- Figure 77. South Korea plasmid DNA manufacturing market estimates and forecast, 2018 - 2030 (USD million)
- Figure 78. Japan key country dynamics
- Figure 79. Japan plasmid DNA manufacturing market estimates and forecast, 2018 - 2030 (USD million)
- Figure 80. Australia key country dynamics
- Figure 81. Australia plasmid DNA manufacturing market estimates and forecast, 2018 - 2030 (USD million)
- Figure 82. Thailand key country dynamics
- Figure 83. Thailand plasmid DNA manufacturing market estimates and forecast, 2018 - 2030 (USD million)
- Figure 84. Latin America plasmid DNA manufacturing market estimates and forecast, 2018 - 2030 (USD million)
- Figure 85. Brazil key country dynamics
- Figure 86. Brazil plasmid DNA manufacturing market estimates and forecast, 2018 - 2030 (USD million)
- Figure 87. Argentina key country dynamics
- Figure 88. Argentina plasmid DNA manufacturing market estimates and forecast, 2018 - 2030 (USD million)
- Figure 89. MEA plasmid DNA manufacturing market estimates and forecast, 2018 - 2030 (USD million)
- Figure 90. South Africa key country dynamics
- Figure 91. South Africa plasmid DNA manufacturing market estimates and forecast, 2018 - 2030 (USD million)
- Figure 92. Saudi Arabia key country dynamics
- Figure 93. Saudi Arabia plasmid DNA manufacturing market estimates and forecast, 2018 - 2030 (USD million)
- Figure 94. UAE key country dynamics
- Figure 95. UAE plasmid DNA manufacturing market estimates and forecast, 2018 - 2030 (USD million)
- Figure 96. Kuwait key country dynamics
- Figure 97. Kuwait plasmid DNA manufacturing market estimates and forecast, 2018 - 2030 (USD million)
- Figure 98. Market participant categorization
- Figure 99. Plasmid DNA manufacturing market share analysis, 2023
- Figure 100. Strategy framework
Plasmid DNA Manufacturing Market Growth & Trends:
The global plasmid DNA manufacturing market size is expected to reach USD 6.70 billion by 2030, expanding at a CAGR of 21.44% from 2025 to 2030, according to a new report by Grand View Research, Inc. The rising prevalence of chronic diseases, combined with the wide application scope of plasmid DNA in the healthcare industry is expected to drive the industry growth. Plasmid DNA can be used directly for therapeutic applications, such as the production of vaccine antigens or gene therapy. Moreover, it can be utilized for various research purposes, such as gene cloning, gene mapping, etc. The rising number of patients choosing gene therapy is expected to drive industry growth in the coming years.
According to clinicaltrials.gov, the number of cell & gene therapies across global pipeline programs (Phase I to Phase III trials) increased from 289 in 2018 to 327 in 2022. Furthermore, the U.S. FDA provides constant support for innovations in the advanced therapy arena via several policies concerning product manufacturing. With increased cell and gene therapy products, the industry will see an increased need for manufacturing plasmid DNA on a larger scale. The COVID-19 pandemic is anticipated to positively impact industry growth. For instance, in September 2021, India approved the first COVID-19 DNA vaccine. It is the world's first COVID-19 DNA vaccine manufactured in partnership with DBT-BIRAC as part of Mission COVID Suraksha.
Circular DNA is used in India's ZyCoV-D vaccination to protect against COVID-19 infection. Furthermore, key entities in the global industry are undertaking various strategic initiatives to strengthen their market presence, which is also expected to propel growth. For instance, in June 2022, BioCina announced the expansion of the production of plasmid DNA in a new dedicated GMP suite to its offering of CDMO services. The suite has a single-use fermentation capacity of up to 300 L and appropriately scaled downstream processing machinery.
Plasmid DNA Manufacturing Market Report Highlights:
- MP-grade plasmid DNA manufacturing dominated the market in 2024 with a share of 86.29% and is expected to grow at the fastest CAGR over the forecast period.
- The clinical therapeutics segment held the largest market share of 54.6% in 2024. Plasmid DNA is currently increasing in importance for clinical research applications in genetic vaccination and gene therapy.
- The cell & gene therapy segment held the largest market share of 54.4% in 2024. This high share can be attributed to the fact that gene therapy is broadly applied in the treatment of several inherited and genetic diseases.
- The cancer segment held the largest market share of 40.0% in 2024 and is expected to witness the fastest CAGR from 2025 to 2030.
- The North America Plasmid DNA manufacturing market held the largest revenue share of 43.43% of the global market in 2024.
Table of Contents
Chapter 1. Methodology and Scope
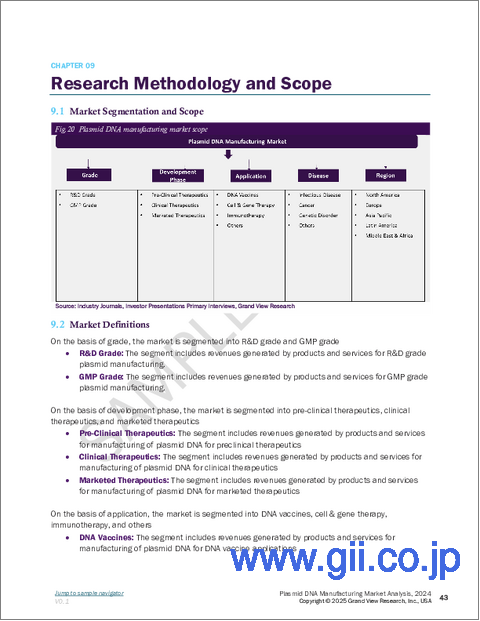
- 1.1. Market Segmentation and Scope
- 1.2. Segment Definitions
- 1.2.1. Grade
- 1.2.2. Development Phase
- 1.2.3. Application
- 1.2.4. Disease
- 1.3. Information analysis
- 1.4. Market formulation & data visualization
- 1.5. Data validation & publishing
- 1.6. Information Procurement
- 1.6.1. Primary Research
- 1.7. Information or Data Analysis
- 1.8. Market Formulation & Validation
- 1.9. Market Model
- 1.9.1. Objectives
Chapter 2. Executive Summary
- 2.1. Market Outlook
- 2.2. Segment Snapshot
- 2.3. Competitive Landscape Snapshot
Chapter 3. Market Variables, Trends, & Scope
- 3.1. Market Lineage Outlook
- 3.1.1. Parent Market Outlook
- 3.1.2. Related/Ancillary Market Outlook
- 3.2. Market Trends and Outlook
- 3.3. Market Dynamics
- 3.3.1. Increasing number of patients opting for gene therapy
- 3.3.2. Robust pipeline for gene therapies
- 3.3.3. Highly competitive market and various strategies undertaken by market players
- 3.3.4. Increasing demand for plasmid DNA in various medical therapies
- 3.4. Market Restraint Analysis
- 3.4.1. Regulatory, Scientific, And Ethical Challenges Associated With Gene Therapy
- 3.5. Business Environment Analysis
- 3.5.1. PESTEL Analysis
- 3.5.2. Porter's Five Forces Analysis
- 3.5.3. COVID-19 Impact Analysis
Chapter 4. Grade Business Analysis
- 4.1. Segment Dashboard
- 4.2. Global Plasmid DNA Manufacturing Market Movement Analysis
- 4.3. Global Plasmid DNA Manufacturing Market Size & Trend Analysis, by Grade, 2018 to 2030 (USD Million)
- 4.4. R&D Grade
- 4.4.1. R&D Grade Market, 2018 - 2030 (USD Million)
- 4.4.2. Viral Vector Development
- 4.4.2.1. Viral Vector Development Market, 2018 - 2030 (USD Million)
- 4.4.2.2. AAV
- 4.4.2.2.1. AAV Market, 2018 - 2030 (USD Million)
- 4.4.2.3. Lentivirus
- 4.4.2.3.1. Lentivirus Market, 2018 - 2030 (USD Million)
- 4.4.2.4. Adenovirus
- 4.4.2.4.1. Adenovirus Market, 2018 - 2030 (USD Million)
- 4.4.2.5. Retrovirus
- 4.4.2.5.1. Retrovirus Market, 2018 - 2030 (USD Million)
- 4.4.2.6. Others
- 4.4.2.6.1. Others Market, 2018 - 2030 (USD Million)
- 4.4.3. mRNA Development
- 4.4.3.1. mRNA Development Market, 2018 - 2030 (USD Million)
- 4.4.4. Antibody Development
- 4.4.4.1. Antibody Development Market, 2018 - 2030 (USD Million)
- 4.4.5. DNA Vaccine Development
- 4.4.5.1. DNA Vaccine Development Market, 2018 - 2030 (USD Million)
- 4.4.6. Others
- 4.4.6.1. Others Market, 2018 - 2030 (USD Million)
- 4.5. GMP Grade
- 4.5.1. GMP Grade Market, 2018 - 2030 (USD Million)
Chapter 5. Development Phase Business Analysis
- 5.1. Segment Dashboard
- 5.2. Global Plasmid DNA Manufacturing Market Movement Analysis
- 5.3. Global Plasmid DNA Manufacturing Market Size & Trend Analysis, by Development Phase, 2018 to 2030 (USD Million)
- 5.4. Pre-Clinical Therapeutics
- 5.4.1. Pre-Clinical Therapeutics Market, 2018 - 2030 (USD Million)
- 5.5. Clinical Therapeutics
- 5.5.1. Clinical Therapeutics Market, 2018 - 2030 (USD Million)
- 5.6. Marketed Therapeutics
- 5.6.1. Marketed Therapeutics Market, 2018 - 2030 (USD Million)
Chapter 6. Application Business Analysis
- 6.1. Segment Dashboard
- 6.2. Global Plasmid DNA Manufacturing Market Movement Analysis
- 6.3. Global Plasmid DNA Manufacturing Market Size & Trend Analysis, by Application, 2018 to 2030 (USD Million)
- 6.4. DNA Vaccines
- 6.4.1. DNA Vaccines Market, 2018 - 2030 (USD Million)
- 6.5. Cell & Gene Therapy
- 6.5.1. Cell & Gene Therapy Market, 2018 - 2030 (USD Million)
- 6.6. Immunotherapy
- 6.6.1. Immunotherapy Market, 2018 - 2030 (USD Million)
- 6.7. Others
- 6.7.1. Others Market, 2018 - 2030 (USD Million)
Chapter 7. Disease Business Analysis
- 7.1. Segment Dashboard
- 7.2. Global Plasmid DNA Manufacturing Market Movement Analysis
- 7.3. Global Plasmid DNA Manufacturing Market Size & Trend Analysis, by Disease, 2018 to 2030 (USD Million)
- 7.4. Infectious Disease
- 7.4.1. Infectious Disease Market, 2018 - 2030 (USD Million)
- 7.5. Cancer
- 7.5.1. Cancer Market, 2018 - 2030 (USD Million)
- 7.6. Genetic Disorder
- 7.6.1. Genetic Disorder Market, 2018 - 2030 (USD Million)
- 7.7. Others
- 7.7.1. Others Market, 2018 - 2030 (USD Million)
Chapter 8. Regional Estimates & Trend Analysis by Grade, Development Phase, Disease, & Application
- 8.1. Regional Market Dashboard
- 8.2. Global Plasmid DNA Manufacturing Market Share By Region, 2024 & 2030
- 8.3. North America
- 8.3.1. North America Plasmid DNA Manufacturing Market, 2018 - 2030 (USD Million)
- 8.3.2. U.S.
- 8.3.2.1. Key Country Dynamics
- 8.3.2.2. Competitive Scenario
- 8.3.2.3. Regulatory Framework
- 8.3.2.4. Target Disease Prevalence
- 8.3.2.5. U.S. Plasmid DNA Manufacturing Market, 2018 - 2030 (USD Million)
- 8.3.3. Canada
- 8.3.3.1. Key Country Dynamics
- 8.3.3.2. Competitive Scenario
- 8.3.3.3. Regulatory Framework
- 8.3.3.4. Target Disease Prevalence
- 8.3.3.5. Canada Plasmid DNA Manufacturing Market, 2018 - 2030 (USD Million)
- 8.3.4. Mexico
- 8.3.4.1. Key Country Dynamics
- 8.3.4.2. Competitive Scenario
- 8.3.4.3. Regulatory Framework
- 8.3.4.4. Target Disease Prevalence
- 8.3.4.5. Mexico Plasmid DNA Manufacturing Market, 2018 - 2030 (USD Million)
- 8.4. Europe
- 8.4.1. Europe Plasmid DNA Manufacturing Market, 2018 - 2030 (USD Million)
- 8.4.2. Germany
- 8.4.2.1. Key Country Dynamics
- 8.4.2.2. Competitive Scenario
- 8.4.2.3. Regulatory Framework
- 8.4.2.4. Target Disease Prevalence
- 8.4.2.5. Germany Plasmid DNA Manufacturing Market, 2018 - 2030 (USD Million)
- 8.4.3. UK
- 8.4.3.1. Key Country Dynamics
- 8.4.3.2. Competitive Scenario
- 8.4.3.3. Regulatory Framework
- 8.4.3.4. Target Disease Prevalence
- 8.4.3.5. UK Plasmid DNA Manufacturing Market, 2018 - 2030 (USD Million)
- 8.4.4. France
- 8.4.4.1. Key Country Dynamics
- 8.4.4.2. Competitive Scenario
- 8.4.4.3. Regulatory Framework
- 8.4.4.4. Target Disease Prevalence
- 8.4.4.5. France Plasmid DNA Manufacturing Market, 2018 - 2030 (USD Million)
- 8.4.5. Italy
- 8.4.5.1. Key Country Dynamics
- 8.4.5.2. Competitive Scenario
- 8.4.5.3. Regulatory Framework
- 8.4.5.4. Target Disease Prevalence
- 8.4.5.5. Italy Plasmid DNA Manufacturing Market, 2018 - 2030 (USD Million)
- 8.4.6. Spain
- 8.4.6.1. Key Country Dynamics
- 8.4.6.2. Competitive Scenario
- 8.4.6.3. Regulatory Framework
- 8.4.6.4. Target Disease Prevalence
- 8.4.6.5. Spain Plasmid DNA Manufacturing Market, 2018 - 2030 (USD Million)
- 8.4.7. Denmark
- 8.4.7.1. Key Country Dynamics
- 8.4.7.2. Competitive Scenario
- 8.4.7.3. Regulatory Framework
- 8.4.7.4. Target Disease Prevalence
- 8.4.7.5. Denmark Plasmid DNA Manufacturing Market, 2018 - 2030 (USD Million)
- 8.4.8. Sweden
- 8.4.8.1. Key Country Dynamics
- 8.4.8.2. Competitive Scenario
- 8.4.8.3. Regulatory Framework
- 8.4.8.4. Target Disease Prevalence
- 8.4.8.5. Sweden Plasmid DNA Manufacturing Market, 2018 - 2030 (USD Million)
- 8.4.9. Norway
- 8.4.9.1. Key Country Dynamics
- 8.4.9.2. Competitive Scenario
- 8.4.9.3. Regulatory Framework
- 8.4.9.4. Target Disease Prevalence
- 8.4.9.5. Norway Plasmid DNA Manufacturing Market, 2018 - 2030 (USD Million)
- 8.5. Asia Pacific
- 8.5.1. Asia Pacific Plasmid DNA Manufacturing Market, 2018 - 2030 (USD Million)
- 8.5.2. Japan
- 8.5.2.1. Key Country Dynamics
- 8.5.2.2. Competitive Scenario
- 8.5.2.3. Regulatory Framework
- 8.5.2.4. Target Disease Prevalence
- 8.5.2.5. Japan Plasmid DNA Manufacturing Market, 2018 - 2030 (USD Million)
- 8.5.3. China
- 8.5.3.1. Key Country Dynamics
- 8.5.3.2. Competitive Scenario
- 8.5.3.3. Regulatory Framework
- 8.5.3.4. Target Disease Prevalence
- 8.5.3.5. China Plasmid DNA Manufacturing Market, 2018 - 2030 (USD Million)
- 8.5.4. India
- 8.5.4.1. Key Country Dynamics
- 8.5.4.2. Competitive Scenario
- 8.5.4.3. Regulatory Framework
- 8.5.4.4. Target Disease Prevalence
- 8.5.4.5. India Plasmid DNA Manufacturing Market, 2018 - 2030 (USD Million)
- 8.5.5. South Korea
- 8.5.5.1. Key Country Dynamics
- 8.5.5.2. Competitive Scenario
- 8.5.5.3. Regulatory Framework
- 8.5.5.4. Target Disease Prevalence
- 8.5.5.5. South Korea Plasmid DNA Manufacturing Market, 2018 - 2030 (USD Million)
- 8.5.6. Australia
- 8.5.6.1. Key Country Dynamics
- 8.5.6.2. Competitive Scenario
- 8.5.6.3. Regulatory Framework
- 8.5.6.4. Target Disease Prevalence
- 8.5.6.5. Australia Plasmid DNA Manufacturing Market, 2018 - 2030 (USD Million)
- 8.5.7. Thailand
- 8.5.7.1. Key Country Dynamics
- 8.5.7.2. Competitive Scenario
- 8.5.7.3. Regulatory Framework
- 8.5.7.4. Target Disease Prevalence
- 8.5.7.5. Thailand Plasmid DNA Manufacturing Market, 2018 - 2030 (USD Million)
- 8.6. Latin America
- 8.6.1. Latin America Plasmid DNA Manufacturing Market, 2018 - 2030 (USD Million)
- 8.6.2. Brazil
- 8.6.2.1. Key Country Dynamics
- 8.6.2.2. Competitive Scenario
- 8.6.2.3. Regulatory Framework
- 8.6.2.4. Target Disease Prevalence
- 8.6.2.5. Brazil Plasmid DNA Manufacturing Market, 2018 - 2030 (USD Million)
- 8.6.3. Argentina
- 8.6.3.1. Key Country Dynamics
- 8.6.3.2. Competitive Scenario
- 8.6.3.3. Regulatory Framework
- 8.6.3.4. Target Disease Prevalence
- 8.6.3.5. Argentina Plasmid DNA Manufacturing Market, 2018 - 2030 (USD Million)
- 8.7. MEA
- 8.7.1. MEA Plasmid DNA Manufacturing Market, 2018 - 2030 (USD Million)
- 8.7.2. South Africa
- 8.7.2.1. Key Country Dynamics
- 8.7.2.2. Competitive Scenario
- 8.7.2.3. Regulatory Framework
- 8.7.2.4. Target Disease Prevalence
- 8.7.2.5. South Africa Plasmid DNA Manufacturing Market, 2018 - 2030 (USD Million)
- 8.7.3. Saudi Arabia
- 8.7.3.1. Key Country Dynamics
- 8.7.3.2. Competitive Scenario
- 8.7.3.3. Regulatory Framework
- 8.7.3.4. Target Disease Prevalence
- 8.7.3.5. Saudi Arabia Plasmid DNA Manufacturing Market, 2018 - 2030 (USD Million)
- 8.7.4. UAE
- 8.7.4.1. Key Country Dynamics
- 8.7.4.2. Competitive Scenario
- 8.7.4.3. Regulatory Framework
- 8.7.4.4. Target Disease Prevalence
- 8.7.4.5. UAE Plasmid DNA Manufacturing Market, 2018 - 2030 (USD Million)
- 8.7.5. Kuwait
- 8.7.5.1. Key Country Dynamics
- 8.7.5.2. Competitive Scenario
- 8.7.5.3. Regulatory Framework
- 8.7.5.4. Target Disease Prevalence
- 8.7.5.5. Kuwait Plasmid DNA Manufacturing Market, 2018 - 2030 (USD Million)
Chapter 9. Competitive Landscape
- 9.1. Participant Categorization
- 9.2. Company Market Position Analysis, 2024
- 9.3. Participant's Overview
- 9.3.1. Charles River Laboratories
- 9.3.1.1. Overview
- 9.3.1.2. Financial Performance
- 9.3.1.3. Product Benchmarking
- 9.3.1.4. Strategic Initiatives
- 9.3.2. Danaher
- 9.3.2.1. Overview
- 9.3.2.2. Financial Performance
- 9.3.2.3. Product Benchmarking
- 9.3.2.4. Strategic Initiatives
- 9.3.3. VGXI, Inc.
- 9.3.3.1. Overview
- 9.3.3.2. Financial Performance
- 9.3.3.3. Product Benchmarking
- 9.3.3.4. Strategic Initiatives
- 9.3.4. Kaneka Corp.
- 9.3.4.1. Overview
- 9.3.4.2. Financial Performance
- 9.3.4.3. Product Benchmarking
- 9.3.4.4. Strategic Initiatives
- 9.3.5. Lonza
- 9.3.5.1. Overview
- 9.3.5.2. Financial Performance
- 9.3.5.3. Product Benchmarking
- 9.3.5.4. Strategic Initiatives
- 9.3.6. Nature Technology
- 9.3.6.1. Overview
- 9.3.6.2. Financial Performance
- 9.3.6.3. Product Benchmarking
- 9.3.6.4. Strategic Initiatives
- 9.3.7. Cell and Gene Therapy Catapult
- 9.3.7.1. Overview
- 9.3.7.2. Financial Performance
- 9.3.7.3. Product Benchmarking
- 9.3.7.4. Strategic Initiatives
- 9.3.8. Eurofins Genomics
- 9.3.8.1. Overview
- 9.3.8.2. Financial Performance
- 9.3.8.3. Product Benchmarking
- 9.3.8.4. Strategic Initiatives
- 9.3.9. Luminous BioSciences, LLC
- 9.3.9.1. Overview
- 9.3.9.2. Financial Performance
- 9.3.9.3. Product Benchmarking
- 9.3.9.4. Strategic Initiatives
- 9.3.10. Akron Biotech
- 9.3.10.1. Overview
- 9.3.10.2. Financial Performance
- 9.3.10.3. Product Benchmarking
- 9.3.10.4. Strategic Initiatives
- 9.3.1. Charles River Laboratories

