|
|
市場調査レポート
商品コード
1404647
保護リレーの市場規模、シェア、動向分析レポート:電圧別、用途別、最終用途別、地域別、セグメント予測、2023年~2030年Protective Relay Market Size, Share & Trends Analysis Report By Voltage (2 Low, Medium, High), By Application, By End Use (Infrastructure, Industrial, Government, Power, Others), By Region, And Segment Forecasts, 2023 - 2030 |
||||||
|
|
|||||||
カスタマイズ可能
|
|||||||


| 保護リレーの市場規模、シェア、動向分析レポート:電圧別、用途別、最終用途別、地域別、セグメント予測、2023年~2030年 |
|
出版日: 2023年11月10日
発行: Grand View Research
ページ情報: 英文 150 Pages
納期: 2~10営業日
|

- 全表示
- 概要
- 図表
- 目次
保護リレー市場の成長と動向:
Grand View Research, Inc.の最新レポートによると、世界の保護リレー市場は2030年までに50億9,000万米ドルに達し、2023年から2030年までのCAGRは5.2%で拡大すると予測されています。
送電・配電ネットワークへの投資が増加し、古い設備が置き換えられることが、予測期間中の成長に拍車をかける主要因となる見込みです。電気系統の複雑化に伴い、電力系統の安全のために保護装置を組み込むことが不可避となっています。増加する人口の電力需要を満たすための発電能力の増大は、市場需要を増大させる主な要因として作用すると推定されます。とはいえ、これらのリレーのセットアップとメンテナンスに伴うコストは、近い将来、業界の課題になると推定されます。
世界の保護リレー市場は、予測期間中に高成長が見込まれます。これは、アジア太平洋地域における電力消費の増加とともに、人口が継続的に増加しているためと考えられます。再生可能エネルギー・プロジェクトの急増と相まって、スマートグリッド技術の重要性が高まっており、今後8年間で保護リレー需要がさらに急増すると予想されます。例えば、日本では2011年の地震と津波の後、政府は再生可能エネルギー発電を増強することでエネルギー供給ギャップを縮小することを決定しました。
保護リレー市場レポートハイライト
- 中電圧セグメントは2022年に45.7%の最大市場シェアを占めました。この高いシェアは、電力システムと変電所における高圧保護リレーのアプリケーションの増加によるものです。
- フィーダ保護セグメントは、2022年に28.7%の最も高い収益シェアで市場を独占しました。これは主に、送電に必要な架空ケーブルを保護するための送電・配電ネットワークの重要性によるものです。
- 電力部門は、2022年に31.8%の最高収益シェアで市場を独占しました。産業開発と世界の電力生産能力の急増が、保護リレー市場を拡大すると予測されています。
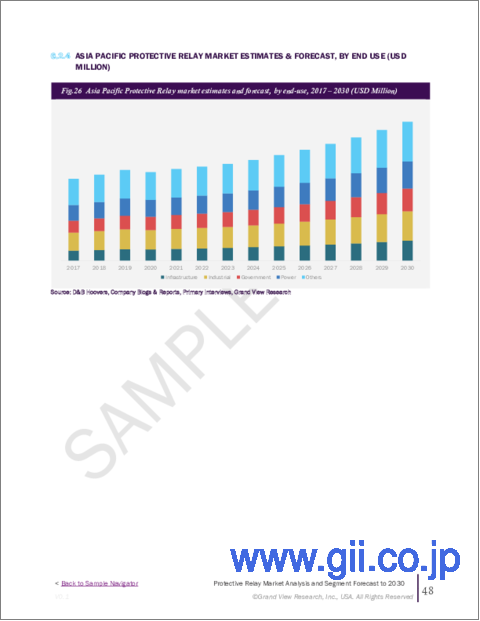
- アジア太平洋地域が2022年に31.0%の最大収益シェアで市場を独占しました。北米は予測期間中、CAGR 5.7%の大幅な成長が見込まれます。
目次
第1章 調査手法と範囲
第2章 エグゼクティブサマリー
第3章 保護リレー市場の変数、動向、範囲
- 市場系統の見通し
- 親市場の見通し
- 関連/付随市場の見通し
- 普及と成長の見通しマッピング
- 市場力学
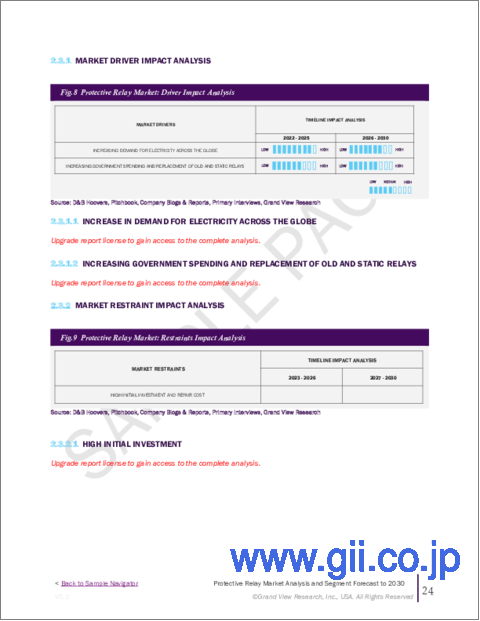
- 市場促進要因分析
- 市場抑制要因分析
- 保護リレー市場分析ツール
- 業界分析- ポーターのファイブフォース分析
- PESTEL分析
第4章 保護リレー市場:電圧の推定・動向分析
- 保護リレー市場:重要なポイント
- 保護リレー市場:動向と市場シェア分析、2022年および2030年
- 低電圧
- 中電圧
- 高電圧
第5章 保護リレー市場:用途の推定・動向分析
- 保護リレー市場:重要なポイント
- 保護リレー市場:動向と市場シェア分析、2022年および2030年
- フィーダー保護
- 発電機の保護
- バスバー保護
- コンデンサバンク保護
- 変圧器の保護
- ブレーカー保護
- その他
第6章 保護リレー市場: 最終用途の推定・動向分析
- 保護リレー市場:重要なポイント
- 保護リレー市場:動向と市場シェア分析、2022年および2030年
- インフラ
- 産業
- 政府
- 電力
- その他
第7章 保護リレー市場:地域の推定・動向分析
- 地域別の見通し
- 地域別保護リレー市場:重要なポイント
- 北米
- 市場推計・予測、2017~2030年
- 米国
- カナダ
- 欧州
- 英国
- ドイツ
- フランス
- アジア太平洋地域
- 日本
- 中国
- インド
- オーストラリア
- 韓国
- ラテンアメリカ
- ブラジル
- メキシコ
- 中東・アフリカ
- 南アフリカ
- サウジアラビア
- アラブ首長国連邦
第8章 競合情勢
- 主要市場参入企業による最近の動向と影響分析
- 市場参入企業の分類
- ABB
- Doble Engineering Company
- Eaton
- Fanox
- Mitsubishi Electric Corporation
- General Electric
- NR Electric Co., Ltd.
- Seimens
- Schneider Electric
- Schweitzer Engineering Laboratories, Inc.
- TIEPCO
- ZIV
- ZIV TOSHIBA CORPORATION
List of Tables
- Table 1 List of abbreviations
- Table 2 North America protective relay market, by voltage, 2017 - 2030 (USD Million)
- Table 3 North America protective relay market, by application, 2017 - 2030 (USD Million)
- Table 4 North America protective relay market, by end use, 2017 - 2030 (USD Million)
- Table 5 North America protective relay market, by region, 2017 - 2030 (USD Million)
- Table 6 U.S. protective relay market, by voltage, 2017 - 2030 (USD Million)
- Table 7 U.S. protective relay market, by application, 2017 - 2030 (USD Million)
- Table 8 U.S. protective relay market, by end use, 2017 - 2030 (USD Million)
- Table 9 Canada protective relay market, by voltage, 2017 - 2030 (USD Million)
- Table 10 Canada protective relay market, by application, 2017 - 2030 (USD Million)
- Table 11 Canada protective relay market, by end use, 2017 - 2030 (USD Million)
- Table 12 Europe protective relay market, by voltage, 2017 - 2030 (USD Million)
- Table 13 Europe protective relay market, by application, 2017 - 2030 (USD Million)
- Table 14 Europe protective relay market, by end use, 2017 - 2030 (USD Million)
- Table 15 Europe protective relay market, by region, 2017 - 2030 (USD Million)
- Table 16 Germany protective relay market, by voltage, 2017 - 2030 (USD Million)
- Table 17 Germany protective relay market, by application, 2017 - 2030 (USD Million)
- Table 18 Germany protective relay market, by end use, 2017 - 2030 (USD Million)
- Table 19 UK protective relay market, by voltage, 2017 - 2030 (USD Million)
- Table 20 UK protective relay market, by application, 2017 - 2030 (USD Million)
- Table 21 UK protective relay market, by end use, 2017 - 2030 (USD Million)
- Table 22 France protective relay market, by voltage, 2017 - 2030 (USD Million)
- Table 23 France protective relay market, by application, 2017 - 2030 (USD Million)
- Table 24 France protective relay market, by end use, 2017 - 2030 (USD Million)
- Table 25 Asia Pacific protective relay market, by voltage, 2017 - 2030 (USD Million)
- Table 26 Asia Pacific protective relay market, by application, 2017 - 2030 (USD Million)
- Table 27 Asia Pacific protective relay market, by end use, 2017 - 2030 (USD Million)
- Table 28 Asia Pacific protective relay market, by region, 2017 - 2030 (USD Million)
- Table 29 Japan protective relay market, by voltage, 2017 - 2030 (USD Million)
- Table 30 Japan protective relay market, by application, 2017 - 2030 (USD Million)
- Table 31 Japan protective relay market, by end use, 2017 - 2030 (USD Million)
- Table 32 China protective relay market, by voltage, 2017 - 2030 (USD Million)
- Table 33 China protective relay market, by application, 2017 - 2030 (USD Million)
- Table 34 China protective relay market, by end use, 2017 - 2030 (USD Million)
- Table 35 India protective relay market, by voltage, 2017 - 2030 (USD Million)
- Table 36 India protective relay market, by application, 2017 - 2030 (USD Million)
- Table 37 India protective relay market, by end use, 2017 - 2030 (USD Million)
- Table 38 Australia protective relay market, by voltage, 2017 - 2030 (USD Million)
- Table 39 Australia protective relay market, by application, 2017 - 2030 (USD Million)
- Table 40 Australia protective relay market, by end use, 2017 - 2030 (USD Million)
- Table 41 South Korea protective relay market, by voltage, 2017 - 2030 (USD Million)
- Table 42 South Korea protective relay market, by application, 2017 - 2030 (USD Million)
- Table 43 South Korea protective relay market, by end use, 2017 - 2030 (USD Million)
- Table 44 Latin America protective relay market, by voltage, 2017 - 2030 (USD Million)
- Table 45 Latin America protective relay market, by application, 2017 - 2030 (USD Million)
- Table 46 Latin America protective relay market, by end use, 2017 - 2030 (USD Million)
- Table 47 Latin America protective relay market, by region, 2017 - 2030 (USD Million)
- Table 48 Brazil protective relay market, by voltage, 2017 - 2030 (USD Million)
- Table 49 Brazil protective relay market, by application, 2017 - 2030 (USD Million)
- Table 50 Brazil protective relay market, by end use, 2017 - 2030 (USD Million)
- Table 51 Mexico protective relay market, by voltage, 2017 - 2030 (USD Million)
- Table 52 Mexico protective relay market, by application, 2017 - 2030 (USD Million)
- Table 53 Mexico protective relay market, by end use, 2017 - 2030 (USD Million)
- Table 54 Middle East and Africa protective relay market, by voltage, 2017 - 2030 (USD Million)
- Table 55 Middle East and Africa protective relay market, by application, 2017 - 2030 (USD Million)
- Table 56 Middle East and Africa protective relay market, by end use, 2017 - 2030 (USD Million)
- Table 57 Middle East and Africa protective relay market, by region, 2017 - 2030 (USD Million)
- Table 58 South Africa protective relay market, by voltage, 2017 - 2030 (USD Million)
- Table 59 South Africa protective relay market, by application, 2017 - 2030 (USD Million)
- Table 60 South Africa protective relay market, by end use, 2017 - 2030 (USD Million)
- Table 61 Saudi Arabia protective relay market, by voltage, 2017 - 2030 (USD Million)
- Table 62 Saudi Arabia protective relay market, by application, 2017 - 2030 (USD Million)
- Table 63 Saudi Arabia protective relay market, by end use, 2017 - 2030 (USD Million)
- Table 64 UAE protective relay market, by voltage, 2017 - 2030 (USD Million)
- Table 65 UAE protective relay market, by application, 2017 - 2030 (USD Million)
- Table 66 UAE protective relay market, by end use, 2017 - 2030 (USD Million)
List of Figures
- Fig. 1 Market research process
- Fig. 2 Data triangulation techniques
- Fig. 3 Primary research pattern
- Fig. 4 Market research approaches
- Fig. 5 Value-chain-based sizing & forecasting
- Fig. 6 QFD modeling for market share assessment
- Fig. 7 Market formulation & validation
- Fig. 8 Protective relay: Market outlook
- Fig. 9 Protective relay: Competitive insights
- Fig. 10 Parent market outlook
- Fig. 11 Related/ancillary market outlook
- Fig. 12 Penetration and growth prospect mapping
- Fig. 13 Industry value chain analysis
- Fig. 14 Protective relay market driver impact
- Fig. 15 Protective relay market restraint impact
- Fig. 16 Protective relay market strategic initiatives analysis
- Fig. 17 Protective relay market: Voltage movement analysis
- Fig. 18 Protective relay market: Voltage outlook and key takeaways
- Fig. 19 Low voltage market estimates and forecasts, 2017 - 2030 (USD Million)
- Fig. 20 Medium voltage market estimates and forecasts, 2017 - 2030 (USD Million)
- Fig. 21 High voltage market estimates and forecasts, 2017 - 2030 (USD Million)
- Fig. 22 Protective relay market: Application movement analysis
- Fig. 23 Protective relay market: Application outlook and key takeaways
- Fig. 24 Feeder protection market estimates and forecasts, 2017 - 2030 (USD Million)
- Fig. 25 Generator protection market estimates and forecasts, 2017 - 2030 (USD Million)
- Fig. 26 Bus-bar protection market estimates and forecasts, 2017 - 2030 (USD Million)
- Fig. 27 Capacitor bank protection market estimates and forecasts, 2017 - 2030 (USD Million)
- Fig. 28 Breaker protection market estimates and forecasts, 2017 - 2030 (USD Million)
- Fig. 29 Transformer protection market estimates and forecasts, 2017 - 2030 (USD Million)
- Fig. 30 Others market estimates and forecasts, 2017 - 2030 (USD Million)
- Fig. 31 Protective relay market: End use movement analysis
- Fig. 32 Protective relay market: End use outlook and key takeaways
- Fig. 33 Infrastructure market estimates and forecasts, 2017 - 2030 (USD Million)
- Fig. 34 Industrial market estimates and forecasts, 2017 - 2030 (USD Million)
- Fig. 35 Government market estimates and forecasts, 2017 - 2030 (USD Million)
- Fig. 36 Power market estimates and forecasts, 2017 - 2030 (USD Million)
- Fig. 37 Others market estimates and forecasts, 2017 - 2030 (USD Million)
- Fig. 38 Global protective relay market: Regional movement analysis
- Fig. 39 Global protective relay market: Regional outlook and key takeaways
- Fig. 40 North America market estimates and forecasts, 2017 - 2030 (USD Million)
- Fig. 41 U.S. market estimates and forecasts, 2017 - 2030 (USD Million)
- Fig. 42 Canada market estimates and forecasts, 2017 - 2030 (USD Million)
- Fig. 43 Europe market estimates and forecasts, 2017 - 2030 (USD Million)
- Fig. 44 UK market estimates and forecasts, 2017 - 2030 (USD Million)
- Fig. 45 Germany market estimates and forecasts, 2017 - 2030 (USD Million)
- Fig. 46 France market estimates and forecasts, 2017 - 2030 (USD Million)
- Fig. 47 Asia Pacific market estimates and forecasts, 2017 - 2030 (USD Million)
- Fig. 48 Japan market estimates and forecasts, 2017 - 2030 (USD Million)
- Fig. 49 China market estimates and forecasts, 2017 - 2030 (USD Million)
- Fig. 50 India market estimates and forecasts, 2017 - 2030 (USD Million)
- Fig. 51 Australia market estimates and forecasts, 2017 - 2030 (USD Million)
- Fig. 52 South Korea market estimates and forecasts, 2017 - 2030 (USD Million)
- Fig. 53 Latin America market estimates and forecasts, 2017 - 2030 (USD Million)
- Fig. 54 Brazil market estimates and forecasts, 2017 - 2030 (USD Million)
- Fig. 55 Mexico market estimates and forecasts, 2017 - 2030 (USD Million)
- Fig. 56 Middle East and Africa market estimates and forecasts, 2017 - 2030 (USD Million)
- Fig. 57 Saudi Arabia market estimates and forecasts, 2017 - 2030 (USD Million)
- Fig. 58 South Africa market estimates and forecasts, 2017 - 2030 (USD Million)
- Fig. 59 UAE market estimates and forecasts, 2017 - 2030 (USD Million)
Protective Relay Market Growth & Trends:
The global protective relay market is expected to reach USD 5.09 billion by 2030, according to a new report by Grand View Research, Inc., expanding at a CAGR of 5.2% from 2023 to 2030. Mounting investments in the transmission & distribution networks to replace the old equipment is expected to be a major factor expected to spur the growth over the forecast period. The intensifying intricacy of electrical systems has made it inevitable to incorporate protective devices for power systems safety. The growing electricity generation capacity to meet the growing population's electricity demand is estimated to act as a key driver augmenting market demand. Nevertheless, the cost concomitant with the setup & maintenance of these relays is estimated to challenge the industry over the near future.
The global protective relay market is anticipated to witness high growth over the forecast period. This may be accredited to continuous population growth along with the mounting regional power consumption in Asia Pacific. The rising importance of smart grid technology coupled with an upsurge in renewable energy projects is expected to further catapult protective relay demand over the next eight years. For instance, after the earthquake and tsunami in 2011, in Japan, the government decided to reduce the energy supply gap by augmenting renewable energy generation.
Protective Relay Market Report Highlights:
- The medium voltage segment held the largest market share of 45.7% in 2022. The high share is attributed to an increase in the application of medium voltage protective relays in power systems and substations.
- The feeder protection segment dominated the market with the highest revenue share of 28.7% in 2022. This is primarily due to the criticality of the transmission & distribution networks to safeguard the overhead cables required for the electricity transmission
- The power segment dominated the market with the highest revenue share of 31.8% in 2022. Industrial development and the global upsurge in power production capacity are projected to augment the protective relay.
- Asia Pacific dominated the market with the largest revenue share of 31.0% in 2022. North America is expected to grow at a significant CAGR of 5.7% during the forecast period.
Table of Contents
Chapter 1. Methodology and Scope
- 1.1. Market Segmentation & Scope
- 1.1.1. Voltage
- 1.1.2. Application
- 1.1.3. End use
- 1.1.4. Regional scope
- 1.1.5. Estimates and forecast timeline
- 1.2. Research Methodology
- 1.3. Information Procurement
- 1.3.1. Purchased database
- 1.3.2. GVR's internal database
- 1.3.3. Secondary route of administrations
- 1.3.4. Primary research
- 1.3.5. Details of primary research
- 1.4. Information or Data Analysis
- 1.5. Market Formulation & Validation
- 1.6. Model Details
- 1.7. List of Secondary Sources
- 1.8. List of Primary Sources
- 1.9. Objectives
Chapter 2. Executive Summary
- 2.1. Market Outlook
- 2.2. Segment Outlook
- 2.2.1. Voltage outlook
- 2.2.2. Application outlook
- 2.2.3. End use outlook
- 2.2.4. Regional outlook
- 2.3. Competitive Insights
Chapter 3. Protective Relay Market Variables, Trends & Scope
- 3.1. Market Lineage Outlook
- 3.1.1. Parent market outlook
- 3.1.2. Related/ancillary market outlook
- 3.2. Penetration & Growth Prospect Mapping
- 3.3. Market Dynamics
- 3.3.1. Market driver analysis
- 3.3.2. Market restraint analysis
- 3.4. Protective Relay Market Analysis Tools
- 3.4.1. Industry Analysis - Porter's
- 3.4.1.1. Supplier power
- 3.4.1.2. Buyer power
- 3.4.1.3. Substitution threat
- 3.4.1.4. Threat of new entrant
- 3.4.1.5. Competitive rivalry
- 3.4.2. PESTEL Analysis
- 3.4.2.1. Political landscape
- 3.4.2.2. Technological landscape
- 3.4.2.3. Economic landscape
- 3.4.1. Industry Analysis - Porter's
Chapter 4. Protective Relay Market: Voltage Estimates & Trend Analysis
- 4.1. Protective Relay Market: Key Takeaways
- 4.2. Protective Relay Market: Movement & Market Share Analysis, 2022 & 2030
- 4.3. Low voltage
- 4.3.1. Low voltage market estimates and forecasts, 2017 to 2030 (USD Million)
- 4.4. Medium voltage
- 4.4.1. Medium voltage market estimates and forecasts, 2017 to 2030 (USD Million)
- 4.5. High voltage
- 4.5.1. High voltage market estimates and forecasts, 2017 to 2030 (USD Million)
Chapter 5. Protective Relay Market: Application Estimates & Trend Analysis
- 5.1. Protective Relay Market: Key Takeaways
- 5.2. Protective Relay Market: Movement & Market Share Analysis, 2022 & 2030
- 5.3. Feeder protection
- 5.3.1. Feeder protection market estimates and forecasts, 2017 to 2030 (USD Million)
- 5.4. Generator protection
- 5.4.1. Generator protection market estimates and forecasts, 2017 to 2030 (USD Million)
- 5.5. Bus-bar protection
- 5.5.1. Bus-bar protection market estimates and forecasts, 2017 to 2030 (USD Million)
- 5.6. Capacitor bank protection
- 5.6.1. Capacitor bank protection market estimates and forecasts, 2017 to 2030 (USD Million)
- 5.7. Transformer protection
- 5.7.1. Transformer protection market estimates and forecasts, 2017 to 2030 (USD Million)
- 5.8. Breaker protection
- 5.8.1. Breaker protection market estimates and forecasts, 2017 to 2030 (USD Million)
- 5.9. Others
- 5.9.1. Others market estimates and forecasts, 2017 to 2030 (USD Million)
Chapter 6. Protective Relay Market: End Use Estimates & Trend Analysis
- 6.1. Protective Relay Market: Key Takeaways
- 6.2. Protective Relay Market: Movement & Market Share Analysis, 2022 & 2030
- 6.3. Infrastructure
- 6.3.1. Infrastructure market estimates and forecasts, 2017 to 2030 (USD Million)
- 6.4. Industrial
- 6.4.1. Industrial market estimates and forecasts, 2017 to 2030 (USD Million)
- 6.5. Government
- 6.5.1. Government market estimates and forecasts, 2017 to 2030 (USD Million)
- 6.6. Power
- 6.6.1. Power market estimates and forecasts, 2017 to 2030 (USD Million)
- 6.7. Others
- 6.7.1. Others market estimates and forecasts, 2017 to 2030 (USD Million)
Chapter 7. Protective Relay Market: Regional Estimates & Trend Analysis
- 7.1. Regional Outlook
- 7.2. Protective Relay Market by Region: Key Takeaway
- 7.3. North America
- 7.3.1. Market estimates and forecasts, 2017 - 2030 (Revenue, USD Million)
- 7.3.2. U.S.
- 7.3.2.1. Market estimates and forecasts, 2017 - 2030 (Revenue, USD Million)
- 7.3.3. Canada
- 7.3.3.1. Market estimates and forecasts, 2017 - 2030 (Revenue, USD Million)
- 7.4. Europe
- 7.4.1. UK
- 7.4.1.1. Market estimates and forecasts, 2017 - 2030 (Revenue, USD Million)
- 7.4.2. Germany
- 7.4.2.1. Market estimates and forecasts, 2017 - 2030 (Revenue, USD Million)
- 7.4.3. France
- 7.4.3.1. Market estimates and forecasts, 2017 - 2030 (Revenue, USD
- 7.4.1. UK
- 7.5. Asia Pacific
- 7.5.1. Japan
- 7.5.1.1. Market estimates and forecasts, 2017 - 2030 (Revenue, USD Million)
- 7.5.2. China
- 7.5.2.1. Market estimates and forecasts, 2017 - 2030 (Revenue, USD Million)
- 7.5.3. India
- 7.5.3.1. Market estimates and forecasts, 2017 - 2030 (Revenue, USD Million)
- 7.5.4. Australia
- 7.5.4.1. Market estimates and forecasts, 2017 - 2030 (Revenue, USD Million)
- 7.5.5. South Korea
- 7.5.5.1. Market estimates and forecasts, 2017 - 2030 (Revenue, USD Million)
- 7.5.1. Japan
- 7.6. Latin America
- 7.6.1. Brazil
- 7.6.1.1. Market estimates and forecasts, 2017 - 2030 (Revenue, USD Million)
- 7.6.2. Mexico
- 7.6.2.1. Market estimates and forecasts, 2017 - 2030 (Revenue, USD Million)
- 7.6.1. Brazil
- 7.7. MEA
- 7.7.1. South Africa
- 7.7.1.1. Market estimates and forecasts, 2017 - 2030 (Revenue, USD Million)
- 7.7.2. Saudi Arabia
- 7.7.2.1. Market estimates and forecasts, 2017 - 2030 (Revenue, USD Million)
- 7.7.3. UAE
- 7.7.3.1. Market estimates and forecasts, 2017 - 2030 (Revenue, USD Million)
- 7.7.1. South Africa
Chapter 8. Competitive Landscape
- 8.1. Recent Developments & Impact Analysis, By Key Market Participants
- 8.2. Market Participant Categorization
- 8.2.1. ABB
- 8.2.1.1. Company overview
- 8.2.1.2. Financial performance
- 8.2.1.3. Product benchmarking
- 8.2.1.4. Strategic initiatives
- 8.2.2. Doble Engineering Company
- 8.2.2.1. Company overview
- 8.2.2.2. Financial performance
- 8.2.2.3. Product benchmarking
- 8.2.2.4. Strategic initiatives
- 8.2.3. Eaton
- 8.2.3.1. Company overview
- 8.2.3.2. Financial performance
- 8.2.3.3. Product benchmarking
- 8.2.3.4. Strategic initiatives
- 8.2.4. Fanox
- 8.2.4.1. Company overview
- 8.2.4.2. Financial performance
- 8.2.4.3. Product benchmarking
- 8.2.4.4. Strategic initiatives
- 8.2.5. Mitsubishi Electric Corporation
- 8.2.5.1. Company overview
- 8.2.5.2. Financial performance
- 8.2.5.3. Product benchmarking
- 8.2.5.4. Strategic initiatives
- 8.2.6. General Electric
- 8.2.6.1. Company overview
- 8.2.6.2. Financial performance
- 8.2.6.3. Product benchmarking
- 8.2.6.4. Strategic initiatives
- 8.2.6.5.
- 8.2.7. NR Electric Co., Ltd.
- 8.2.7.1. Company overview
- 8.2.7.2. Financial performance
- 8.2.7.3. Product benchmarking
- 8.2.7.4. Strategic initiatives
- 8.2.8. Seimens
- 8.2.8.1. Company overview
- 8.2.8.2. Financial performance
- 8.2.8.3. Product benchmarking
- 8.2.8.4. Strategic initiatives
- 8.2.9. Schneider Electric
- 8.2.9.1. Company overview
- 8.2.9.2. Financial performance
- 8.2.9.3. Product benchmarking
- 8.2.9.4. Strategic initiatives
- 8.2.10. Schweitzer Engineering Laboratories, Inc.
- 8.2.10.1. Company overview
- 8.2.10.2. Financial performance
- 8.2.10.3. Product benchmarking
- 8.2.10.4. Strategic initiatives
- 8.2.11. TIEPCO
- 8.2.11.1. Company overview
- 8.2.11.2. Financial performance
- 8.2.11.3. Product benchmarking
- 8.2.11.4. Strategic initiatives
- 8.2.12. ZIV
- 8.2.12.1. Company overview
- 8.2.12.2. Financial performance
- 8.2.12.3. Product benchmarking
- 8.2.12.4. Strategic initiatives
- 8.2.13. ZIV TOSHIBA CORPORATION
- 8.2.13.1. Company overview
- 8.2.13.2. Financial performance
- 8.2.13.3. Product benchmarking
- 8.2.13.4. Strategic initiatives
- 8.2.1. ABB
