|
|
市場調査レポート
商品コード
1726133
ソフトPOSの市場規模、シェア、動向分析レポート:企業規模別、オペレーティングシステム別、最終用途別、地域別、セグメント予測、2025年~2030年SoftPOS Market Size, Share & Trends Analysis Report By Enterprise Size, By Operating System, By End Use, By Region, And Segment Forecasts, 2025 - 2030 |
||||||

|
|||||||
カスタマイズ可能
|
|||||||


| ソフトPOSの市場規模、シェア、動向分析レポート:企業規模別、オペレーティングシステム別、最終用途別、地域別、セグメント予測、2025年~2030年 |
|
出版日: 2025年04月01日
発行: Grand View Research
ページ情報: 英文 100 Pages
納期: 2~10営業日
|

全表示
- 概要
- 図表
- 目次
ソフトPOS市場の成長と動向
Grand View Research, Inc.の最新レポートによると、世界のソフトPOS市場規模は2030年までに12億4,390万米ドルに達し、2025~2030年のCAGRは23.1%で拡大すると推定されています。
ソフトウェアPOS(ソフトPOS)は非接触決済用に設計されており、中小企業だけでなく消費者の間でも急速に採用されている決済方法となっています。非接触決済の増加や決済フォームファクタの拡大などが市場成長の主要因となっています。また、世界の人口におけるスマートフォンの普及率や、COVID-19の流行による非接触またはタッチレス決済を利用する動向の高まりも、市場の成長を後押ししています。
ソフトPOSはTap on MobileまたはTap on Phoneとも呼ばれ、NFC機能を搭載したスマートフォンやタブレットを非接触型決済端末として動作させることができます。消費者や加盟店はソフトPOS端末を利用して、非接触型カードやデジタルウォレットからの決済を受けると同時に、暗証番号を取得し、必要に応じて追加認証を実行します。さらに、レストラン産業の専門家は、顧客体験を向上させ合理化すると同時に、運営経費を削減するための革新的なツールを求め続けています。そのため、レストランでのソフトPOSシステムの採用が増加しており、市場の成長を後押ししています。
複数の市場参入企業によるスマートフォンやタブレットへのソフトPOSソリューションの展開の増加が、市場の成長をさらに促進しています。例えば、2023年9月には、イタリアの国際的な銀行グループであるIntesa Sanpaoloと欧州の著名なPayTechであるNexiがソフトPOSソリューションを発表しました。この先進的なソリューションにより、加盟店はタブレットやスマートフォンで決済を受け付けることができます。これらの決済は、主要なスキーム(BANCOMAT Pay、PagoBANCOMAT、Visa、Maestro、V-Pay、Mastercard)の非接触カードやデジタルウォレット(Apple Pay、Google Pay、Huawei Pay、Samsung Pay)を使って行うことができます。
消費者は非接触またはタッチレス決済のシンプルさとスピードを好み、世界中のほとんどの国で好まれる決済ソリューションとなっています。COVID-19の大流行時には、健康への懸念と取引限度額の引き上げにより、非接触型決済の採用が劇的に増加しました。COVID-19の流行後、さまざまなセグメントでデジタル決済ソリューションの採用を開始する企業や加盟店が増加しました。このシフトは、消費者の需要の高まりと現金への依存度の低下が背景にあります。このように、パンデミック後のデジタル決済手法の採用へのシフトの高まりが、市場の成長を後押ししています。
ソフトPOS市場レポートハイライト
- 企業規模別では、中小企業にとって、ソフトPOSシステムは低コストで簡単にカード決済を利用できる手段です。これらのシステムは安価で使いやすく、素早くセットアップできるように設計されているため、中小企業にとって理想的な選択肢となります。
- オペレーティングシステム別では、iOSセグメントが予測期間中に大きなCAGRで成長する見込みです。iPhoneユーザー数は急速なペースで増加しています。StatCounterによると、2023年9月現在、iPhoneは世界のモバイルOS市場シェアの29.58%を占めています。このように、世界中でiPhoneの販売と導入が増加していることが、このセグメントの成長を牽引しています。
- 最終用途別では、小売セグメントが予測期間中に大きなCAGRで成長すると予測されています。ソフトPOSソリューションは、小売店の業務効率を大幅に改善する幅広い利点を記載しています。このソリューションは、ウェアラブル、レジ、タブレット、スマートフォンなど、さまざまな近距離無線通信(NFC)対応デバイスと互換性があり、汎用性が高いです。この互換性により、小売業者は要件に最適なデバイスを選択することができ、導入がさらに便利になります。このように、ソフトPOSは上記のような利点があるため、小売産業で需要が伸びており、それが最終的に市場成長の原動力となっています。
- アジア太平洋は、予測期間中に大きなCAGRで成長すると予想されています。この成長は、同地域全体で非接触型決済の需要が高まっていることに起因しています。
目次
第1章 調査手法と範囲
第2章 エグゼクティブサマリー
第3章 ソフトPOS市場の変数、動向、範囲
- 市場系統の展望
- 市場力学
- 市場促進要因分析
- 市場抑制要因分析
- 産業の課題
- ソフトPOS市場分析ツール
- 産業分析-ポーターのファイブフォース分析
- PESTEL分析
第4章 ソフトPOS市場:企業規模別、推定・動向分析
- セグメントダッシュボード
- ソフトPOS市場:企業規模変動分析、100万米ドル、2024年と2030年
- 中小企業
- 中規模と大規模ビジネス
第5章 ソフトPOS市場:オペレーティングシステム別、推定・動向分析
- セグメントダッシュボード
- ソフトPOS市場:オペレーティングシステム変動分析、100万米ドル、2024年と2030年
- Android
- iOS
- その他
第6章 ソフトPOS市場:最終用途別、推定・動向分析
- セグメントダッシュボード
- ソフトPOS市場:最終用途変動分析、100万米ドル、2024年と2030年
- 小売
- レストラン
- レストランの収益推定と予測、2020~2030年
- 公共輸送
- ホスピタリティ
- メディアとエンターテイメント
- その他
第7章 ソフトPOS市場:地域別、推定・動向分析
- ソフトPOS市場シェア、地域別、2024年と2030年
- 北米
- 米国
- カナダ
- メキシコ
- 欧州
- 英国
- ドイツ
- フランス
- アジア太平洋
- 中国
- 日本
- インド
- 韓国
- オーストラリア
- ラテンアメリカ
- ブラジル
- 中東・アフリカ
- アラブ首長国連邦
- サウジアラビア
- 南アフリカ
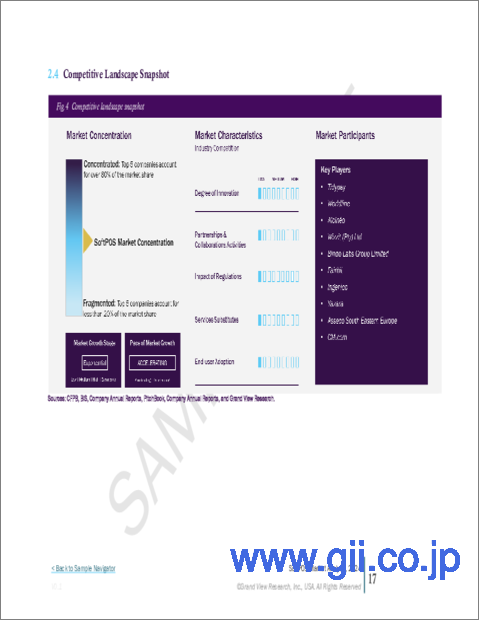
第8章 競合情勢
- 企業分類
- 企業の市場ポジショニング
- 企業ヒートマップ分析
- 企業プロファイル/上場企業
- Tidypay
- Worldline
- Alcineo
- Wizzit(Pty)Ltd
- Bindo Labs Group Limited
- Fairbit
- Yazara
- Asseco South Eastern Europe
- CM.com
- Fime SAS
List of Tables
- Table 1 Global SoftPOS market size estimates & forecasts 2020 - 2030 (USD Million)
- Table 2 Global SoftPOS market, by region 2020 - 2030 (USD Million)
- Table 3 Global SoftPOS market, by Enterprise Size 2020 - 2030 (USD Million)
- Table 4 Global SoftPOS market, by Operating System 2020 - 2030 (USD Million)
- Table 5 Global SoftPOS market, by End Use 2020 - 2030 (USD Million)
- Table 6 Micro & Small Business SoftPOS market, by region 2020 - 2030 (USD Million)
- Table 7 Medium & Large Business SoftPOS market, by region 2020 - 2030 (USD Million)
- Table 8 Android SoftPOS market, by region 2020 - 2030 (USD Million)
- Table 9 iOS SoftPOS market, by region 2020 - 2030 (USD Million)
- Table 10 Others SoftPOS market, by region 2020 - 2030 (USD Million)
- Table 11 Retail SoftPOS market, by region 2020 - 2030 (USD Million)
- Table 12 Restaurants SoftPOS market, by region 2020 - 2030 (USD Million)
- Table 13 Public Transport SoftPOS market, by region 2020 - 2030 (USD Million)
- Table 14 Hospitality SoftPOS market, by region 2020 - 2030 (USD Million)
- Table 15 Media and Entertainment SoftPOS market, by region 2020 - 2030 (USD Million)
- Table 16 Others SoftPOS market, by region 2020 - 2030 (USD Million)
- Table 17 North America SoftPOS market, by Enterprise Size 2020 - 2030 (USD Million)
- Table 18 North America SoftPOS market, by Operating System 2020 - 2030 (USD Million)
- Table 19 North America SoftPOS market, by End Use 2020 - 2030 (USD Million)
- Table 20 U.S. SoftPOS market, by Enterprise Size 2020 - 2030 (USD Million)
- Table 21 U.S. SoftPOS market, by Operating System 2020 - 2030 (USD Million)
- Table 22 U.S. SoftPOS market, by End Use 2020 - 2030 (USD Million)
- Table 23 Canada SoftPOS market, by Enterprise Size 2020 - 2030 (USD Million)
- Table 24 Canada SoftPOS market, by Operating System 2020 - 2030 (USD Million)
- Table 25 Canada SoftPOS market, by End Use 2020 - 2030 (USD Million)
- Table 26 Mexico SoftPOS market, by Enterprise Size 2020 - 2030 (USD Million)
- Table 27 Mexico SoftPOS market, by Operating System 2020 - 2030 (USD Million)
- Table 28 Mexico SoftPOS market, by End Use 2020 - 2030 (USD Million)
- Table 29 Europe SoftPOS market, by Enterprise Size 2020 - 2030 (USD Million)
- Table 30 Europe SoftPOS market, by Operating System 2020 - 2030 (USD Million)
- Table 31 Europe SoftPOS market, by End Use 2020 - 2030 (USD Million)
- Table 32 U.K. SoftPOS market, by Enterprise Size 2020 - 2030 (USD Million)
- Table 33 U.K. SoftPOS market, by Operating System 2020 - 2030 (USD Million)
- Table 34 U.K. SoftPOS market, by End Use 2020 - 2030 (USD Million)
- Table 35 Germany SoftPOS market, by Enterprise Size 2020 - 2030 (USD Million)
- Table 36 Germany SoftPOS market, by Operating System 2020 - 2030 (USD Million)
- Table 37 Germany SoftPOS market, by End Use 2020 - 2030 (USD Million)
- Table 38 France SoftPOS market, by Enterprise Size 2020 - 2030 (USD Million)
- Table 39 France SoftPOS market, by Operating System 2020 - 2030 (USD Million)
- Table 40 France SoftPOS market, by End Use 2020 - 2030 (USD Million)
- Table 41 Asia Pacific SoftPOS market, by Enterprise Size 2020 - 2030 (USD Million)
- Table 42 Asia Pacific SoftPOS market, by Operating System 2020 - 2030 (USD Million)
- Table 43 Asia Pacific SoftPOS market, by End Use 2020 - 2030 (USD Million)
- Table 44 China SoftPOS market, by Enterprise Size 2020 - 2030 (USD Million)
- Table 45 China SoftPOS market, by Operating System 2020 - 2030 (USD Million)
- Table 46 China SoftPOS market, by End Use 2020 - 2030 (USD Million)
- Table 47 India SoftPOS market, by Enterprise Size 2020 - 2030 (USD Million)
- Table 48 India SoftPOS market, by Operating System 2020 - 2030 (USD Million)
- Table 49 India SoftPOS market, by End Use 2020 - 2030 (USD Million)
- Table 50 Japan SoftPOS market, by Enterprise Size 2020 - 2030 (USD Million)
- Table 51 Japan SoftPOS market, by Operating System 2020 - 2030 (USD Million)
- Table 52 Japan SoftPOS market, by End Use 2020 - 2030 (USD Million)
- Table 53 South Korea SoftPOS market, by Enterprise Size 2020 - 2030 (USD Million)
- Table 54 South Korea SoftPOS market, by Operating System 2020 - 2030 (USD Million)
- Table 55 South Korea SoftPOS market, by End Use 2020 - 2030 (USD Million)
- Table 56 Australia SoftPOS market, by Enterprise Size 2020 - 2030 (USD Million)
- Table 57 Australia SoftPOS market, by Operating System 2020 - 2030 (USD Million)
- Table 58 Australia SoftPOS market, by End Use 2020 - 2030 (USD Million)
- Table 59 Latin America SoftPOS market, by Enterprise Size 2020 - 2030 (USD Million)
- Table 60 Latin America SoftPOS market, by Operating System 2020 - 2030 (USD Million)
- Table 61 Latin America SoftPOS market, by End Use 2020 - 2030 (USD Million)
- Table 62 Brazil SoftPOS market, by Enterprise Size 2020 - 2030 (USD Million)
- Table 63 Brazil SoftPOS market, by Operating System 2020 - 2030 (USD Million)
- Table 64 Brazil SoftPOS market, by End Use 2020 - 2030 (USD Million)
- Table 65 MEA SoftPOS market, by Enterprise Size 2020 - 2030 (USD Million)
- Table 66 MEA SoftPOS market, by Operating System 2020 - 2030 (USD Million)
- Table 67 MEA SoftPOS market, by End Use 2020 - 2030 (USD Million)
- Table 68 UAE SoftPOS market, by Enterprise Size 2020 - 2030 (USD Million)
- Table 69 UAE SoftPOS market, by Operating System 2020 - 2030 (USD Million)
- Table 70 UAE SoftPOS market, by End Use 2020 - 2030 (USD Million)
- Table 71 KSA SoftPOS market, by Enterprise Size 2020 - 2030 (USD Million)
- Table 72 KSA SoftPOS market, by Operating System 2020 - 2030 (USD Million)
- Table 73 KSA SoftPOS market, by End Use 2020 - 2030 (USD Million)
- Table 74 South Africa SoftPOS market, by Enterprise Size 2020 - 2030 (USD Million)
- Table 75 South Africa SoftPOS market, by Operating System 2020 - 2030 (USD Million)
- Table 76 South Africa SoftPOS market, by End Use 2020 - 2030 (USD Million)
List of Figures
- Fig. 1 SoftPOS market segmentation
- Fig. 2 Market research process
- Fig. 3 Information procurement
- Fig. 4 Primary research pattern
- Fig. 5 Market research approaches
- Fig. 6 Value chain-based sizing & forecasting
- Fig. 7 Parent market analysis
- Fig. 8 Market formulation & validation
- Fig. 9 SoftPOS market snapshot
- Fig. 10 SoftPOS market segment snapshot
- Fig. 11 SoftPOS market competitive landscape snapshot
- Fig. 12 Market research process
- Fig. 13 Market driver relevance analysis (Current & future impact)
- Fig. 14 Market restraint relevance analysis (Current & future impact)
- Fig. 15 SoftPOS market, Enterprise Sizeoutlook key takeaways (USD Million)
- Fig. 16 SoftPOS market, Enterprise Size movement analysis 2024 & 2030 (USD Million)
- Fig. 17 Micro & Small Business market revenue estimates and forecasts, 2020 - 2030 (USD Million)
- Fig. 18 Medium & Large Business market revenue estimates and forecasts, 2020 - 2030 (USD Million)
- Fig. 19 SoftPOS market: Operating System outlook key takeaways (USD Million)
- Fig. 20 SoftPOS market: Operating System movement analysis 2024 & 2030 (USD Million)
- Fig. 21 Android market revenue estimates and forecasts, 2020 - 2030 (USD Million)
- Fig. 22 iOS market revenue estimates and forecasts, 2020 - 2030 (USD Million)
- Fig. 23 Others market revenue estimates and forecasts, 2020 - 2030 (USD Million)
- Fig. 24 SoftPOS market: End Use outlook key takeaways (USD Million)
- Fig. 25 SoftPOS market: End Use movement analysis 2024 & 2030 (USD Million)
- Fig. 26 Retail market revenue estimates and forecasts, 2020 - 2030 (USD Million)
- Fig. 27 Restaurants revenue estimates and forecasts, 2020 - 2030 (USD Million)
- Fig. 28 Public Transport market revenue estimates and forecasts, 2020 - 2030 (USD Million)
- Fig. 29 Hospitality market revenue estimates and forecasts, 2020 - 2030 (USD Million)
- Fig. 30 Media and Entertainment market revenue estimates and forecasts, 2020 - 2030 (USD Million)
- Fig. 31 Others market revenue estimates and forecasts, 2020 - 2030 (USD Million)
- Fig. 32 Regional marketplace: Key takeaways
- Fig. 33 SoftPOS market: Regional outlook, 2024 & 2030 (USD Million)
- Fig. 34 North America SoftPOS market estimates and forecasts, 2020 - 2030 (USD Million)
- Fig. 35 U.S. SoftPOS market estimates and forecasts, 2020 - 2030 (USD Million)
- Fig. 36 Canada SoftPOS market estimates and forecasts, 2020 - 2030 (USD Million)
- Fig. 37 Mexico SoftPOS market estimates and forecasts, 2020 - 2030 (USD Million)
- Fig. 38 Europe SoftPOS market estimates and forecasts, 2020 - 2030 (USD Million)
- Fig. 39 U.K. SoftPOS market estimates and forecasts, 2020 - 2030 (USD Million)
- Fig. 40 Germany SoftPOS market estimates and forecasts, 2020 - 2030 (USD Million)
- Fig. 41 France SoftPOS market estimates and forecasts, 2020 - 2030 (USD Million)
- Fig. 42 Asia Pacific SoftPOS market estimates and forecasts, 2020 - 2030 (USD Million)
- Fig. 43 China SoftPOS market estimates and forecasts, 2020 - 2030 (USD Million)
- Fig. 44 Japan SoftPOS market estimates and forecasts, 2020 - 2030 (USD Million)
- Fig. 45 India SoftPOS market estimates and forecasts, 2020 - 2030 (USD Million)
- Fig. 46 Australia SoftPOS market estimates and forecasts, 2020 - 2030 (USD Million)
- Fig. 47 South Korea SoftPOS market estimates and forecasts, 2020 - 2030 (USD Million)
- Fig. 48 Latin America SoftPOS market estimates and forecasts, 2020 - 2030 (USD Million)
- Fig. 49 Brazil SoftPOS market estimates and forecasts, 2020 - 2030 (USD Million)
- Fig. 50 MEA SoftPOS market estimates and forecasts, 2020 - 2030 (USD Million)
- Fig. 51 KSA SoftPOS market estimates and forecasts, 2020 - 2030 (USD Million)
- Fig. 52 UAE SoftPOS market estimates and forecasts, 2020 - 2030 (USD Million)
- Fig. 53 South Africa SoftPOS market estimates and forecasts, 2020 - 2030 (USD Million)
- Fig. 54 Strategy framework
- Fig. 55 Company Categorization
SoftPOS Market Growth & Trends:
The global SoftPOS market size is estimated to reach USD 1,243.9 million by 2030, expanding at a CAGR of 23.1% from 2025 to 2030, according to a new report by Grand View Research, Inc. The software point of sale (SoftPOS) is designed for contactless payments, which has become a rapidly adopted payment method among consumers as well as small and medium businesses. Major factors such as the increase of contactless payments and expansion of payment form factors are attributed to the growth of the market. In addition, the global smartphone penetration in the population worldwide and the growing trend to use contactless or touchless payments owing to the COVID-19 pandemic are also driving the market's growth.
SoftPOS is also known as Tap on Mobile or Tap on Phone, which enables smartphones and tablets equipped with NFC capabilities to operate as contactless payment terminals. Consumers and merchants utilize their SoftPOS devices to receive payments from contactless cards and digital wallets, all while capturing PINs and performing additional authentication as required. Furthermore, professionals in the restaurant industry are continuously seeking innovative tools to enhance and streamline the customer experience while simultaneously reducing operational expenses. Thus, the increasing adoption of SoftPOS systems in restaurants is boosting the growth of the market.
The increasing deployment of SoftPOS solutions in smartphones and tabletses by several market players is further driving the growth of the market. For instance, in September 2023, Intesa Sanpaolo, an Italian international banking group, and Nexi, a prominent PayTech in Europe presented a SoftPOS solution. This advanced solution enables merchants to accept payments through their tablets and smartphones. These payments can be made using contactless cards from major schemes (BANCOMAT Pay, PagoBANCOMAT, Visa, Maestro, V-Pay, Mastercard) and through digital wallets (Apple Pay, Google Pay, Huawei Pay, and Samsung Pay).
Consumers prefer the simplicity and speed of making a contactless or touchless payment, becoming the preferred payment solution in most countries around the globe. Adoption of conatactless payments dramatically increased during the COVID-19 pandemic, owing to health concerns and the transaction limit increase. A growing number of businesses and merchants across various sectors started adopting digital payment solutions after the COVID-19 period. This shift is driven by heightened consumer demand and the declining reliance on cash. Thus, a rising shift towards adopting digital payment methods post-pandemic period is propelling the market's growth.
SoftPOS Market Report Highlights:
- Based on enterprise size, For small businesses, SoftPOS system is a lower cost and easier means to accept card payments. These systems are designed to be inexpensive, easy to use, and can be set up quickly, making them an ideal choice for small businesses
- Based on operating system, the iOS segment is expected to grow at a significant CAGR during the forecast period. The number of iPhone users is increasing at a rapid pace. As of September 2023, iPhones had 29.58% of the world's mobile operating system market share, according to StatCounter. Thus, increasing sales and adoption of iPhones across the world is driving the segment's growth
- Based on end-use, the retail segment is anticipated to grow at a significant CAGR during the forecast period. SoftPOS solutions provide an extensive range of advantages that significantly improve the operational efficiency of retail stores. This solution is compatible and highly versatile with various Near-Field Communication (NFC)-enabled devices, including wearables, cashiers, tablets, and smartphones. This compatibility enables retailers to select the device that best suits their requirements, making adoption even more convenient. Thus, demand for SoftPOS is growing in the retail industry owing to its above-mentioned benefits, which ultimately drive the market's growth
- Asia Pacific is expected to grow at a significant CAGR during the forecast period. The growth is attributed to the growing demand for contactless payments across the region
Table of Contents
Chapter 1. Methodology and Scope
- 1.1. Market Segmentation and Scope
- 1.2. Research Methodology
- 1.2.1. Information Procurement
- 1.3. Information or Data Analysis
- 1.4. Methodology
- 1.5. Research Scope and Assumptions
- 1.6. Market Formulation & Validation
- 1.7. List of Data Sources
Chapter 2. Executive Summary
- 2.1. Market Outlook
- 2.2. Segment Outlook
- 2.3. Competitive Insights
Chapter 3. SoftPOS Market Variables, Trends, & Scope
- 3.1. Market Lineage Outlook
- 3.2. Market Dynamics
- 3.2.1. Market Driver Analysis
- 3.2.2. Market Restraint Analysis
- 3.2.3. Industry Challenge
- 3.3. SoftPOS Market Analysis Tools
- 3.3.1. Industry Analysis - Porter's
- 3.3.1.1. Bargaining power of the suppliers
- 3.3.1.2. Bargaining power of the buyers
- 3.3.1.3. Threats of substitution
- 3.3.1.4. Threats from new entrants
- 3.3.1.5. Competitive rivalry
- 3.3.2. PESTEL Analysis
- 3.3.2.1. Political landscape
- 3.3.2.2. Economic and social landscape
- 3.3.2.3. Technological landscape
- 3.3.1. Industry Analysis - Porter's
Chapter 4. SoftPOS Market: Enterprise Size Estimates & Trend Analysis
- 4.1. Segment Dashboard
- 4.2. SoftPOS Market: Enterprise Size Movement Analysis, USD Million, 2024 & 2030
- 4.3. Micro & Small Business
- 4.3.1. Micro & Small Business Market Revenue Estimates and Forecasts, 2020 - 2030 (USD Million)
- 4.4. Medium & Large Business
- 4.4.1. Medium & Large Business Market Revenue Estimates and Forecasts, 2020 - 2030 (USD Million)
Chapter 5. SoftPOS Market: Operating System Estimates & Trend Analysis
- 5.1. Segment Dashboard
- 5.2. SoftPOS Market: Operating System Movement Analysis, USD Million, 2024 & 2030
- 5.3. Android
- 5.3.1. Android Market Revenue Estimates and Forecasts, 2020 - 2030 (USD Million)
- 5.4. iOS
- 5.4.1. iOS Market Revenue Estimates and Forecasts, 2020 - 2030 (USD Million)
- 5.5. Others
- 5.5.1. Others Market Revenue Estimates and Forecasts, 2020 - 2030 (USD Million)
Chapter 6. SoftPOS Market: End Use Estimates & Trend Analysis
- 6.1. Segment Dashboard
- 6.2. SoftPOS Market: End Use Movement Analysis, USD Million, 2024 & 2030
- 6.3. Retail
- 6.3.1. Retail Market Revenue Estimates and Forecasts, 2020 - 2030 (USD Million)
- 6.4. Restaurants
- 6.4.1. Restaurants Revenue Estimates and Forecasts, 2020 - 2030 (USD Million)
- 6.5. Public Transport
- 6.5.1. Public Transport Market Revenue Estimates and Forecasts, 2020 - 2030 (USD Million)
- 6.6. Hospitality
- 6.6.1. Hospitality Market Revenue Estimates and Forecasts, 2020 - 2030 (USD Million)
- 6.7. Media and Entertainment
- 6.7.1. Media and Entertainment Market Revenue Estimates and Forecasts, 2020 - 2030 (USD Million)
- 6.8. Others
- 6.8.1. Others Market Revenue Estimates and Forecasts, 2020 - 2030 (USD Million)
Chapter 7. SoftPOS Market: Regional Estimates & Trend Analysis
- 7.1. SoftPOS Market Share, By Region, 2024 & 2030 (USD Million)
- 7.2. North America
- 7.2.1. North America SoftPOS Market Estimates and Forecasts, 2020 - 2030 (USD Million)
- 7.2.2. U.S.
- 7.2.2.1. U.S. SoftPOS Market Estimates and Forecasts, 2020 - 2030 (USD Million)
- 7.2.3. Canada
- 7.2.3.1. Canada SoftPOS Market Estimates and Forecasts, 2020 - 2030 (USD Million)
- 7.2.4. Mexico
- 7.2.4.1. Mexico SoftPOS Market Estimates and Forecasts, 2020 - 2030 (USD Million)
- 7.3. Europe
- 7.3.1. Europe SoftPOS Market Estimates and Forecasts, 2020 - 2030 (USD Million)
- 7.3.2. U.K.
- 7.3.2.1. U.K. SoftPOS Market Estimates and Forecasts, 2020 - 2030 (USD Million)
- 7.3.3. Germany
- 7.3.3.1. Germany SoftPOS Market Estimates and Forecasts, 2020 - 2030 (USD MILLION)
- 7.3.4. France
- 7.3.4.1. France SoftPOS Market Estimates and Forecasts, 2020 - 2030 (USD Million)
- 7.4. Asia Pacific
- 7.4.1. Asia Pacific SoftPOS Market Estimates and Forecasts, 2020 - 2030 (USD Million)
- 7.4.2. China
- 7.4.2.1. China SoftPOS Market Estimates and Forecasts, 2020 - 2030 (USD Million)
- 7.4.3. Japan
- 7.4.3.1. Japan SoftPOS Market Estimates and Forecasts, 2020 - 2030 (USD Million)
- 7.4.4. India
- 7.4.4.1. India SoftPOS Market Estimates and Forecasts, 2020 - 2030 (USD Million)
- 7.4.5. South Korea
- 7.4.5.1. South Korea SoftPOS Market Estimates and Forecasts, 2020 - 2030 (USD Million)
- 7.4.6. Australia
- 7.4.6.1. Australia SoftPOS Market Estimates and Forecasts, 2020 - 2030 (USD Million)
- 7.5. Latin America
- 7.5.1. Latin America SoftPOS Market Estimates and Forecasts, 2020 - 2030 (USD Million)
- 7.5.2. Brazil
- 7.5.2.1. Brazil SoftPOS Market Estimates and Forecasts, 2020 - 2030 (USD Million)
- 7.6. Middle East and Africa
- 7.6.1. Middle East and Africa SoftPOS Market Estimates and Forecasts, 2020 - 2030 (USD Million)
- 7.6.2. UAE
- 7.6.2.1. UAE SoftPOS Market Estimates and Forecasts, 2020 - 2030 (USD Million)
- 7.6.3. KSA
- 7.6.3.1. KSA SoftPOS Market Estimates and Forecasts, 2020 - 2030 (USD Million)
- 7.6.4. South Africa
- 7.6.4.1. South Africa SoftPOS Market Estimates and Forecasts, 2020 - 2030 (USD Million)
Chapter 8. Competitive Landscape
- 8.1. Company Categorization
- 8.2. Company Market Positioning
- 8.3. Company Heat Map Analysis
- 8.4. Company Profiles/Listing
- 8.4.1. Tidypay
- 8.4.1.1. Participant's Overview
- 8.4.1.2. Financial Performance
- 8.4.1.3. Product Benchmarking
- 8.4.1.4. Strategic Initiatives
- 8.4.2. Worldline
- 8.4.2.1. Participant's Overview
- 8.4.2.2. Financial Performance
- 8.4.2.3. Product Benchmarking
- 8.4.2.4. Strategic Initiatives
- 8.4.3. Alcineo
- 8.4.3.1. Participant's Overview
- 8.4.3.2. Financial Performance
- 8.4.3.3. Product Benchmarking
- 8.4.3.4. Strategic Initiatives
- 8.4.4. Wizzit (Pty) Ltd
- 8.4.4.1. Participant's Overview
- 8.4.4.2. Financial Performance
- 8.4.4.3. Product Benchmarking
- 8.4.4.4. Strategic Initiatives
- 8.4.5. Bindo Labs Group Limited
- 8.4.5.1. Participant's Overview
- 8.4.5.2. Financial Performance
- 8.4.5.3. Product Benchmarking
- 8.4.5.4. Strategic Initiatives
- 8.4.6. Fairbit
- 8.4.6.1. Participant's Overview
- 8.4.6.2. Financial Performance
- 8.4.6.3. Product Benchmarking
- 8.4.6.4. Strategic Initiatives
- 8.4.7. Yazara
- 8.4.7.1. Participant's Overview
- 8.4.7.2. Financial Performance
- 8.4.7.3. Product Benchmarking
- 8.4.7.4. Strategic Initiatives
- 8.4.8. Asseco South Eastern Europe
- 8.4.8.1. Participant's Overview
- 8.4.8.2. Financial Performance
- 8.4.8.3. Product Benchmarking
- 8.4.8.4. Strategic Initiatives
- 8.4.9. CM.com
- 8.4.9.1. Participant's Overview
- 8.4.9.2. Financial Performance
- 8.4.9.3. Product Benchmarking
- 8.4.9.4. Strategic Initiatives
- 8.4.10. Fime SAS
- 8.4.10.1. Participant's Overview
- 8.4.10.2. Financial Performance
- 8.4.10.3. Product Benchmarking
- 8.4.10.4. Strategic Initiatives
- 8.4.1. Tidypay

