|
|
市場調査レポート
商品コード
1376235
ウェアラブルカメラの市場規模、シェア、動向分析レポート:製品別、タイプ別、用途別、地域別、セグメント別予測、2023年~2030年Wearable Camera Market Size, Share & Trend Analysis Report By Product, By Application (Sports & Adventure, Security, Healthcare, Industrial), By Type, By Region, And Segment Forecasts, 2023 - 2030 |
||||||
カスタマイズ可能
|
|||||||


| ウェアラブルカメラの市場規模、シェア、動向分析レポート:製品別、タイプ別、用途別、地域別、セグメント別予測、2023年~2030年 |
|
出版日: 2023年10月30日
発行: Grand View Research
ページ情報: 英文 90 Pages
納期: 2~10営業日
|

- 全表示
- 概要
- 図表
- 目次
ウェアラブルカメラ市場の成長と動向:
Grand View Research, Inc.の最新レポートによると、世界のウェアラブルカメラ市場規模は、2023年から2030年にかけて14.4%のCAGRで、2030年までに228億3,000万米ドルに達すると予測されています。
カメラの利便性と卓越した体験に対する需要の高まりが、ウェアラブルカメラの成長と浸透を高めています。スマートフォンの需要拡大、インターネットへの容易なアクセス、高速データネットワークにより、これらのカメラの利用が増加しています。セキュリティや医療分野でのウェアラブルカメラの採用拡大により、2025年までに市場に革命が起こると予測されています。
市場は、ヘッドマウント、ボディマウント、イヤーマウント・スマートグラスなど、様々なタイプのウェアラブルカメラに基づいてセグメント化されています。用途別に見ると、市場はスポーツ&アドベンチャー、セキュリティ、ヘルスケア、産業用に区分されています。スポーツ&アドベンチャー分野は、スポーツやアドベンチャー活動の人気の高まりにより、規模的には最大のアプリケーション分野であり、予測期間中に市場を独占すると予想されます。
ウェアラブルカメラの人気の高まりは、より良い製品を作るための研究開発への投資をメーカーに促しています。メーカーは、ユーザーエクスペリエンスを向上させるために、新製品を同時に開発するために多額の投資を行っていることが確認されています。さらに、研究者は信頼性が高くコスト効率の高い製品の革新に注力しています。
ウェアラブルカメラ市場レポートハイライト
- 製品セグメントは付属品とカメラに分類されます。2022年の市場シェアはカメラが87.6%で最大。
- ヘッドマウントセグメントが2022年に67.8%の最高収益シェアで市場を独占。
- ウェアラブルカメラの需要が伸びている背景には、SNSで体験を共有することの人気の高まりがあります。
- ウェアラブルカメラは、医療分野でエキサイティングな新しいアプリケーションを提供します。例えば、ウェアラブルカメラで撮影された一人称の手術映像がトレーニング教材として使用される手術トレーニングに使用されます。
- 2022年のウェアラブルカメラ市場は、北米が42.7%の収益シェアで最大を占めました。
目次
第1章 調査手法と範囲
第2章 エグゼクティブサマリー
第3章 ウェアラブルカメラ市場の変数、動向、範囲
- 市場系統の見通し
- 親市場の見通し
- 関連/付随市場の見通し
- 普及と成長の見通しマッピング
- 市場力学
- 市場促進要因分析
- 市場抑制要因分析
- ウェアラブルカメラ市場分析ツール
- 業界分析- ポーターのファイブフォース分析
- PESTEL分析
第4章 ウェアラブルカメラ:製品の推定・動向分析
- ウェアラブルカメラ市場:重要なポイント
- ウェアラブルカメラ市場:動向と市場シェア分析、2022年と2030年
- カメラ
- 付属品
第5章 ウェアラブルカメラ:タイプの推定・動向分析
- ウェアラブルカメラ市場:重要なポイント
- ウェアラブルカメラ市場:動向と市場シェア分析、2022年と2030年
- ヘッドマウント
- ボディマウント
- イヤーマウントとスマートグラス
第6章 ウェアラブルカメラ市場:用途の推定・動向分析
- ウェアラブルカメラ市場:重要なポイント
- ウェアラブルカメラ市場:動向と市場シェア分析、2022年と2030年
- スポーツ・アドベンチャー
- セキュリティ
- ヘルスケア
- 産業
第7章 ウェアラブルカメラ市場:地域の推定・動向分析
- 地域別の展望
- 地域別のウェアラブルカメラ市場:重要なポイント
- 北米
- 市場推計・予測、2018~2030年
- 米国
- カナダ
- 欧州
- 英国
- ドイツ
- フランス
- アジア太平洋地域
- 日本
- 中国
- インド
- オーストラリア
- 韓国
- ラテンアメリカ
- ブラジル
- メキシコ
- 中東・アフリカ
- 南アフリカ
- サウジアラビア
- アラブ首長国連邦
第8章 競合情勢
- 主要市場参入企業による最近の動向と影響分析
- 市場参入企業の分類
- JVCKENWOOD USA Corporation
- Contour
- Sony Corporation
- Xiaomi
- VIEVU LLC
- Axon Enterprise, Inc.
- Pinnacle Response Ltd.
- Narrative AB
- Garmin Ltd.
- DRIFT
- GoPro Inc.
List of Tables
- Table 1 List of Abbreviations
- Table 2 North America wearable camera market, by product, 2018 - 2030 (USD Million)
- Table 3 North America wearable camera market, by type, 2018 - 2030 (USD Million)
- Table 4 North America wearable camera market, by application, 2018 - 2030 (USD Million)
- Table 5 North America wearable camera market, by region, 2018 - 2030 (USD Million)
- Table 6 U.S. wearable camera market, by product, 2018 - 2030 (USD Million)
- Table 7 U.S. wearable camera market, by type, 2018 - 2030 (USD Million)
- Table 8 U.S. wearable camera market, by application, 2018 - 2030 (USD Million)
- Table 9 Canada wearable camera market, by product, 2018 - 2030 (USD Million)
- Table 10 Canada wearable camera market, by type, 2018 - 2030 (USD Million)
- Table 11 Canada wearable camera market, by application, 2018 - 2030 (USD Million)
- Table 12 Europe wearable camera market, by product, 2018 - 2030 (USD Million)
- Table 13 Europe wearable camera market, by type, 2018 - 2030 (USD Million)
- Table 14 Europe wearable camera market, by application, 2018 - 2030 (USD Million)
- Table 15 Europe wearable camera market, by region, 2018 - 2030 (USD Million)
- Table 16 Germany wearable camera market, by product, 2018 - 2030 (USD Million)
- Table 17 Germany wearable camera market, by type, 2018 - 2030 (USD Million)
- Table 18 Germany wearable camera market, by application, 2018 - 2030 (USD Million)
- Table 19 UK wearable camera market, by product, 2018 - 2030 (USD Million)
- Table 20 UK wearable camera market, by type, 2018 - 2030 (USD Million)
- Table 21 UK wearable camera market, by application, 2018 - 2030 (USD Million)
- Table 22 France wearable camera market, by product, 2018 - 2030 (USD Million)
- Table 23 France wearable camera market, by type, 2018 - 2030 (USD Million)
- Table 24 France wearable camera market, by application, 2018 - 2030 (USD Million)
- Table 25 Asia Pacific wearable camera market, by product, 2018 - 2030 (USD Million)
- Table 26 Asia Pacific wearable camera market, by type, 2018 - 2030 (USD Million)
- Table 27 Asia Pacific wearable camera market, by application, 2018 - 2030 (USD Million)
- Table 28 Asia Pacific wearable camera market, by region, 2018 - 2030 (USD Million)
- Table 29 Japan wearable camera market, by product, 2018 - 2030 (USD Million)
- Table 30 Japan wearable camera market, by type, 2018 - 2030 (USD Million)
- Table 31 Japan wearable camera market, by application, 2018 - 2030 (USD Million)
- Table 32 China wearable camera market, by product, 2018 - 2030 (USD Million)
- Table 33 China wearable camera market, by type, 2018 - 2030 (USD Million)
- Table 34 China wearable camera market, by application, 2018 - 2030 (USD Million)
- Table 35 India wearable camera market, by product, 2018 - 2030 (USD Million)
- Table 36 India wearable camera market, by type, 2018 - 2030 (USD Million)
- Table 37 India wearable camera market, by application, 2018 - 2030 (USD Million)
- Table 38 Australia wearable camera market, by product, 2018 - 2030 (USD Million)
- Table 39 Australia wearable camera market, by type, 2018 - 2030 (USD Million)
- Table 40 Australia wearable camera market, by application, 2018 - 2030 (USD Million)
- Table 41 South Korea wearable camera market, by product, 2018 - 2030 (USD Million)
- Table 42 South Korea wearable camera market, by type, 2018 - 2030 (USD Million)
- Table 43 South Korea wearable camera market, by application, 2018 - 2030 (USD Million)
- Table 44 Latin America wearable camera market, by product, 2018 - 2030 (USD Million)
- Table 45 Latin America wearable camera market, by type, 2018 - 2030 (USD Million)
- Table 46 Latin America wearable camera market, by application, 2018 - 2030 (USD Million)
- Table 47 Latin America wearable camera market, by region, 2018 - 2030 (USD Million)
- Table 48 Brazil wearable camera market, by product, 2018 - 2030 (USD Million)
- Table 49 Brazil wearable camera market, by type, 2018 - 2030 (USD Million)
- Table 50 Brazil wearable camera market, by application, 2018 - 2030 (USD Million)
- Table 51 Mexico wearable camera market, by product, 2018 - 2030 (USD Million)
- Table 52 Mexico wearable camera market, by type, 2018 - 2030 (USD Million)
- Table 53 Mexico wearable camera market, by application, 2018 - 2030 (USD Million)
- Table 54 Middle East and Africa wearable camera market, by product, 2018 - 2030 (USD Million)
- Table 55 Middle East and Africa wearable camera market, by type, 2018 - 2030 (USD Million)
- Table 56 Middle East and Africa wearable camera market, by application, 2018 - 2030 (USD Million)
- Table 57 Middle East and Africa wearable camera market, by region, 2018 - 2030 (USD Million)
- Table 58 South Africa wearable camera market, by product, 2018 - 2030 (USD Million)
- Table 59 South Africa wearable camera market, by type, 2018 - 2030 (USD Million)
- Table 60 South Africa wearable camera market, by application, 2018 - 2030 (USD Million)
- Table 61 Saudi Arabia wearable camera market, by product, 2018 - 2030 (USD Million)
- Table 62 Saudi Arabia wearable camera market, by type, 2018 - 2030 (USD Million)
- Table 63 Saudi Arabia wearable camera market, by application, 2018 - 2030 (USD Million)
- Table 64 UAE wearable camera market, by product, 2018 - 2030 (USD Million)
- Table 65 UAE wearable camera market, by type, 2018 - 2030 (USD Million)
- Table 66 UAE wearable camera market, by application, 2018 - 2030 (USD Million)
List of Figures
- Fig. 1 Market research process
- Fig. 2 Data triangulation techniques
- Fig. 3 Primary research pattern
- Fig. 4 Market research approaches
- Fig. 5 Value-chain-based sizing & forecasting
- Fig. 6 QFD modeling for market share assessment
- Fig. 7 Market formulation & validation
- Fig. 8 Wearable camera: Market outlook
- Fig. 9 Wearable camera: Competitive insights
- Fig. 10 Parent market outlook
- Fig. 11 Related/ancillary market outlook
- Fig. 12 Penetration and growth prospect mapping
- Fig. 13 Industry value chain analysis
- Fig. 14 Wearable camera market driver impact
- Fig. 15 Wearable camera market restraint impact
- Fig. 16 Wearable camera market strategic initiatives analysis
- Fig. 17 Wearable camera market: Product movement analysis
- Fig. 18 Wearable camera market: Product outlook and key takeaways
- Fig. 19 Cameras market estimates and forecasts, 2018 - 2030 (USD Million)
- Fig. 20 Accessories market estimates and forecasts, 2018 - 2030 (USD Million)
- Fig. 21 Wearable camera market: Type movement analysis
- Fig. 22 Wearable camera market: Type outlook and key takeaways
- Fig. 23 Head mount market estimates and forecasts, 2018 - 2030 (USD Million)
- Fig. 24 Body mount market estimates and forecasts, 2018 - 2030 (USD Million)
- Fig. 25 Ear mount & smart glass market estimates and forecasts, 2018 - 2030 (USD Million)
- Fig. 26 Wearable camera market: Application movement analysis
- Fig. 27 Wearable camera market: Application outlook and key takeaways
- Fig. 28 Sports & adventure market estimates and forecasts, 2018 - 2030 (USD Million)
- Fig. 29 Security market estimates and forecasts, 2018 - 2030 (USD Million)
- Fig. 30 Healthcare market estimates and forecasts, 2018 - 2030 (USD Million)
- Fig. 31 Industrial market estimates and forecasts, 2018 - 2030 (USD Million)
- Fig. 32 Global wearable camera market: Regional movement analysis
- Fig. 33 Global wearable camera market: Regional outlook and key takeaways
- Fig. 34 North America market estimates and forecasts, 2018 - 2030 (USD Million)
- Fig. 35 U.S. market estimates and forecasts, 2018 - 2030 (USD Million)
- Fig. 36 Canada market estimates and forecasts, 2018 - 2030 (USD Million)
- Fig. 37 Europe market estimates and forecasts, 2018 - 2030 (USD Million)
- Fig. 38 U.K. market estimates and forecasts, 2018 - 2030 (USD Million)
- Fig. 39 Germany market estimates and forecasts, 2018 - 2030 (USD Million)
- Fig. 40 France market estimates and forecasts, 2018 - 2030 (USD Million)
- Fig. 41 Asia Pacific market estimates and forecasts, 2018 - 2030 (USD Million)
- Fig. 42 Japan market estimates and forecasts, 2018 - 2030 (USD Million)
- Fig. 43 China market estimates and forecasts, 2018 - 2030 (USD Million)
- Fig. 44 India market estimates and forecasts, 2018 - 2030 (USD Million)
- Fig. 45 Australia market estimates and forecasts, 2018 - 2030 (USD Million)
- Fig. 46 South Korea market estimates and forecasts, 2018 - 2030 (USD Million)
- Fig. 47 Latin America market estimates and forecasts, 2018 - 2030 (USD Million)
- Fig. 48 Brazil market estimates and forecasts, 2018 - 2030 (USD Million)
- Fig. 49 Mexico market estimates and forecasts, 2018 - 2030 (USD Million)
- Fig. 50 Middle East and Africa market estimates and forecasts, 2018 - 2030 (USD Million)
- Fig. 51 Saudi Arabia market estimates and forecasts, 2018 - 2030 (USD Million)
- Fig. 52 South Africa market estimates and forecasts, 2018 - 2030 (USD Million)
- Fig. 53 UAE market estimates and forecasts, 2018 - 2030 (USD Million)
earable Camera Market Growth & Trends:
The global wearable camera market size is expected to reach USD 22.83 billion by 2030, at a CAGR of 14.4% from 2023 to 2030, according to a new report by Grand View Research, Inc.. The growing demand for convenience and exceptional experience of cameras has increased the growth and penetration of wearable cameras. The growing demand for smartphones, easy accessibility of the internet, and high-speed data networks have resulted in the increasing usage of these cameras. The growing adoption of wearable cameras in the security and medical sectors is anticipated to revolutionize the market by 2025.
The market has been segmented based on varied types of wearable cameras, such as head mount, body mount, and ear mount & smart glass. Based on applications, the market has been segmented into sports & adventure, security, healthcare, and industrial. The sports & adventure sector is the largest application sector in terms of size and is expected to dominate the market over the forecast period, owing to the rising popularity of sports and adventure activities.
The growing popularity of wearable cameras is encouraging manufacturers to invest in research & development for creating better products. Manufacturers have been observed making significant investments to simultaneously develop new products in an effort to enhance user experience. Additionally, researchers are focusing on innovating reliable and cost-effective products.
Wearable Camera Market Report Highlights:
- The product segment is categorized into accessories and camera. The camera held the largest market share of 87.6% in 2022
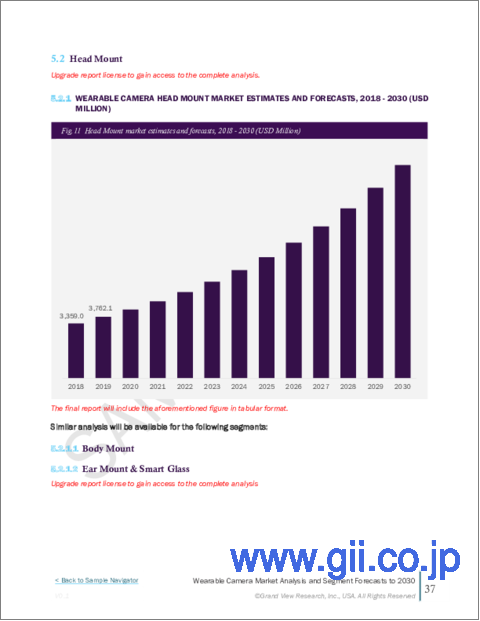
- The head mount segment dominated the market with the highest revenue share of 67.8% in 2022
- The growing demand for wearable cameras can be accredited to the growing popularity of sharing experiences on social networking sites.
- Wearable cameras offer exciting new applications in the medical field. For instance, they are used for surgical training where the first-person surgical video captured by the wearable camera is used as a training resource.
- North America dominated the wearable camera market with the largest revenue share of 42.7% in 2022
Table of Contents
Chapter 1. Methodology and Scope
- 1.1. Market Segmentation & Scope
- 1.1.1. Product
- 1.1.2. Type
- 1.1.3. Application
- 1.1.4. Regional scope
- 1.1.5. Estimates and forecast timeline
- 1.2. Research Methodology
- 1.3. Information Procurement
- 1.3.1. Purchased database
- 1.3.2. GVR's internal database
- 1.3.3. Secondary route of administrations
- 1.3.4. Primary research
- 1.3.5. Details of primary research
- 1.4. Information or Data Analysis
- 1.5. Market Formulation & Validation
- 1.6. Model Details
- 1.7. List of Secondary Sources
- 1.8. List of Primary Sources
- 1.9. Objectives
Chapter 2. Executive Summary
- 2.1. Market Outlook
- 2.2. Segment Outlook
- 2.2.1. Product
- 2.2.2. Type
- 2.2.3. Application
- 2.2.4. Regional outlook
- 2.3. Competitive Insights
Chapter 3. Wearable Camera Market Variables, Trends & Scope
- 3.1. Market Lineage Outlook
- 3.1.1. Parent market outlook
- 3.1.2. Related/ancillary market outlook
- 3.2. Penetration & Growth Prospect Mapping
- 3.3. Market Dynamics
- 3.3.1. Market driver analysis
- 3.3.2. Market restraint analysis
- 3.4. Wearable Camera Market Analysis Tools
- 3.4.1. Industry Analysis - Porter's
- 3.4.1.1. Supplier power
- 3.4.1.2. Buyer power
- 3.4.1.3. Substitution threat
- 3.4.1.4. Threat of new entrant
- 3.4.1.5. Competitive rivalry
- 3.4.2. PESTEL Analysis
- 3.4.2.1. Political landscape
- 3.4.2.2. Technological landscape
- 3.4.2.3. Economic landscape
- 3.4.1. Industry Analysis - Porter's
Chapter 4. Wearable Camera: Product Estimates & Trend Analysis
- 4.1. Wearable Camera Market: Key Takeaways
- 4.2. Wearable Camera Market: Movement & Market Share Analysis, 2022 & 2030
- 4.3. Cameras
- 4.3.1. Cameras market estimates and forecasts, 2018 to 2030 (USD Million)
- 4.4. Accessories
- 4.4.1. Accessories market estimates and forecasts, 2018 to 2030 (USD Million)
Chapter 5. Wearable Camera: Type Estimates & Trend Analysis
- 5.1. Wearable Camera Market: Key Takeaways
- 5.2. Wearable Camera Market: Movement & Market Share Analysis, 2022 & 2030
- 5.3. Head mount
- 5.3.1. Head mount market estimates and forecasts, 2018 to 2030 (USD Million)
- 5.4. Body mount
- 5.4.1. Body mount market estimates and forecasts, 2018 to 2030 (USD Million)
- 5.5. Ear mount & smart glass
- 5.5.1. Ear mount & smart glass market estimates and forecasts, 2018 to 2030 (USD Million)
Chapter 6. Wearable Camera Market: Application Estimates & Trend Analysis
- 6.1. Wearable Camera Market: Key Takeaways
- 6.2. Wearable Camera Market: Movement & Market Share Analysis, 2022 & 2030
- 6.3. Sports & adventure
- 6.3.1. Sports & adventure market estimates and forecasts, 2018 to 2030 (USD Million)
- 6.4. Security
- 6.4.1. Security market estimates and forecasts, 2018 to 2030 (USD Million)
- 6.5. Healthcare
- 6.5.1. Healthcare market estimates and forecasts, 2018 to 2030 (USD Million)
- 6.6. Industrial
- 6.6.1. Industrial market estimates and forecasts, 2018 to 2030 (USD Million)
Chapter 7. Wearable Camera Market: Regional Estimates & Trend Analysis
- 7.1. Regional Outlook
- 7.2. Wearable Camera Market by Region: Key Takeaway
- 7.3. North America
- 7.3.1. Market estimates and forecasts, 2018 - 2030 (Revenue, USD Million)
- 7.3.2. U.S.
- 7.3.2.1. Market estimates and forecasts, 2018 - 2030 (Revenue, USD Million)
- 7.3.3. Canada
- 7.3.3.1. Market estimates and forecasts, 2018 - 2030 (Revenue, USD Million)
- 7.4. Europe
- 7.4.1. U.K.
- 7.4.1.1. Market estimates and forecasts, 2018 - 2030 (Revenue, USD Million)
- 7.4.2. Germany
- 7.4.2.1. Market estimates and forecasts, 2018 - 2030 (Revenue, USD Million)
- 7.4.3. France
- 7.4.3.1. Market estimates and forecasts, 2018 - 2030 (Revenue, USD
- 7.4.1. U.K.
- 7.5. Asia Pacific
- 7.5.1. Japan
- 7.5.1.1. Market estimates and forecasts, 2018 - 2030 (Revenue, USD Million)
- 7.5.2. China
- 7.5.2.1. Market estimates and forecasts, 2018 - 2030 (Revenue, USD Million)
- 7.5.3. India
- 7.5.3.1. Market estimates and forecasts, 2018 - 2030 (Revenue, USD Million)
- 7.5.4. Australia
- 7.5.4.1. Market estimates and forecasts, 2018 - 2030 (Revenue, USD Million)
- 7.5.5. South Korea
- 7.5.5.1. Market estimates and forecasts, 2018 - 2030 (Revenue, USD Million)
- 7.5.1. Japan
- 7.6. Latin America
- 7.6.1. Brazil
- 7.6.1.1. Market estimates and forecasts, 2018 - 2030 (Revenue, USD Million)
- 7.6.2. Mexico
- 7.6.2.1. Market estimates and forecasts, 2018 - 2030 (Revenue, USD Million)
- 7.6.1. Brazil
- 7.7. MEA
- 7.7.1. South Africa
- 7.7.1.1. Market estimates and forecasts, 2018 - 2030 (Revenue, USD Million)
- 7.7.2. Saudi Arabia
- 7.7.2.1. Market estimates and forecasts, 2018 - 2030 (Revenue, USD Million)
- 7.7.3. UAE
- 7.7.3.1. Market estimates and forecasts, 2018 - 2030 (Revenue, USD Million)
- 7.7.1. South Africa
Chapter 8. Competitive Landscape
- 8.1. Recent Developments & Impact Analysis, By Key Market Participants
- 8.2. Market Participant Categorization
- 8.2.1. JVCKENWOOD USA Corporation
- 8.2.1.1. Company overview
- 8.2.1.2. Financial performance
- 8.2.1.3. Product benchmarking
- 8.2.1.4. Strategic initiatives
- 8.2.2. Contour
- 8.2.2.1. Company overview
- 8.2.2.2. Financial performance
- 8.2.2.3. Product benchmarking
- 8.2.2.4. Strategic initiatives
- 8.2.3. Sony Corporation
- 8.2.3.1. Company overview
- 8.2.3.2. Financial performance
- 8.2.3.3. Product benchmarking
- 8.2.3.4. Strategic initiatives
- 8.2.4. Xiaomi
- 8.2.4.1. Company overview
- 8.2.4.2. Financial performance
- 8.2.4.3. Product benchmarking
- 8.2.4.4. Strategic initiatives
- 8.2.5. VIEVU LLC
- 8.2.5.1. Company overview
- 8.2.5.2. Financial performance
- 8.2.5.3. Product benchmarking
- 8.2.5.4. Strategic initiatives
- 8.2.6. Axon Enterprise, Inc.
- 8.2.6.1. Company overview
- 8.2.6.2. Financial performance
- 8.2.6.3. Product benchmarking
- 8.2.6.4. Strategic initiatives
- 8.2.7. Pinnacle Response Ltd.
- 8.2.7.1. Company overview
- 8.2.7.2. Financial performance
- 8.2.7.3. Product benchmarking
- 8.2.7.4. Strategic initiatives
- 8.2.8. Narrative AB
- 8.2.8.1. Company overview
- 8.2.8.2. Financial performance
- 8.2.8.3. Product benchmarking
- 8.2.8.4. Strategic initiatives
- 8.2.9. Garmin Ltd.
- 8.2.9.1. Company overview
- 8.2.9.2. Financial performance
- 8.2.9.3. Product benchmarking
- 8.2.9.4. Strategic initiatives
- 8.2.10. DRIFT
- 8.2.10.1. Company overview
- 8.2.10.2. Financial performance
- 8.2.10.3. Product benchmarking
- 8.2.10.4. Strategic initiatives
- 8.2.11. GoPro Inc.
- 8.2.11.1. Company overview
- 8.2.11.2. Financial performance
- 8.2.11.3. Product benchmarking
- 8.2.11.4. Strategic initiatives
- 8.2.1. JVCKENWOOD USA Corporation
